I’m posting this one to illustrate the use of OSM data as a basis for street light intensity/density.
It is not meant to be representing correct exposure but I find it clearly shows light density features which are matching road classification found in OSM, as well as light density depicted in my FS2020 SFO shots above.
Here is a photo:

Compare with this OSM “Transport” layer view:
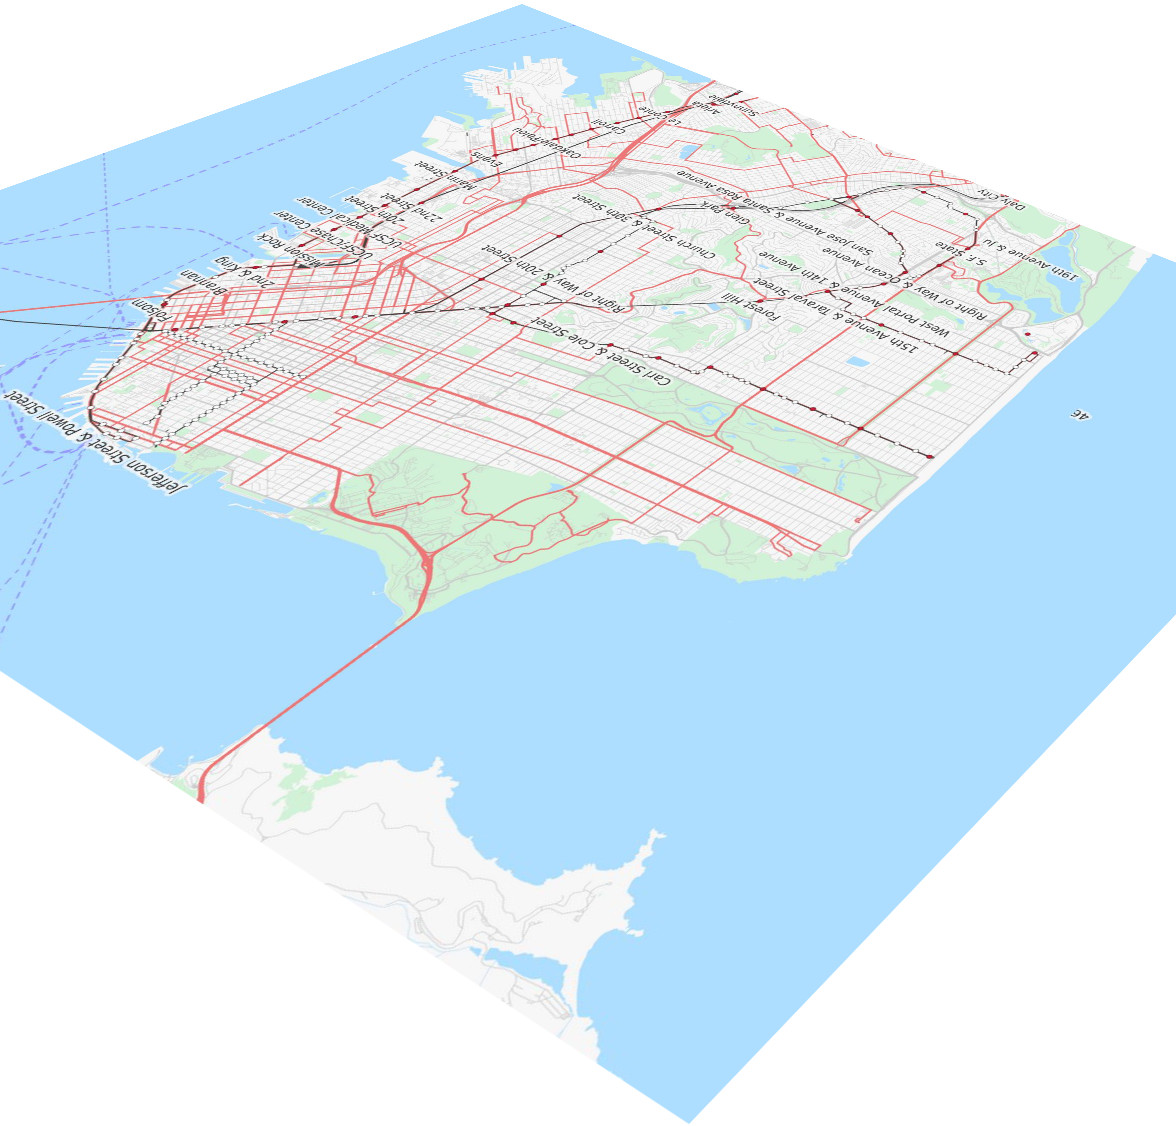
https://www.openstreetmap.org/#map=13/37.7934/-122.4483&layers=T
*credits and source: https://www.gizmodo.com.au/2015/03/these-incredible-aerial-views-of-san-francisco-are-just-jaw-dropping/