Hi everyone,
Most of us judge a landing by one number — vertical speed at touchdown. I spent the last year building a tool that evaluates twelve, the way real airline FOQA (Flight Operational Quality Assurance) programs do. It’s called SQWK Flight Review and it works with MSFS 2024 (with legacy MSFS 2020 support for telemetry and landing screenshots).
Download: https://flightsim.to/addon/107015/sqwk-flight-review
TLDR;
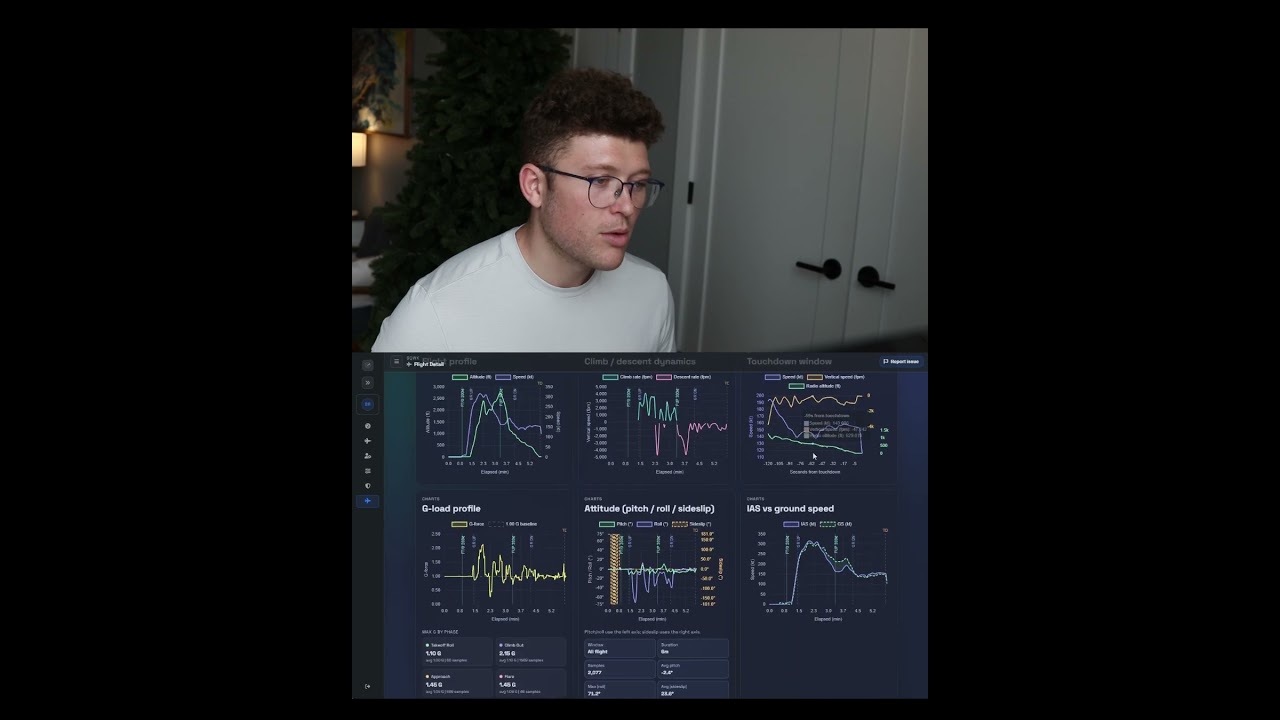
How it works:
Install the telemetry exporter (runs in the background via SimConnect). Fly normally. After landing, open the web dashboard from any device and review your debrief.
12-metric scoring system:
Every flight is scored across 12 weighted metrics spanning three phases:
-
Landing (64%): Landing rate, touchdown G-force, bounce count, centerline deviation, touchdown zone distance, flare quality, rollout stability, and touchdown bank angle
-
Approach (12%): Composite approach stability covering speed consistency, descent rate, bank, sideslip, and glideslope tracking
-
Takeoff (24%): Takeoff distance, rotation accuracy, and flap overspeed monitoring
Scores are graded 0 - 100 (Excellent / Strong / Solid / Developing / Needs Focus) with up to 15 bonus points for operational difficulty: weather, crosswind, visibility, runway surface, time of day, and lighting.
Aircraft-aware analysis:

Scoring adapts to what you’re flying. 115 aircraft-tuned profiles (Pro) include real POH-derived V-speeds, approach configurations, and class-specific thresholds for GA pistons, turboprops, airliners, military fast jets, and helicopters. The aircraft cheatsheet gives you Vref, Vapp, Vso, Vs1, flap limits, and crosswind data at a glance. Procedural guidance cards reference specific manual sections, for example, the 737 MAX 8 profile cites Boeing 737 FCTM Chapter 6, Landing for its approach speed, touchdown energy, and stabilized approach gate. The TBM 930 profile uses Vref 85 kt from the POH. More profiles on the way.
3D approach replay:

Reconstruct your approach in an interactive 3D view with runway geometry, centerline, threshold markings, glideslope reference grid, altitude gates at 1000 ft / 500 ft / short final / threshold, touchdown point overlay, and phase coloring. Scrub through the timeline to replay any moment.
Exceedance detection:

Flags structural limits, speed violations (flap/gear overspeed, Vne), unstable approaches, and configuration advisories, the same categories real airline FDM programs monitor.
What makes this different from landing-rate tools:

Vertical speed alone is a poor measure of landing quality. A -300 fpm landing in a 25kt crosswind thunderstorm at night scores differently than the same touchdown on a calm CAVOK afternoon. SQWK evaluates the full arrival, not just the last second before touchdown.
Trend tracking:

Dashboard trends show your landing score, vertical speed, centerline deviation, and approach stability across recent flights. Compare each flight against your rolling 10-flight baseline to spot improvements and recurring patterns.
SimBrief integration:
Link your SimBrief account in settings and SQWK will pull your dispatch plans automatically, so your actual flight is compared against what you planned. Route, flight level, fuel, and block-time deltas are right there in the debrief.
Pricing:
- Free: fully functional: 10 flights/month, 30-day retention, 5 Hz telemetry, core scoring, approach replay, trend tracking, flight sharing
- Pro: unlimited flights, 1-year retention, 30 Hz replay-grade telemetry, 115 aircraft profiles, JSON/CSV/KML/PLN exports, flight photos
Free accounts can install, sign in, fly, upload, and review flights end-to-end with no restrictions on core analysis.
Download: https://flightsim.to/addon/107015/sqwk-flight-review
Dashboard & account: https://sqwk.io
Changelog: https://sqwk.io/changelog
Feedback always welcome! especially from anyone with deep experience in a specific airframe. If you fly an aircraft I’ve profiled and see a scoring anchor that doesn’t match your real-world reference, please tell me. Getting those values right per airframe is the goal.


