2024.12.31 - v1.2.8.0 - Rolling Cache data volumes during a normal slow sightseeing flight
I wanted to start into the new year with a more constructive test in order to investigate those questions:
- How much data is actually written to the
RollingCache.cccfile during a normal 4.5 hour flight? - How much impact does the altitude have?
- How much difference comes from regions with TIN landscape?
I should repeat some info about my FS2024 settings, because they do have a significant impact on this Test P:
RollingCache.cccis at 16 GB and contains the data from Test C- … so it is 100% full but contains no data for the target region or the Draco aircraft.
- All graphics settings are at the highest possible level … “Ultra plus”
- The graphics settings include:
- “Off Screen Terrain Pre-Caching” = Ultra
- “Dynamic Settings” is OFF … so no “Framerate Target”
- The graphics settings include:
- Live weather is OFF … I use “Clear Skies”.
- Live air traffic is OFF.
- But the static ground aircraft and vehicles are at maximum.
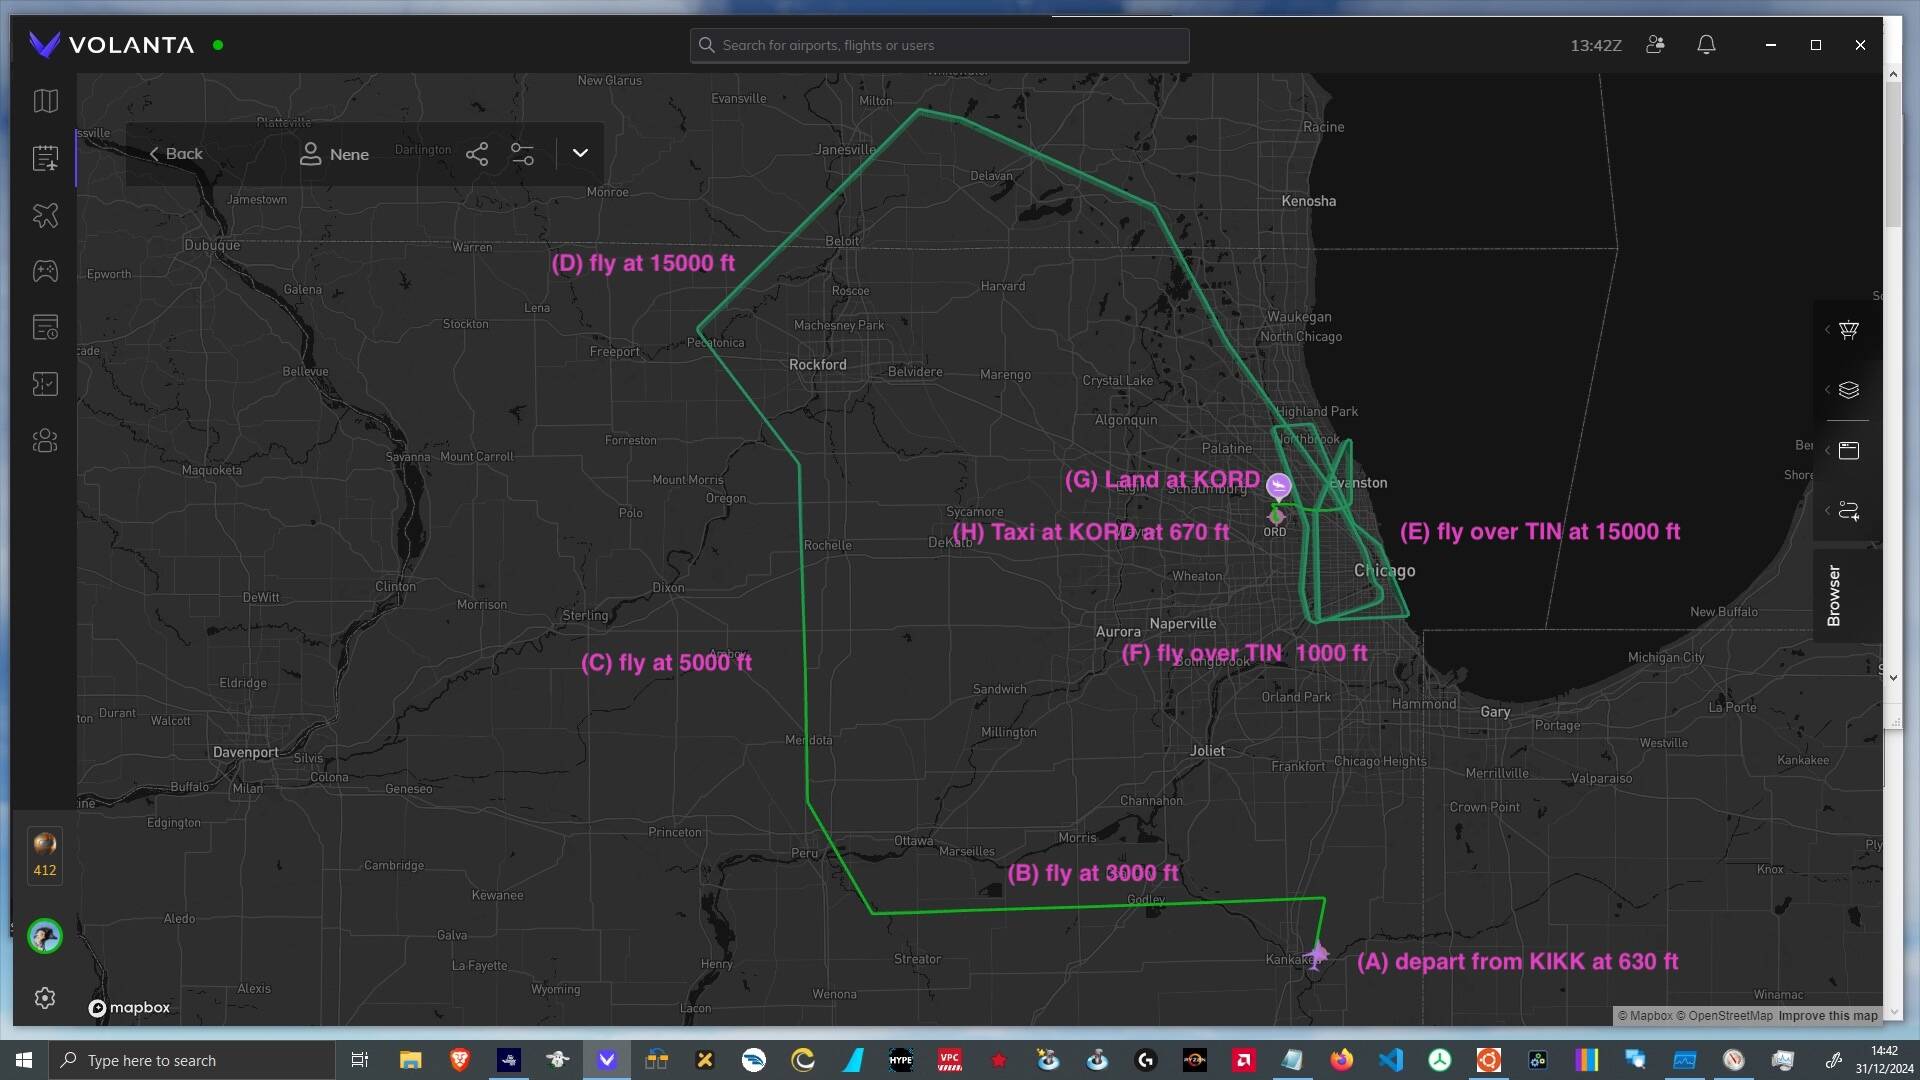
During Test P my flight took the following steps along the flight path which can be seen in the picture below:
- I picked a day where the servers should be under less load
- … and watched the average throughput via
Resource Monitorto double-check. - Launch duration was the normal 3 minutes
- … which already indicated “not too stressed” servers.
- … and watched the average throughput via
- I picked the US state of Illinois
- … as it is mostly flat … so ground data volume is a best case example
- … but it also has a large TIN landscape around the city of Chicago
- … which can be seen as a data volume worst case example.
- I started a normal flight with the Draco aircraft
- … as it can fly fairly slow on autopilot.
- All flying took place at 70 ktas.
- … as it can fly fairly slow on autopilot.
- I tried to avoid getting too close to airports during the flight
- … as airports can cause a lot of additional data downloads.
- I tried to stay in the external camera view as much as possible
- … where a lot more landscape is visible than from the cockpit.
- (A) marks the departure at KIKK
- … which is a small airport at an altitude of around 630 ft.
- (B) flying at 3,000 ft over flat normal landscape
- … for around 50 minutes.
- This did contain some TIN landscape around KIKK.
- (C) flying at 5,000 ft
- … for around 30 minutes.
- (D) flying at 15,000 ft
- … for around 70 minutes.
- (E) flying at 15,000 ft over a TIN landscape
- … for around 50 minutes.
- (F) flying at 1,000 ft over a TIN landscape
- … for around 40 minutes.
- In order to allow for such a rapid drop in altitude I switched to the drone came during this phase.
- (G) approach and landing at KORD international airport
… took around 10 minutes. - (H) taxiing with 20 ktas at KORD
… for around 20 minutes. - In total this flight lasted for 4.5 hours.
The table below contains a summary of the most important metrics. Please keep in mind that this is intended as a “rule of thumb” analysis.:
- Phase … references to flight segments described above.
- Time … the time (hh.mm) at the end of that phase.
- RC MB w (sum) … shows the MB which have been written to the
RollingCache.ccc.- This metric was taken from a “byte perfect”
Process Monitorevent recording.
- This metric was taken from a “byte perfect”
- RC MB w/10m … shows the MB which on average have been written for each period of 10 minutes.
- IP Mbps read … shows the Megabits per second which on average would be needed to transfer the necessary data.
- Since TCP/IP is adding protocol overhead a simplified “factor 10” conversion is used from MByte to Mbit.
| Phase | Time | RC MB w (sum) | RC MB w/10m | IP Mbps read |
|---|---|---|---|---|
| A | 10.10 | 2,820 | n.a. | n.a. |
| B | 11.00 | 4,950 | 426 | 7 |
| C | 11.30 | 6,080 | 377 | 6 |
| D | 12.40 | 7,730 | 235 | 4 |
| E | 13.30 | 9,360 | 326 | 5 |
| F | 14.10 | 21,460 | 3,025 | 50 |
| G | 14.20 | 22,700 | 1,240 | 20 |
| H | 14.40 | 24,310 | 805 | 13 |
During phase (A) I really tried to push the data usage up, by checking out every parked aircraft in detail. So this might not reflect a normal FS2024 usage pattern.
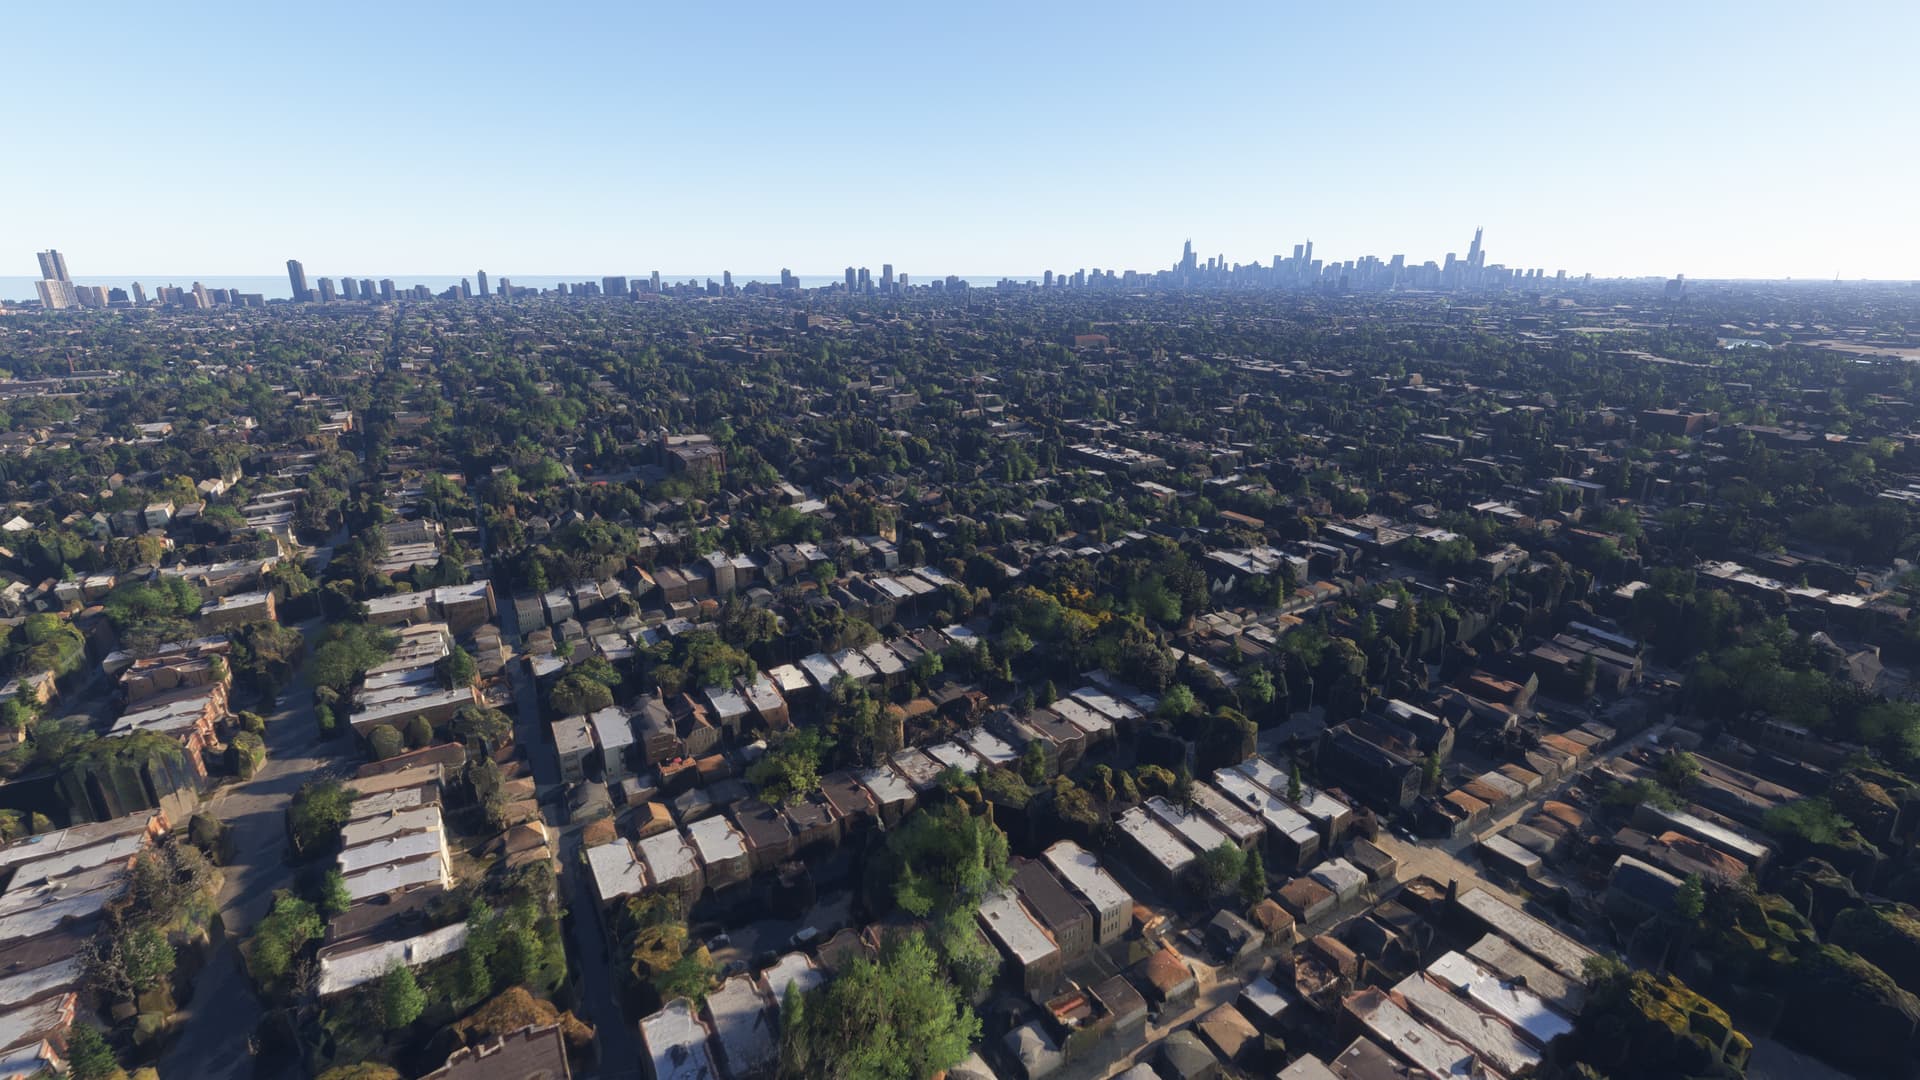
The following is a screenshot from the flight during phase (C):
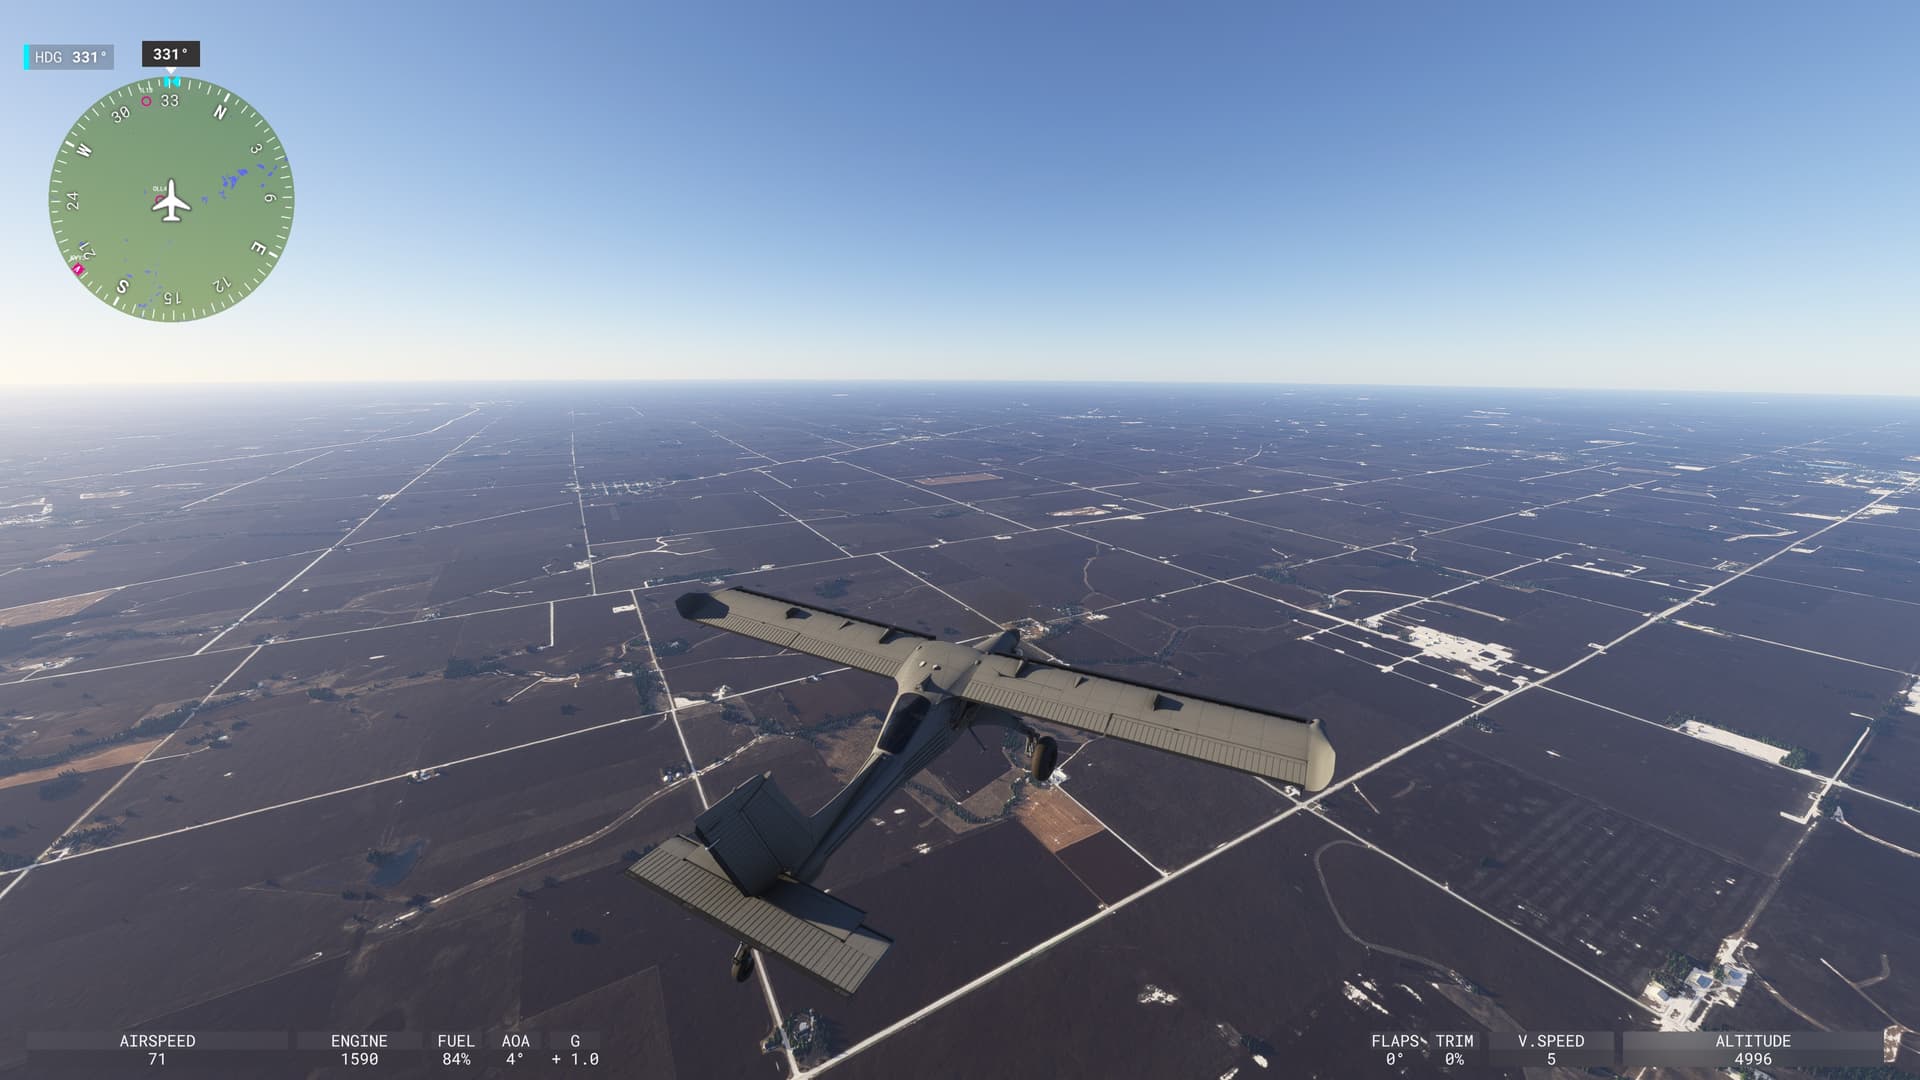
In this view I noticed an interesting pattern:
- When I rotated the external camera around the aircraft there was always a considerable increase in data downloads.
- The confusing part here is, that downloads remain high even during constant camera spinning!
- I would have expected a noticeable reduction after the first 360 spin … as I was flying pretty slow at 15,000 ft
- … but no, the high data downloads did continue, as can be seen in the
Process Monitornetwork graph below. Hmm.
- The confusing part here is, that downloads remain high even during constant camera spinning!
A screenshot from the flight during phase (E):
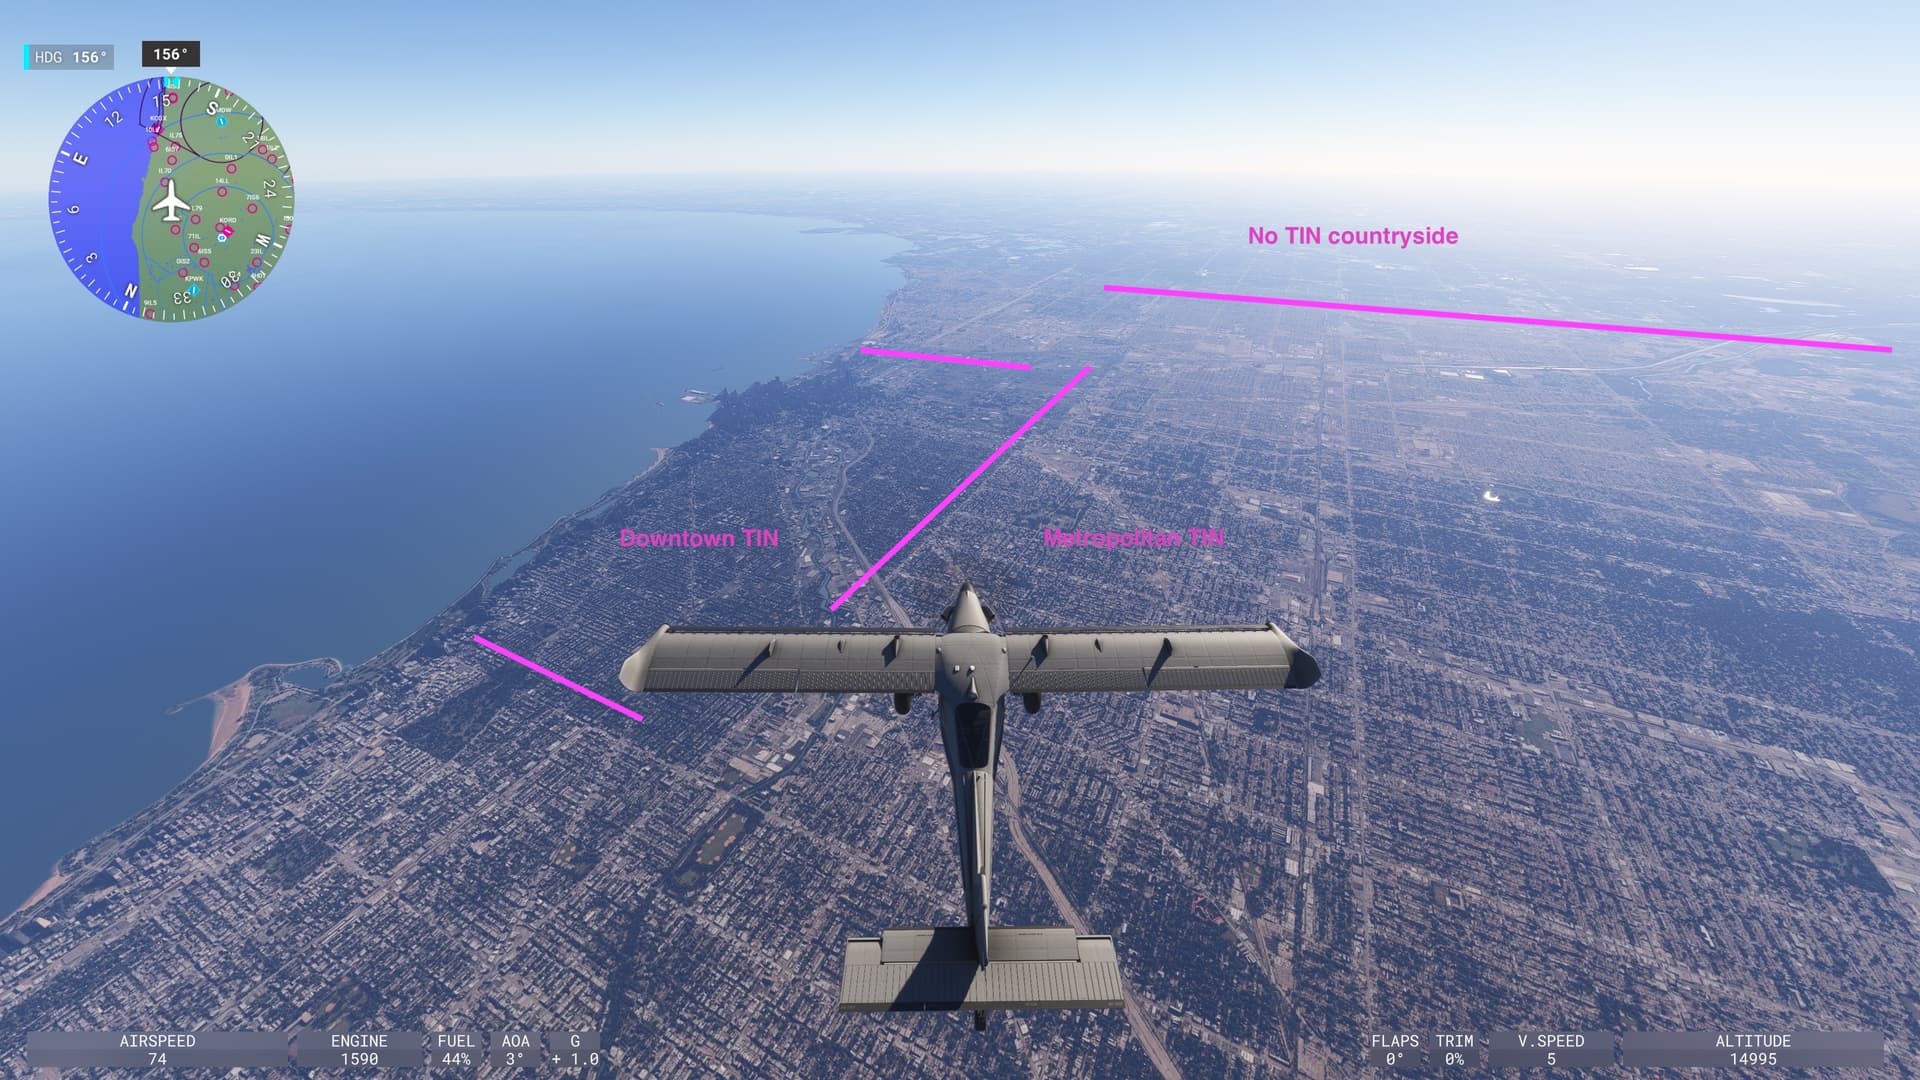
A screenshot from the flight during phase (F):
Looking at the content classification of Test P one aspect again becomes very obvious …

- There are no blue lines … nowhere … and clearly there is no nice big blue area at the beginning.
- So all the important “text” asset index segments have been wiped out of the RC.
- This will result in unnecessary downloads on the next sim launch
- … which very likely will lead to an extended launch duration.
- This will result in unnecessary downloads on the next sim launch
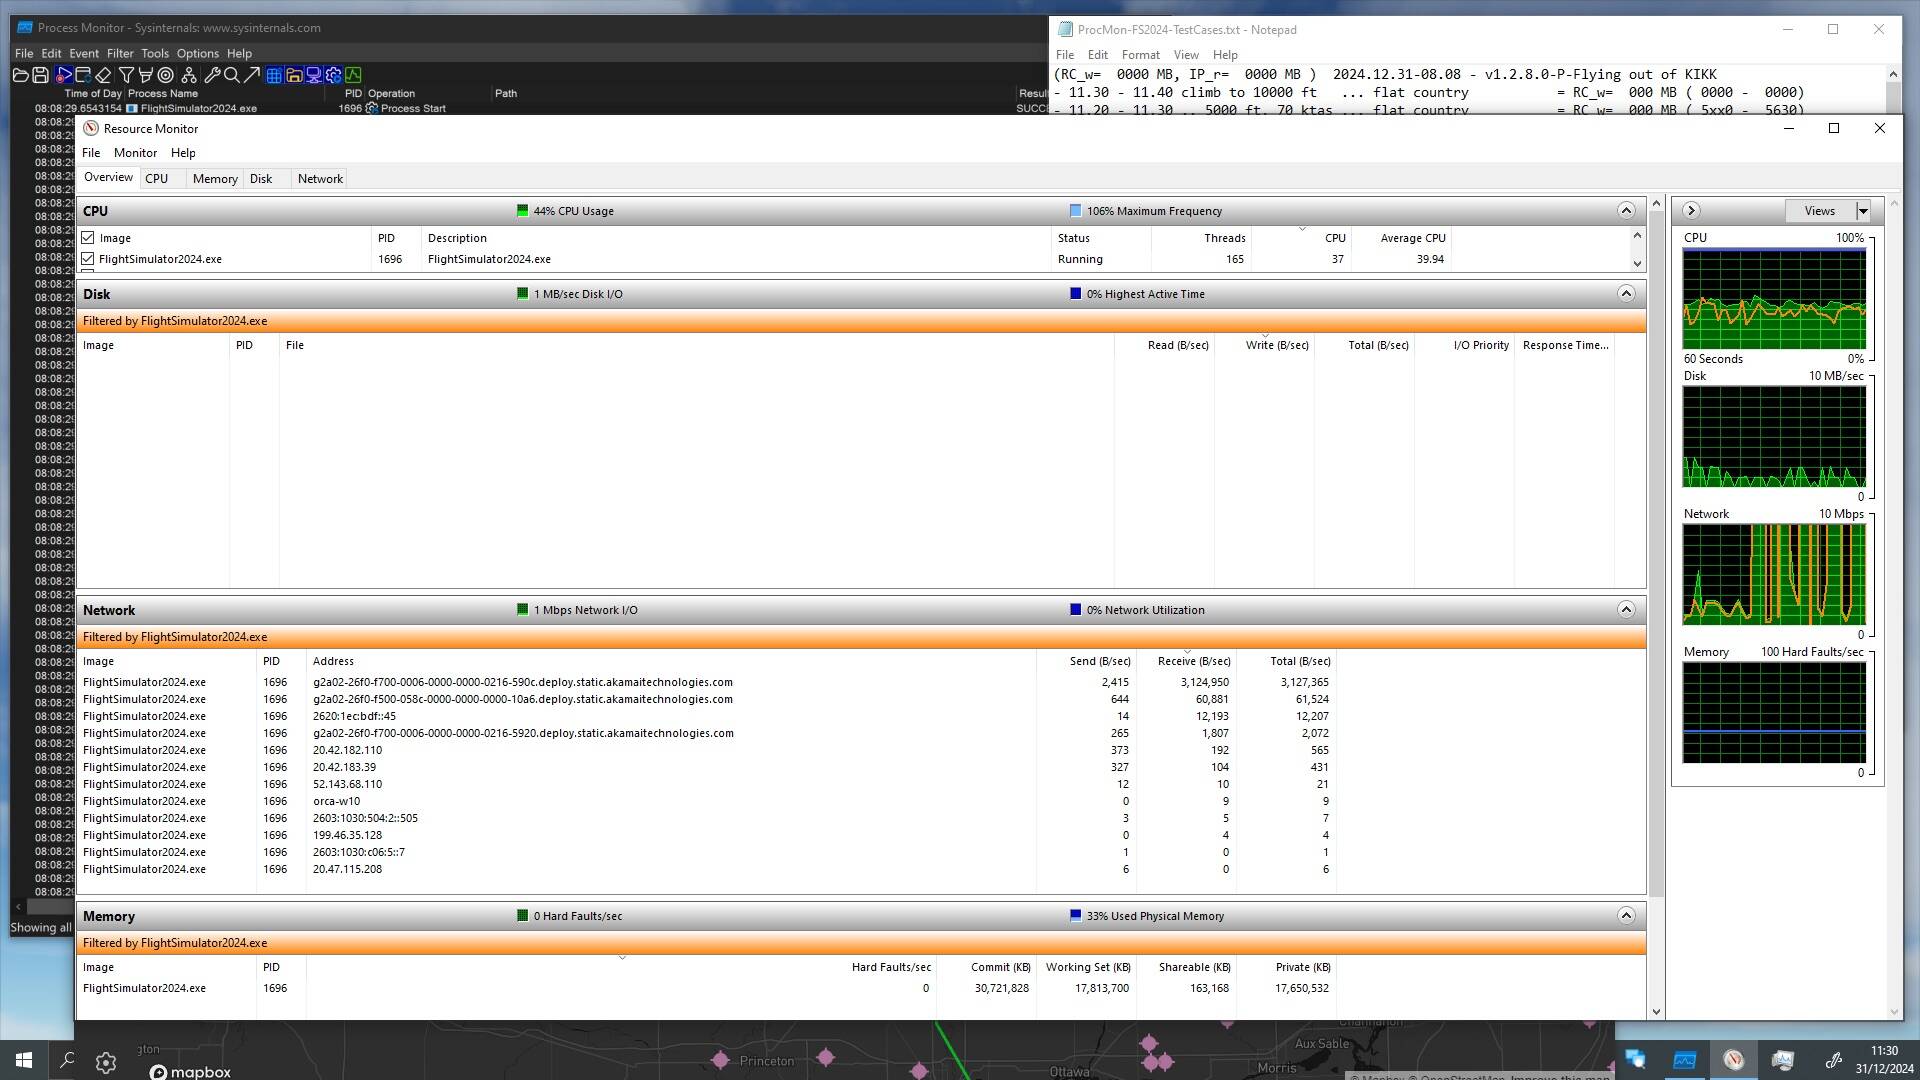
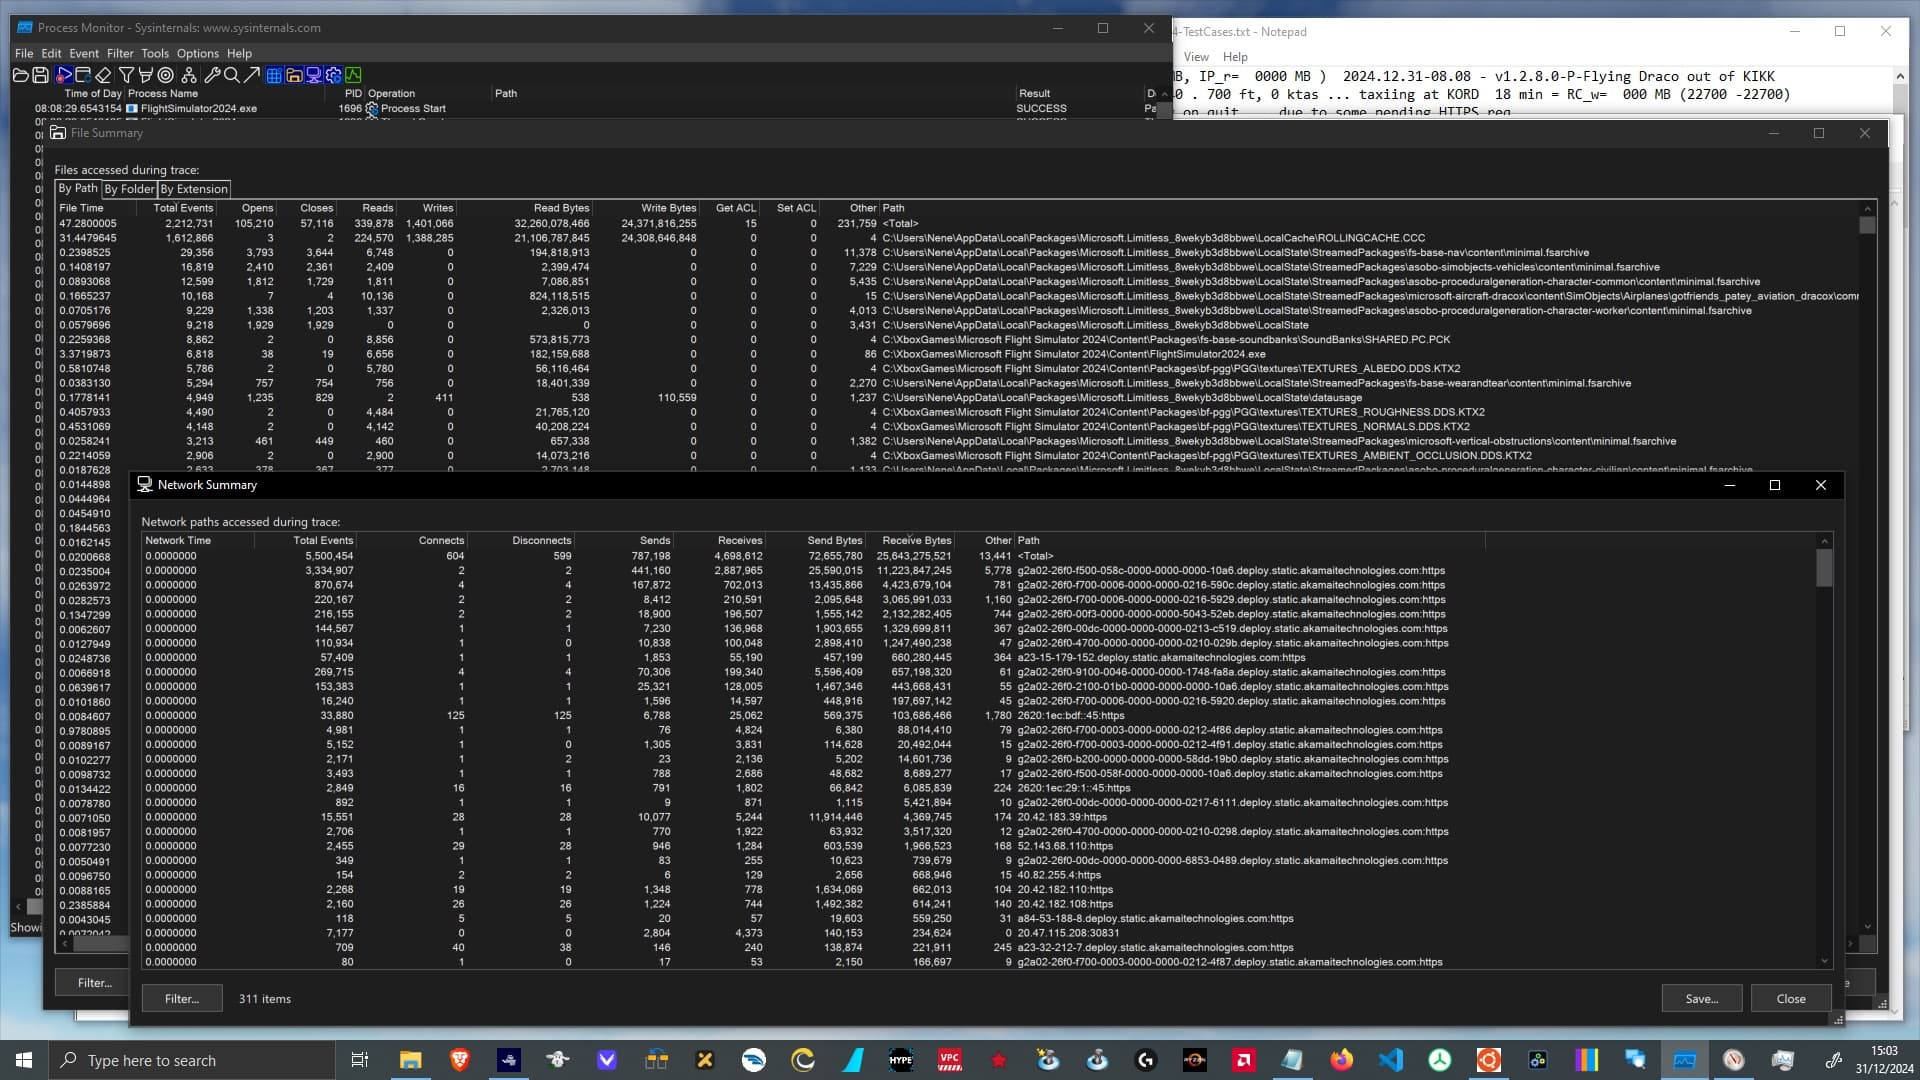
The Process Monitor recording for Test P then showed the following network and file access results:
The positive observations in Test P are:
- There are days where flying in FS2024 even at Ultra settings works without any server problems.
- The network speed recommendations from the FS2024 team seem plausible.
- But they are usually only required during extrem conditions
- … e.g. when loading into the departure airport, of when flying low over a TIN region.
- But they are usually only required during extrem conditions
The “interesting” observations are:
- There is a continous increase in downloads while spinning the external camera … as mentioned above.
- The
RollingCache.ccchas seen 21 GB read … and 24 GB write … according toProcess Monitor.- I will return to this “read < write” issue in a future dedicated analysis because it deserves more context
- … and also because I wanted to start the new year with a positive posting.
- I will return to this “read < write” issue in a future dedicated analysis because it deserves more context
To summerize my findings from this test:
- The network bandwidth recommendations from the FS2024 team seem plausible.
- With Ultra graphics settings I have seen a demand for 5 to 50 Mbps.
- Flying with 70 ktas in a TIN landscape …
- at 15,000 ft will read around 0.3 GB in 10 minutes.
- at 1,000 ft will read around 3 GB in 10 minutes.
- Loading into an airport, taxiing or approaching an airport … those are the demanding phases of a flight.
- Even without the excessive TIN landscape scanning, a normal 4 hour flight will fill a fresh
RollingCache.ccc- … and at the default 16 GB size it will get overwhelmed,
- … as long as it is governed by a Least Recently Used (LRU) cache replacement policy.
- … and at the default 16 GB size it will get overwhelmed,