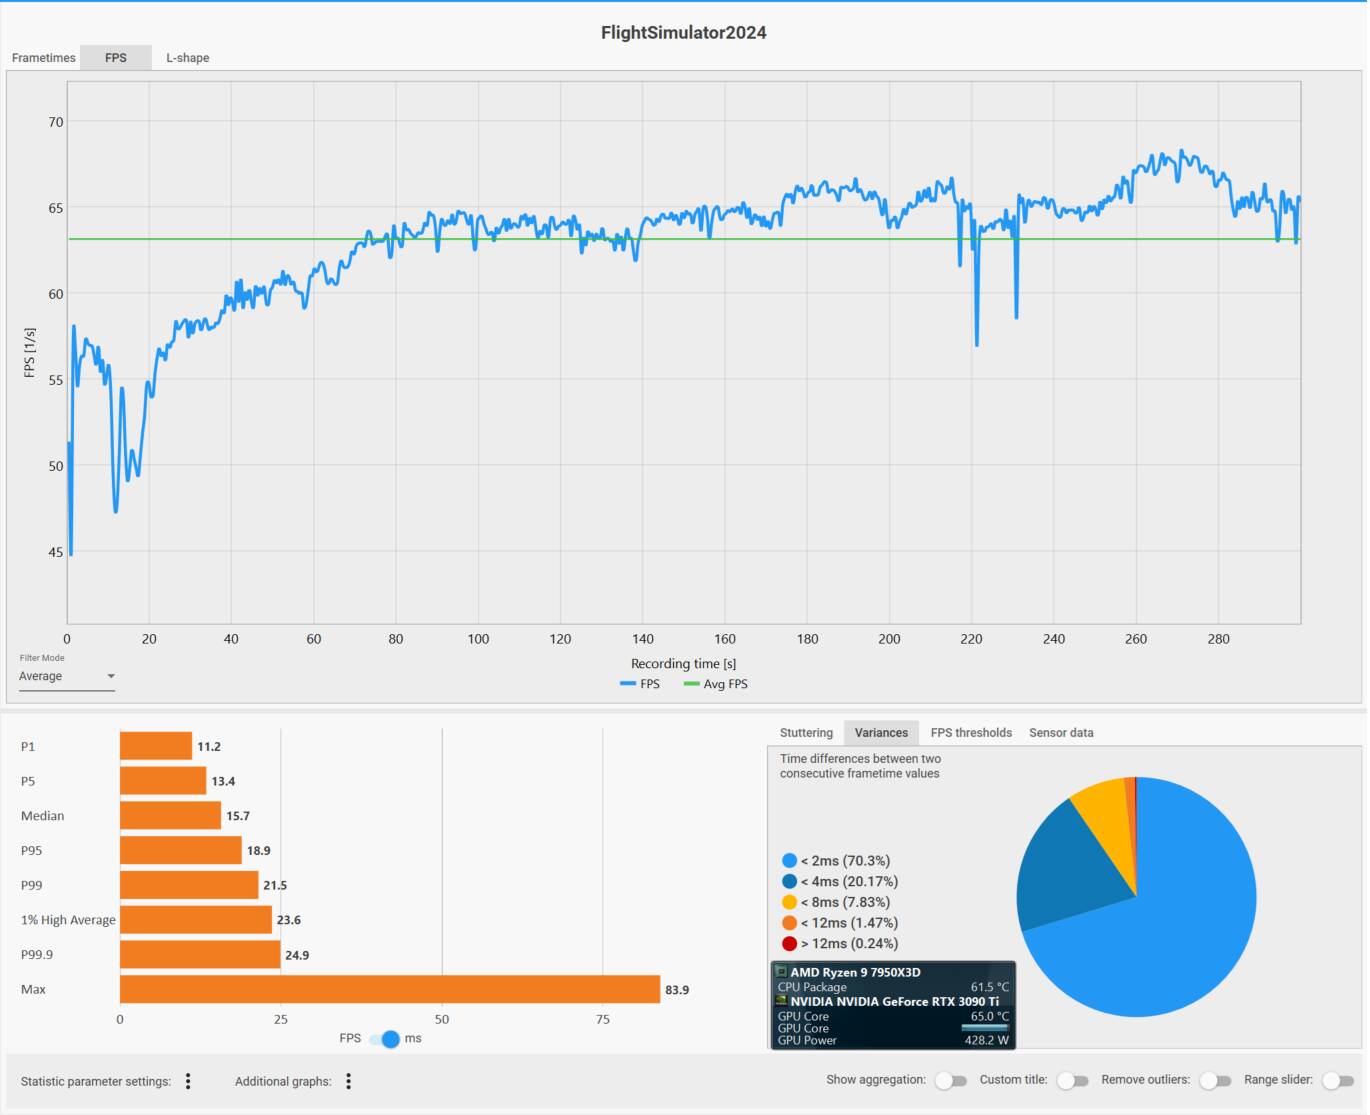
This is my attempt to measure the differences between basic settings in MSFS 2024, on performance and memory usage on my PC. I thought I’d post the simple and very informal results in case anyone is interested.
I thought it might be useful to have a benchmark to compare against future versions. This is testing SU5 v1.7.27.0.
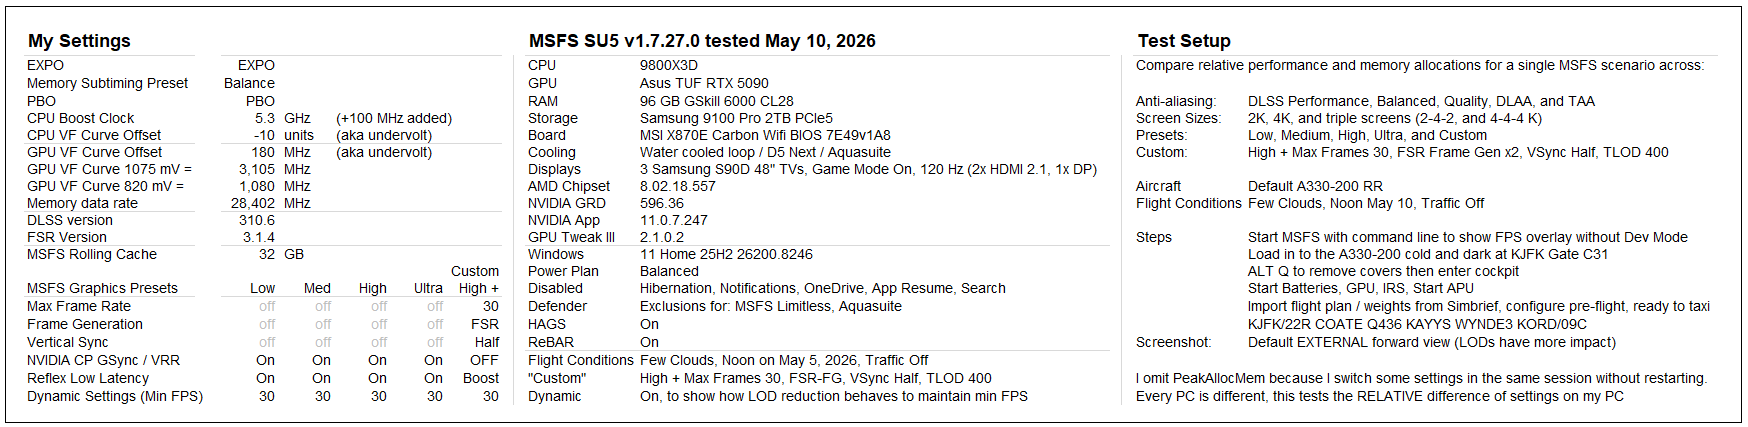
I am sure others can suggest better / different ways to test, but here’s what I came up with. I wanted to see the differences in performance between the combinations of:
- Graphics presets Low, Medium, High, Ultra
- +1 Custom setting with Max Frames 30 + Frame Gen x2 and TLOD 400
- DLSS presets Performance, Balanced, Quality, DLAA, and TAA
- 1 screen and 3 screens (2K and 4K)
That’s 100 combinations!
Every PC is different, but I believe the general difference between settings will be similar - or follow a similar pattern - on other PCs (up until you hit a bottle neck). For that reason, I didn’t use “defaults” for my BIOS, but left it in the tuned state I use - again because it is the differences between settings I want to measure.
In order to test, I needed to have a scenario that was easy to repeat, but also included proximity to a large city with photogrammetry and lots of objects to stress LODs. Here’s what I came up with:
- Launch MSFS with the command line to display the FPS overlay (without Dev Mode)
- Default A330-200
- Flight Conditions: Few Clouds, noon on May 10, 2026, No traffic
- Load in to KJFK Gate C31
- Start the batteries, IRS, APU
- Import a flight plan and weights, and do a basic preflight, so systems are active
- I selected the external view because the LODs have a greater impact on FPS
- Take a screen shot from the default external view to record data
Disclaimer - I tried to be consistent, but even the act of taking a screenshot affects the numbers (they dip slightly when you do the screen capture) so the results are very informal - but the pattern holds up if tests are repeated.

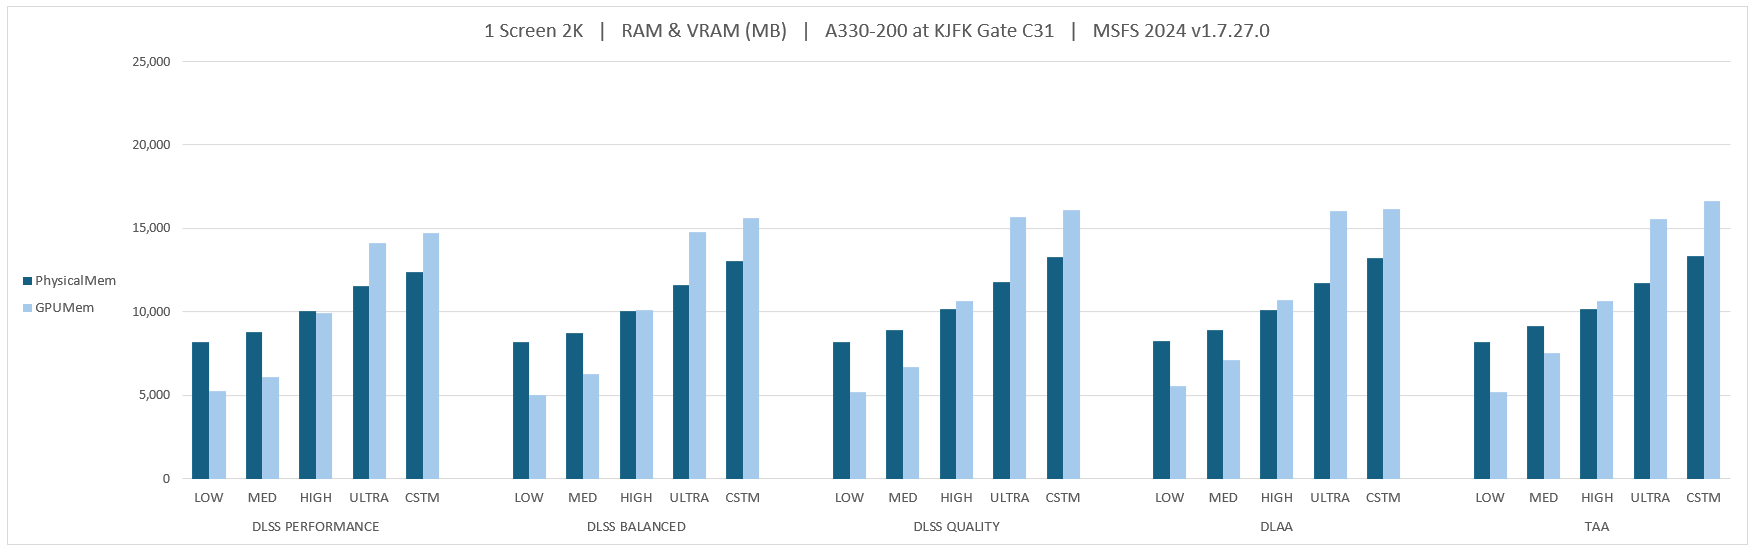


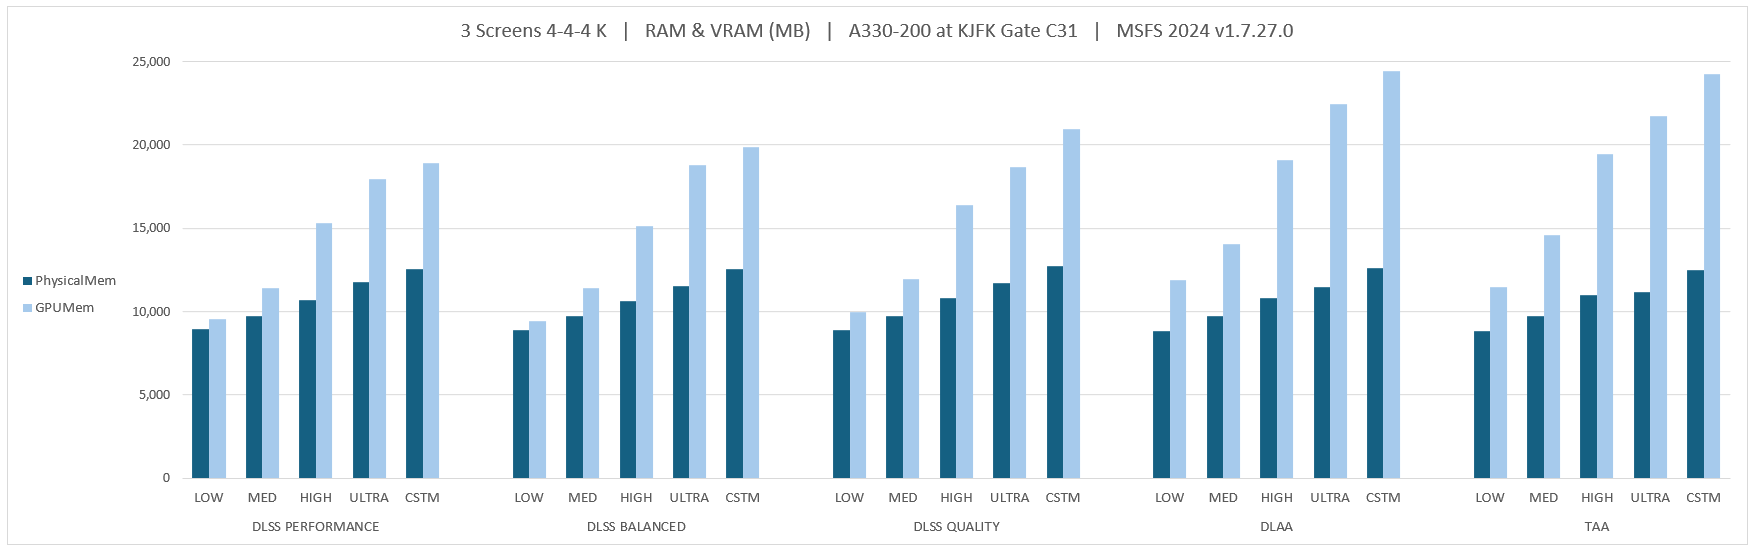
I think that AllocatedMem is the sum of PhysicalMem + GPUMem. Seb mentioned in a Dev Q&A at the launch of MSFS that memory usage would not exceed 36 GB, and from my numbers I think that is “AllocatedMem”. I wonder if it is an arbitrary cap MS / Asobo would consider lifting as time goes by and processing power allows for more resources.