For a beginner, as the producer has no documentation.
I was looking for some understanding of what I am looking at - all the different gauges and what influences each.
I also see people posting screenshots with high fp’s, but the underlying heading colour is red. What does this mean? People seem ok with it, but what makes the different colours.
Crikey, sorry about the very noob question, but people seem to get a lot of information from the fps counter screen, but it means little to me.
Thanks
2 Likes
Good question, one I cannot answer! It is a developer tool and I often wonder if us non-developers misuse it? Anyway that is another matter. Is your flight simulator working satisfactorily? And if so, why waste precious flying time with that very busy display? And if you are not satisfied with your sim’s performance, what about it would you like to address in hopes that the information may lie in the FPS counter? Just wondering. Good question though!
4 Likes
ditto to what Nikita said. For my part as long as I’m smooth/no stutter I am happy. I can’t say I pay much attn to the Dev Mode fps counter. Red or Green, if I’m smooth I’m good. The only time I really use it is when benchmarking new hardware, just for comparative purposes.
4 Likes
I was wondering if I can up or tweak some settings. I have tried experimenting with some settings but not sure what to look for on the gauges to see if it’s working ok. I have an old computer and will not be able to upgrade anytime soon. My internet is not great, I live in the bush northern Australia. So maybe I could up some settings and improve my visuals, but was looking for information on what to look at.
Main thing is to keep an eye on the last line which is your VRAM usage. If that gets out of control the rest falls apart. Make sure you are not running other apps that use VRAM like a browser and the adjustable BAR.
2 Likes
I look at the RAM and VRAM usage parts as was said.
Another thing I have used is a program called CapFramX, which is a tool that can help to dial-out stutters and see the effect of different settings. The DevMode graphs have their uses but they are not all we have at our disposal to hit total smoothness.
2 Likes
The free app CapFrameX is the #1 tool I use to benchmark the sim.
You fly for 5 minutes, and the app collects all kinds of useful data.
Then you can tweak a setting (one thing at a time please!) repeat the flight (as closely as possible) and judge the results.
Here’s an example of just some of the data it collects:
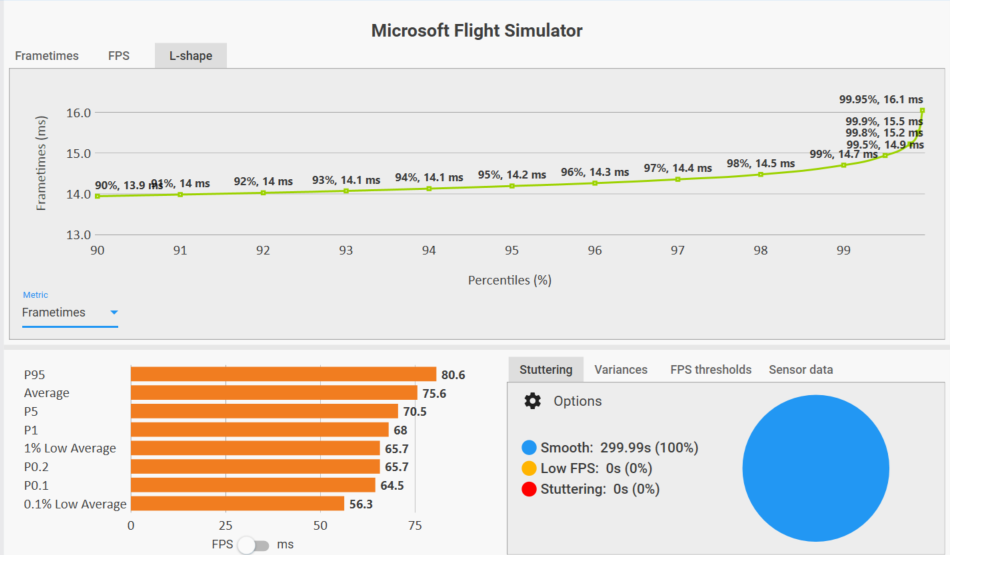
As others have said, smooth stutter-free is key. The #1 thing that will cripple you is excessive VRAM usage.
2 Likes
I thought maybe you would stop by to say hello. I am in the same boat as the OP, who I think is asking what does all the information on the chart, or available in Devmode, mean? Also, how do we see what our VRAM usage is? Thanks. --Redeye
DevMode’s displayed vram usage is on the right-hand side near the bottom. It is fairly small text and the font isn’t the greatest.
1 Like
Something I learned during flight training may be relevant here. Before looking at an instrument, have an idea what one is looking for. In other words, bring some intention to the instrument scan. The FPS display packs a lot of data, so even if one is only looking for VRAM metrics, why is one looking for them? A hypothesis to test? A setting recently changed and one wants to see if there is an impact? Good idea to have a clear problem statement in mind before looking at any data, sim data or flight data.
1 Like
Genuinely curious…and I am chucklingly light-hearted and non-serious as I post this…why was your post about CapFrameX marked as the “solution” to this thread, when in fact it was my earlier post which first mentioned CapFrameX? And even beyond that, the OP was asking about the DevMode interface and not external tools? Shouldn’t the real solution to the thread involve a description of the DevMode info screen?
2 Likes
No Sorry, that was me. I figured that with two mentions of the same product, it seemed like a likely solution, so I ticked the box. No discourtesy intended. It just seemed like the best solution to understanding the in game box, or more like by-passing it. I thank you also for your suggestion, with respect.
1 Like
You’re right on all counts!
Back on topic: There are some things in the dev mode debug display that are mysterious, for sure.
The most useful things to me are the latency numbers (Main Thread and GPU) which tell you you’re achieving the goal of balancing CPU and GPU usage. I want the numbers (like 20ms) to match fairly closely, and I want to see the “Limited By” flashing back and forth between the two.
The other thing I might look at is the 'screen and ‘render’ resolutions, to verify my DLSS settings are correct. The other stuff (other than the obvious - FPS for examle) is kind of unknown to me. Maybe it’s useful to developers.
1 Like
I am hoping you can post picture examples of what you are describing when you have time please, with perhaps more in depth pointers to show what you mean. I was looking at the example you posted above but can’t match your 2 posts. Thanks if you can.
The data inside the red boxes:
- ‘Main Thread’ essentially shows how long it takes the CPU to render each frame (latency). It’s not quite that simple, but it’s an easy way to think about it.
- ‘GPU’ is the same, but for the GPU.
Notice that with the ‘Low’ preset my GPU latency is much lower than my Main Thread latency. That tells me I can increase the graphics settings most closely tied to the GPU. FPS is lowest with the ‘Ultra’ preset (as expected) but the latencies are still pretty balanced. That tells me my system is capable of using that preset (depending on the aircraft, airport, etc.)
Note the colors of the latency numbers. Green is great - I have some headroom. Yellow is fine, but tells me the system is working hard. Also notice there are no red spikes in the latency graphs. Spikes are stutters. Stutters are bad, and tell me my system is being overworked, and is unable to keep up with the demands. Or that system is having problems with the flow of data - maybe RAM timings, or some Windows tasks taking up CPU cycles. Unfotunately, some people blame the sim code itself for stutters, when it’s usually a problem with their computer. They’re either asking it to do too much, or they need to work on optimizing the setup.
VRAM is critical. I have 24GB (the 2nd number) so I’m in no danger of exceeding it - ever.
If you only have 8GB, and it’s using more than that, you have a problem.
None of the other numbers mean much to me.
Except the ‘Screen’ and ‘Render’ resolutions. ‘Screen’ tells me I have a 4K monitor and the sim is set to 100% of that resolution. ‘Render’ tells me that DLSS is essentially rendering the image at 2K and upscaling it to 4K to match the monitor resolution. There’s a slight degradation of the image due to the scaling, but it’s practically unnoticeable (thanks to DLSS 4 - a must!) and gives me a good performance boost - 2K is less data, thus higher FPS than 4K.
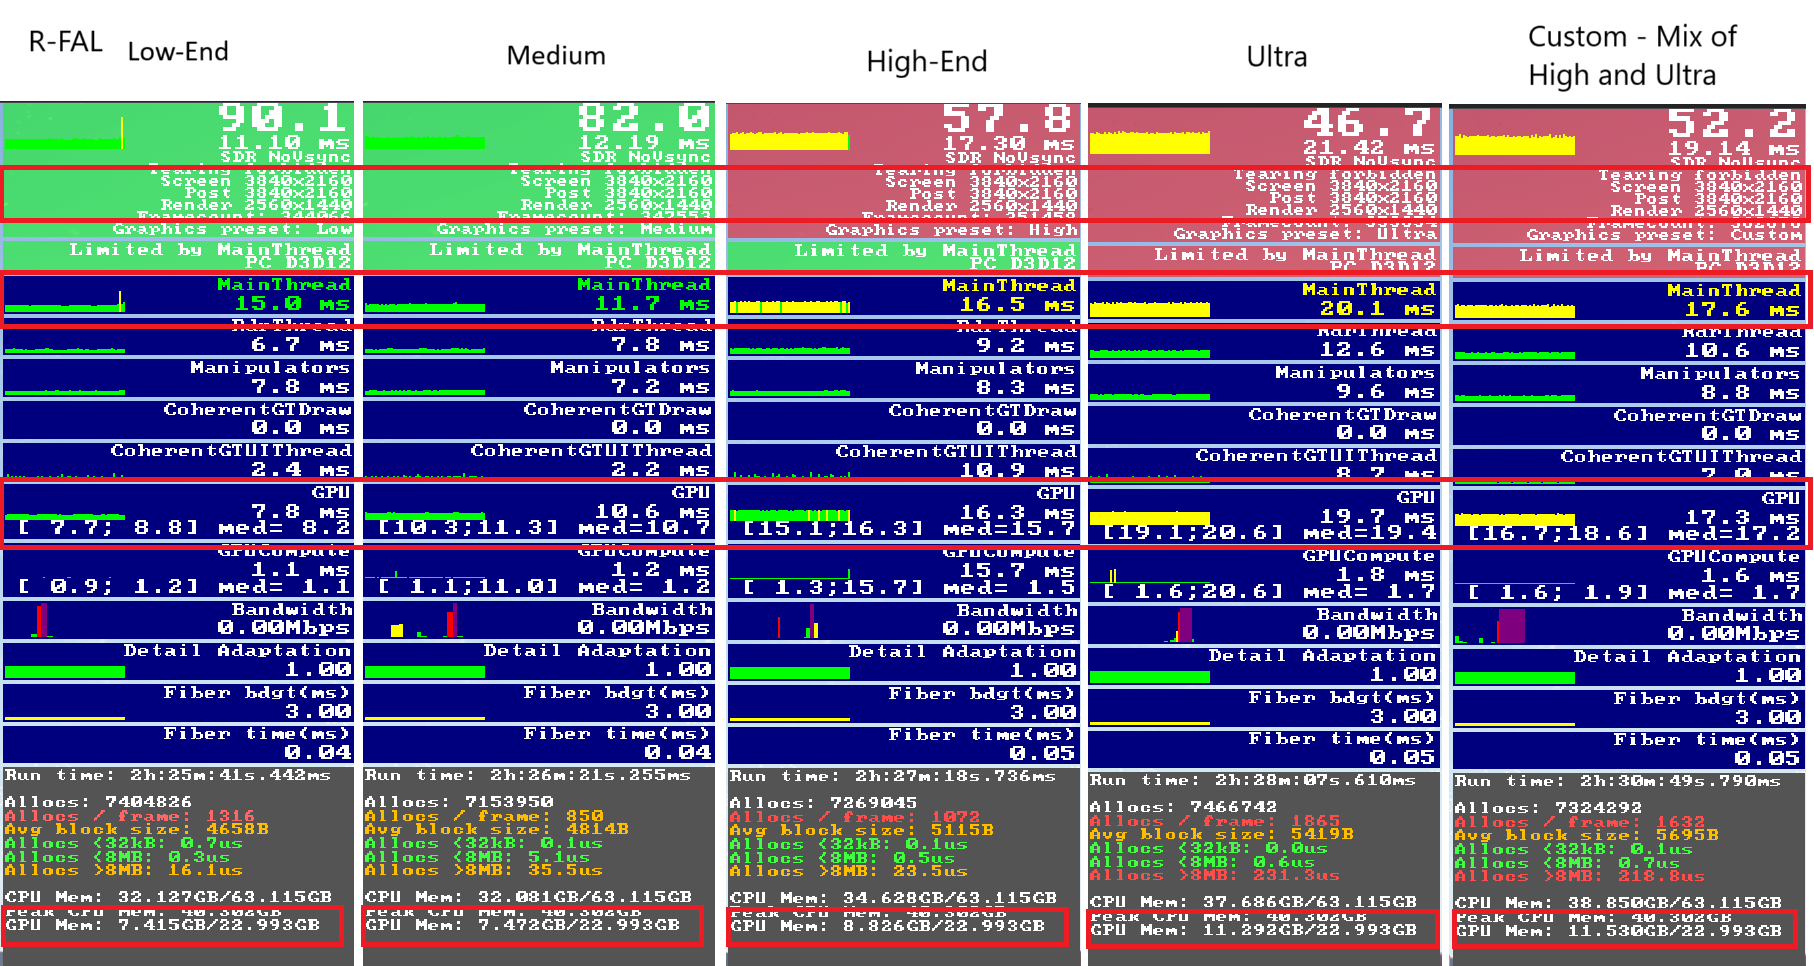
Judging by those results, my system is optimized with the ‘Medium’ preset. But I have plenty of room to use a custom mix of graphics settings, so I run many things at ‘High’ and ‘Ultra’ and still maintain sufficient FPS to be stutter-free.
It’s all a balancing act.
3 Likes
Fab, thanks so much, I am going to examine it inch by inch now ![]()
![]()
![]()
1 Like
I see what you are talking about now. Fab, it gives me a lot of understanding when looking at all of the posts about/in SU2.
You mention, as per your quote above, the graphics setting MOST closely tied with the GPU - what is the name of this and would it be found in the settings section on the mainpage settings section?
Another question if you don’t mind - where would I find out what VRAM my computer has?
Sorry if this is bothersome but I am a computer ignoramus!
Your GPU has the VRAM. You can see it listed at the bottom of the picture inside the red box.
Look at my ‘Ultra’ preset. You’ll see this:
GPU Mem: 11.262 GB / 22.993GB
That means that with those settings the system is using about 12GB of the available 24GB on my GPU. Mine is listed with 24GB VRAM, so you might ask, “Why does it only show 22.993GB?” It’s just the way the number is calculated.
As for which graphics settings affect the CPU more than the GPU, and vice versa… I’m still trying to figure that out myself. Best thing is to change one thing at a time and see what happens.
I’ve posted this several times before, and I think it’s a decent starting point to understanding how to optimize your system. There is no one best method - you have to figure it out through experimentation.
Thanks very much again for your input, I appreciate it. I will work my way through this slowly to better understand my equipment.
No problem, I was really just curious as to how this forum worked, in the sense that I didn’t know who could mark a thread as “Solution” or under what conditions…you have answered that question thanks. As for the topic-at-hand, the DevMode screen, I think Begotten has really gone the extra mile on it, above.
2 Likes