OpenXR Toolkit (upscaling, world scale, hand tracking...) - Release thread

I don’t think I’m CPU bound. I think the performance metrics are wrong. As an additional check of that, I changed my TLOD value from 230 (which is my normal setting) down to 100. My FPS was being measured at 45 (see image 1) before and after the TLOD change.

I mentioned I never used either of the features before today so I can’t say if they worked in prior versions.

Just tested and working fine for me with DX12. I’m not going to put my AMD card in, but it shouldn’t make a difference anyway. One suggestion to investigate is to try from the main menu, where the FFR circles will be very obvious on your 2D mirror screen:

You can also enable “Expert settings” from the “Menu” tab then toggle the “Developer” overlay in OpenXR Toolkit.

Take a look at these 2 values at the bottom: what do they read?

Can you provide other measurements then?

Like use the WMR overlay:

Your frame rate is 45 FPS, with app CPU is 22ms. So yeah, you’re 99% likely CPU bound.

That’s shows the FFR circles clearly so thanks for clearing that up.

VRS RTV: 49
VRSw: 2840

You’re right. I should have done the math on that. They’re clearly inverses of each other.

So it seems everything is working and that I’m CPU bound so I’ll play with this more to get it working better. It’s funny that my GPU utilization is 99% while the CPU max thread is only around 55%. Thanks for all your help.

Can you answer why the appGPU is showing 0? Should it be doing that?

These mean: all good!

Measuring GPU times rely on the ability to place a marker (which is a CPU operation) at the beginning and at the end of the GPU work. Since this operation is done from the CPU, well if your are CPU-bound, when you end up placing the marker for “end of GPU work”, it’s too late, the GPU work already completed. This isn’t an issue when done in the game, because the game knows better when to set the marker. But in OpenXR Toolkit, we are at the mercy of the “end of CPU work” timing to set this marker.

Instead of displaying an erroneous app GPU value (which would likely be equal to the app CPU value), we set it to 0 to make it obvious that “we don’t have a good measurement to present”.

Now I understand everything. Thanks. I appreciate you taking the time help everyone. :+1:

And test I did! I loaded up a flight for a few hours in Las Vegas tonight, (which had bad weather, rain and clouds) with FlyTampa Vegas Scenery. It’s always hard on my system, usually worse than even Tokyo, so it was a good testing round.

System Specs:
Asus ROG Dark Hero Viii Motherboard
AMD Ryzen 5950x SMT off, PBO@5Ghz
32GB PC3600 Mem XMP Enabled
2TB Samsung 9800 PRO NVMe SSD
Gigabyte Gaming OC 4090
HP Reverb G2
Thrustmaster HOTAS and Pedals
ButtKicker Gaming Plus

For settings:
ULTRA settings, everything maxed, 350GB rolling cache, Real-time air traffic
OpenXR 100% (3176x3104), TAA 100, TLOD 150, OLOD 150
OpenXR Toolkit Motion Reprojection Enabled (UNLOCKED)
Fixed Foveated Rendering Quality (Wide) Preset
FSR Upscaler Disabled
OpenXR Toolkit AMD FidelityFX Contrast Adaptive Sharpening (CAS) 100%
Turbo Mode Disabled
HAM Masking Disabled

Latency Statistics
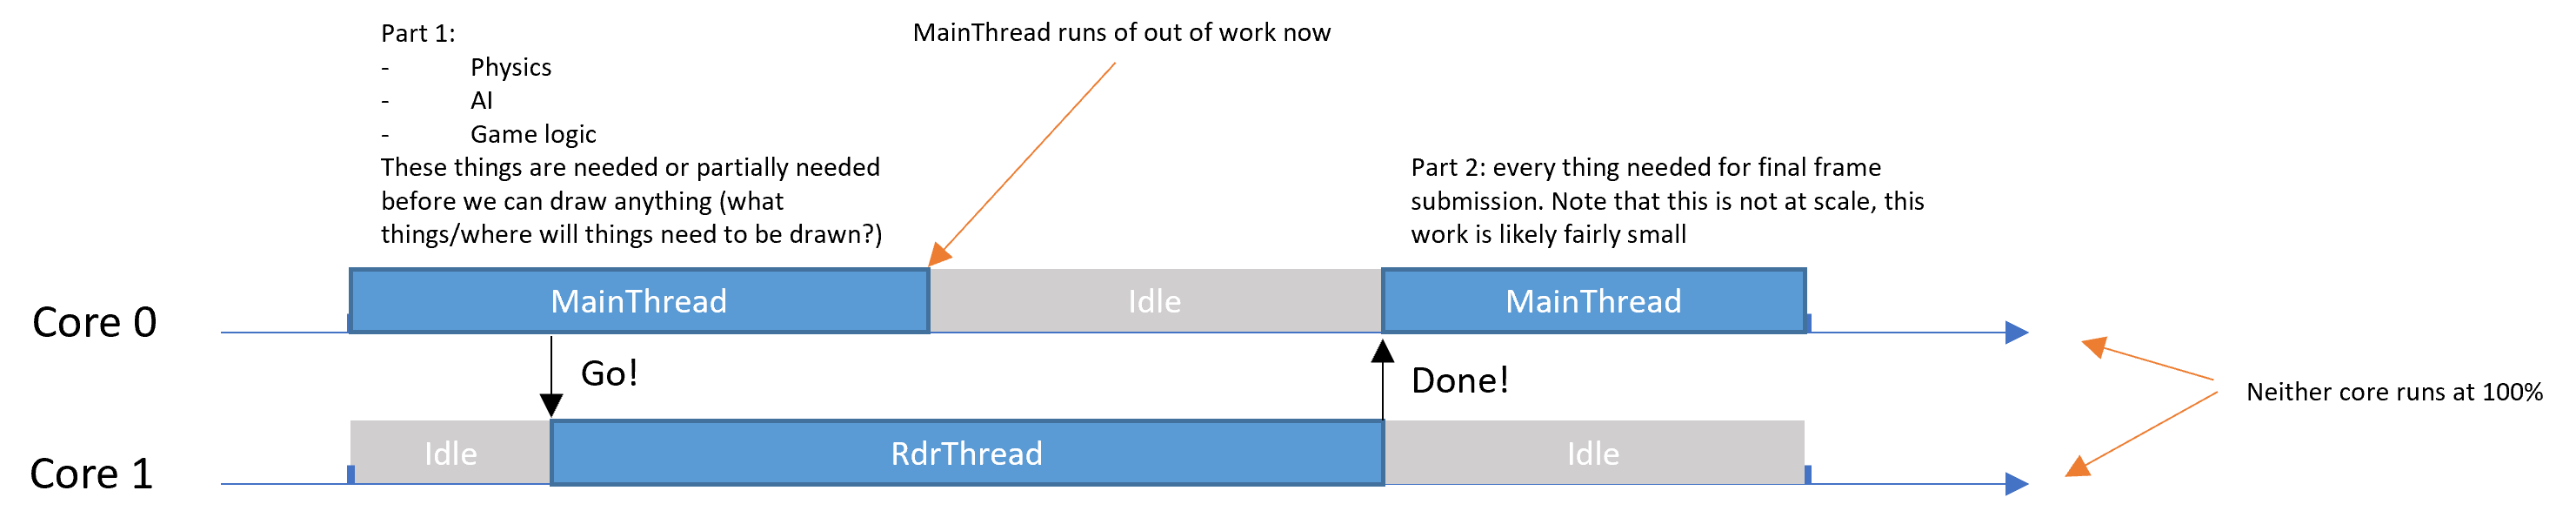
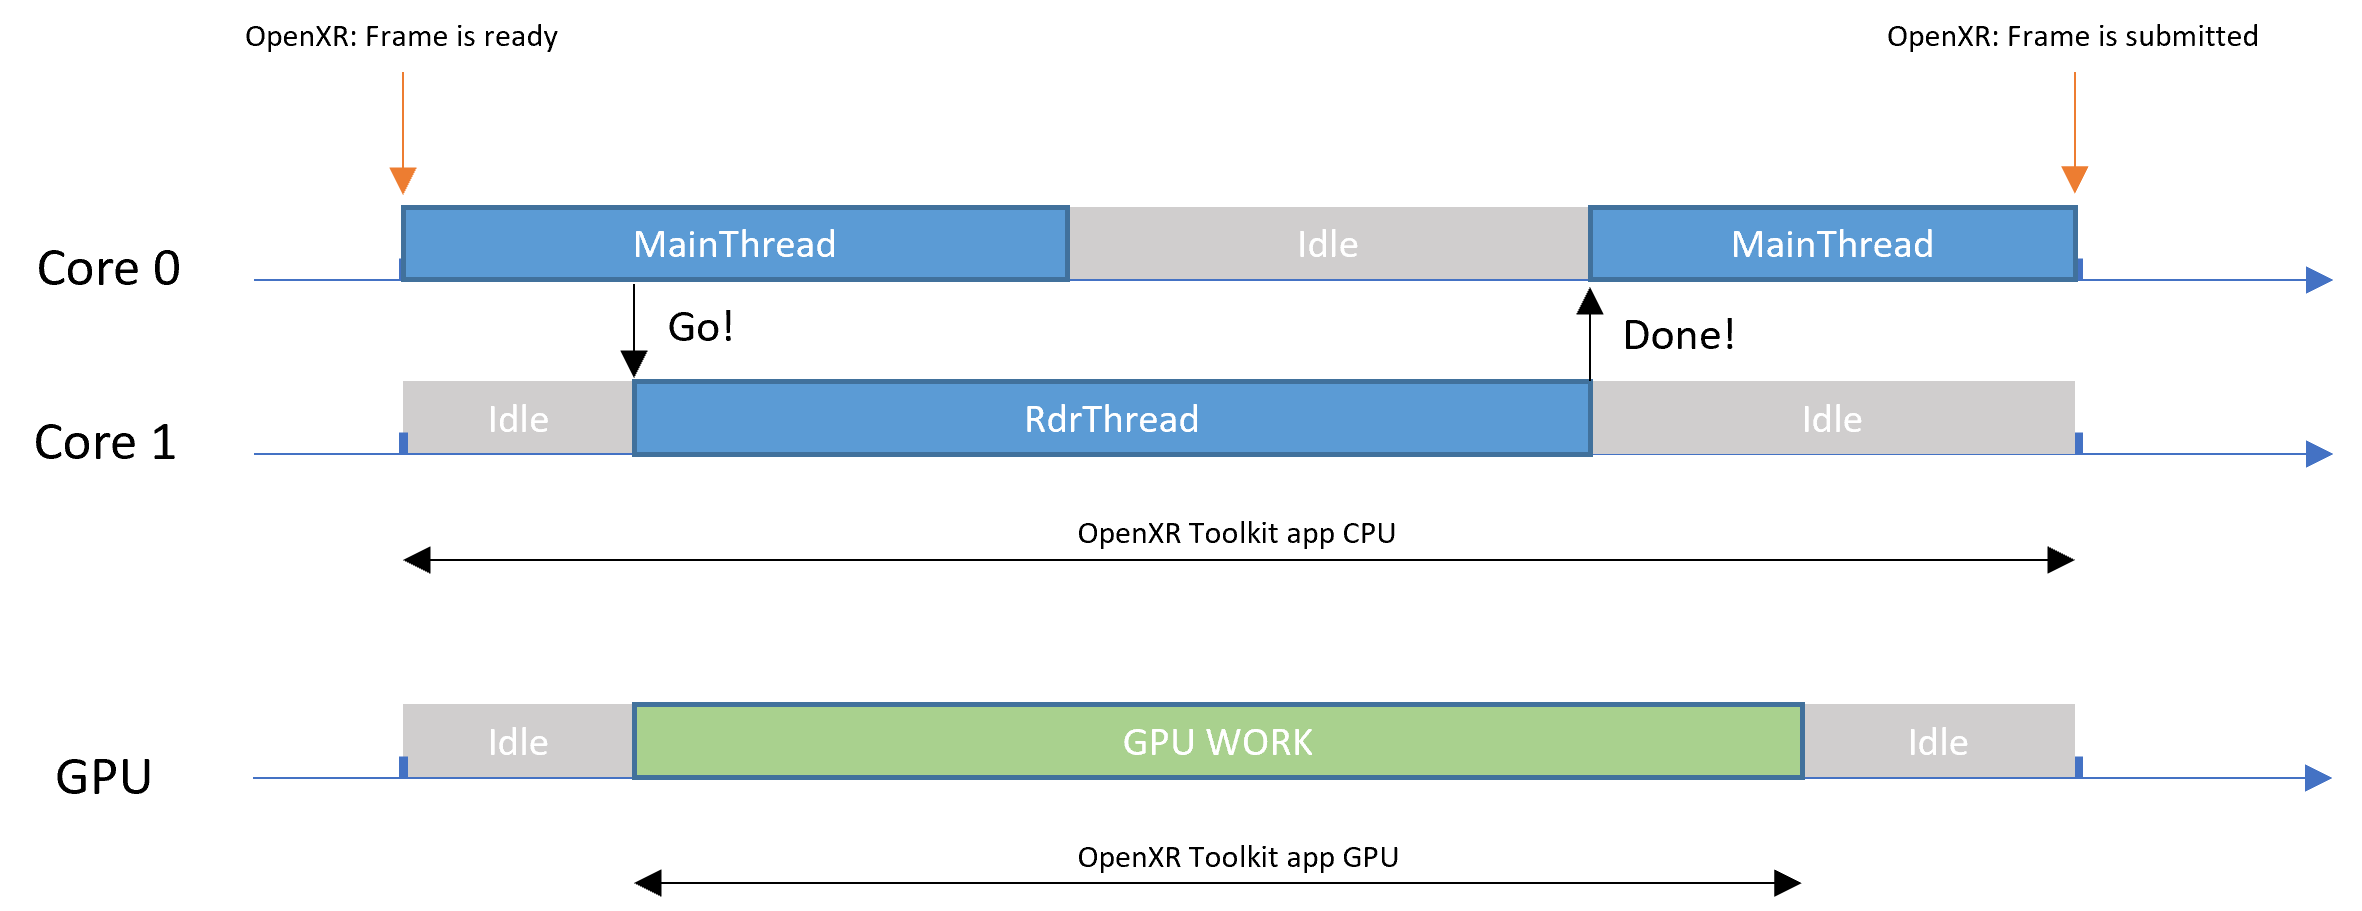
This is a very welcome change! Now everything is read in milliseconds (ms) and the changes you made to measuring latency was immediately showing CPU bottlenecks that were never shown before. This allowed me to fine tune a lot easier than ever before. The CPU bottleneck was mainthread, rdr thread is never an issue.. so I went in and dropped TLOD from 200 to 150 and voila! appCPU and appGPU are very often within 1ms of each other.

What I found interesting was that when disabling MR, my appGPU and appGPU are perma locked together. Nearly identical numbers and shows CPU Bound within ~.6 ms. Maybe you can explain this a little better because I get a bigger variation between these two numbers when in MR.

It’s also interesting to be GPU bound or balanced between the CPU and GPU, to suddenly see “CPU BOUND” when flying over airports. It sticks out like a sore thumb, and just further proves how CPU intensive MSFS is, particularly around airports. And you can watch it go CPU bound for a few seconds (depending on the airport) doing it’s thing, loading in objects, planes, AI, traffic… and then it’s done. Back to GPU bound. Anyway, I found it kind of liberating to be able to see this now.

High Rate Statistics
This is actually a pretty cool feature, because I am able to spot CPU bottlenecks that last milliseconds.. and it’s surprising how often this occurs. These little blips correspond with what these forums always call random “stutters” with no explanation for what’s causing it. The CPU is definitely doing -something- but I don’t know what it is.

It’s also important to point out here, that running high rate statistics APPEARED to have more of a performance overhead. While monitoring appCPU and appGPU, and switching this on and off seems to have an impact, but I can’t say for sure.. @mbucchia you can chime in on this one.

AMD FidelityFX Contrast Adaptive Sharpening (CAS) in OpenXR Toolkit
I disabled the FSR upscaler and went with CAS sharpening only in OpenXR Toolkit. It’s important to note here, I set the in-game MSFS settings CAS slider to 0. Set CAS in OXRTK to 100% and compared visuals. It’s slightly less sharp than FSR sharpening (if barely) but noticed that it works extremely well and doesn’t create artifacting/wobbling/shimmers like I see with the built-in MSFS CAS slider. Also, with the upscaler disabled (because i’m running native and not upscaling anything) it definitely runs slightly smoother in MR… It’s so subtle it isn’t something you would see in the framerate or statistics. It’s just.. smoother ever so slightly.

I almost wished I could set the CAS sharpening more than 100% as it isn’t as aggressive in sharpening the scene quite like FSR is. I don’t know if this is something you can do, but it’s worth thinking about.

Turbo Mode
Oh boy, this is a hot mess. Haha! Kind of. If I leave “MR on” which you explicitly state not to do, (but I did it anyway cuz, fun!) it appears OXRTK kills the MR lock anyway… but I get 500ms pauses every second and it’s really weird. Hard to explain. What I found is, it actually works better if you intentionally set OpenXR MR to Disabled and OXRTK to Disabled, and then try out Turbo Mode. This time, I actually got “smooth” results for as smooth as this thing can be… it kind of works and you can tell the system is high strung. It does work, but it’s not something I will ever use. In fact, it crashed my sim and that was enough for me. lol

Frame Throttling
When I turned off MR I decided to try limiting frames to 45FPS just to see how it performed. Seemed fine. Nothing to really add here.

Conclusion
So far with a few hours of testing tonight, I am extremely pleased with the new features. The ability to see CPU bottlenecks accurately now, allowed me to tweak my settings (particularly TLOD) and find that “sweet spot” that I could only kind of guesstimate before. Using CAS not only looks good, but it doesn’t create artifacts or shimmering like the built-in MSFS CAS slider does. I have no idea why this is… you would think they are the same thing. But something with the built-in MSFS CAS setting does NOT play nicely with Motion Reprojection in OpenXR. I have tested this over and over again and I have to leave it at 0. BUT it’s great cranking up the CAS in OpenXR Toolkit, disabling the upscaler (because I don’t need it) and I have very acceptable performance.

Stutters still exist sadly. This just happens in densely populated areas or the dreaded airports. Faster CPU’s will hopefully alleviate this in the future. I may swap out my 5950x for a 5800x3D and compare. This will be much easier to test, now that the statistics for appCPU frame time measurements is “fixed”.

I’m a very happy camper with this release, and I think it’s going to help a lot of people fine tune their setups. Thanks Matt for another great version. Let me know if you would like me to test something out!

9 Likes

Effectively, you tested!

Great report, thanks for the feedback :slight_smile:

1 Like

Hi, many thanks for creating this amazing tool.

Are there plans to support Foveated Rendering on Quest Pro ?

@iBeej - great write up.
@mbucchia - great update.

I gave the new version a quick test yesterday and was able to cause multiple CTD and freezes/crashes during the loading of flights because i messed with all the new settings at once. (Turbo mode, MR, CAS, I even threw Bijans Seasons back in the mix and flew the JP Logistics 152)

Went back to safe mode and reset my settings to default in the Toolkit, took out most of the mods and flew the default 152, but only breifly as It was getting late but no more crashes occurred.

I read through your page to start familiarizing myself with the bug report process but it I’m pretty confident my crashes were all self induced.

With all that said I’m sticking with the new version, I like the CAS and the improved overlay. I will have to set msfs fx shapening to 0 and see how it looks.

I bounce between TAA and DLSS depending on if I’m flying glass or not. The myriad of options to test can quickly send one chasing their tail.

DLSS - Quality.
OXR 100
CAS 100% sharpening.
MR unlocked (always aim for 30fps)
FFR off

G2 - 3080 - i5 9600k

1 Like

It needs oculus to implement the standard eye-tracking extension into their OpenXR runtime, rather than their own proprietary one. If they do that, it should work without me needing to do anything.

Haha! Yeah, don’t do that.
If I had to make a guess, it was Turbo mode that caused your crashes. It’s an experimental feature and needs to be treated as such. And as long as we (the community) don’t abuse it and send endless bug reports to @mbucchia because this thing is on… he will hopefully keep releasing fun toys to play with and see what sticks.

I find it hilarious actually.. even Asobo has said DX12 is experimental and will almost assuredly cause problems for a variety of people. We enable it anyway. Same thing with Turbo Mode. But people see big RED button that says “Don’t Press” and we can’t help ourselves. :smile:

Anyway, CAS is great.. I just wished I could sharpen the scenery a little bit more with the Toolkit version. There’s this tricky balance between, anti-aliasing a scene (which has the the potential side effect of over blurring) and sharpening, which has the potential side effect of re-introducing aliasing (or grain noise). I was thinking about this last night when I went to sleep…

Render a Scene->upscale->sharp but aliased->anti-alias the scene but blurs->post process to sharpen… and it almost seems counter productive. I mean, it kind of is.. but with the right mix, you can achieve a really beautiful render.

If you are using DX12, this might be the cause of your CTD. There is a bug in OpenXR Toolkit with DX12 that is triggered after a few switches between TAA/DLSS. Workaround is to leave VR, make the change, re-enter VR.

Strictly DX11 here but thanks for the tip.

@iBeej Is the goal here to get AppCPU and AppGPU as close as possible even when using MR?

Last night i noticed roughly my CPU at 22ms and GPU 32ms. (in a 152 in a rural area) I have come to the conclusion its better to keep a little breathing room for you CPU so when the CPU spikes appear, as you mentioned when going over an airport for example, its a little less jarring.

I keep my TLOD at 100 as i am already main thread limited in almost all scenarios.

Technically speaking, ideally, you would want to these numbers to be as close as possible, as this would indicate your CPU and GPU are performing the work load 1-1 at the same rate. But the simulator is extremely dynamic, depending on geometry, weather, AI, etc which makes this technically impossible to achieve 100% of the time.

This is the way. A heavy CPU load or a lot of “CPU bound” spikes, has a pretty severe impact on your GPU performance. And this is especially true for all of us in VR because we are already trying to squeeze out as many frames as we can possibly muster while retaining visual fidelity while also not vomiting. Remember, we still have to contend with the 1% GPU lows, which is it’s own thing.

I like to give myself that buffer as well. I tune in areas like Tokyo, Vegas (with FlyTampa Scenery) and while sitting at busy airports. And in these areas, I have very close appGPU and appCPU, but while flying over BFE Kansas and corn fields, my appCPU could be 4ms and appGPU 14ms, or if there is a thunderstorm, it could be a 4ms/26ms ratio. But at least I know I have mitigated the CPU bottlenecks as much as possible, while also taking special care not to underutilize the GPU either. It’s a tricky balance!

I like to aim for 30FPS with MR (Unlocked), so I could potentially lock 45 FPS.. (which happens at times in the middle of nowhere or at cruise altitude) and it’s great. But 30FPS a majority of the time is good, because you have a final buffer of 22.5FPS as a last ditch effort to keep things smooth. Dropping below 22.5 is not acceptable, period. And staying IN it too long is also a sign you need to make some adjustments.

2 Likes

What settings do you tune for CPU? Except for TLOD Not sure what else is CPU-intensive enough to make a difference. Considering I have a 4090 and I’m heavily CPU-bound with my 5900X (until 7900X3D is released), I’d like to max my GPU (within reason) and lighten the load on my CPU. But beside setting LOD at 100 I’m not sure what else I can do to get more CPU headroom. All secondary apps are offloaded to the last 4 CPU cores with CPU affinity.

Just trying to understand the new Advanced Overlay information in the following screenshot and zoomed in portions:

Why does DevMode show I am heavily GPU bound, which I tend to believe because my GPU is pegged at 100% and the highest CPU single core load is about 60%, yet OpenXR Toolkit show I am slightly CPU bound?

Also why does MainThread and RdrThread differ so much from app CPU and rdr CPU respectively?

No MR BTW.

Sadly, we have limited options here. TLOD is really the only -adjustable- MSFS setting. The rest is just part of the sim work load. It’s definitely a huge factor in mitigating CPU bottlenecks, but it’s not a stop-all.

Furthermore, another option is enabling HAGS. I even hate mentioning it, because results vary widely from person to person.. but some graphic related processes in windows (and potentially the sim) had previously been handled by the CPU, and in theory you would be shifting that work to the GPU.

Also checking to making sure you aren’t running in windowed mode. There is a setting in your graphics settings in Windows 11 (i’m not sure about Windows 10) which is toggle to enable “Performance for Windowed Applications” or something to that effect. This might have an impact as well.

Volumetric clouds COULD have a CPU impact.. but I have no way of proving this. At the very least, be mindful of this guy. There is a substantial performance hit simply going from High->Ultra. This setting gets a lot of tuners in trouble.. because so many people dial in their settings at a busy airport during a clear day and suddenly when the weather gets bad, performance tanks. I ran with this setting on HIGH until I got my 4090. I could never run it on Ultra because clouds would bite me in the butt. lol

CPU affinity is a tricky one. MSFS typically uses at minimum 4 cores. I have also (at times) set the priority to HIGH for FlightSimulator.exe and set the affinity to typically underutilized cores. But performance varies.

edit: I forgot one! In the NVIDIA control panel, I set my VR pre-rendered frames to a maximum of 1, or “Application Controlled”. I don’t need the CPU rendering frames or doing any additional work.

1 Like

Just like you I’m CPU bound according to the overlay, but heavily GPU limited in MSFS developer mode.
LODs are both at 100 and then a mix of high/medium/Low/off.
Running a i7 9700k@4.8GHz and RTX 2080 with G2.

This is the way things are measured in OpenXR Toolkit:

app CPU is the time measured

  • From the moment the OpenXR runtime tells the game: we’re ready for the next frame
  • To the moment the game finishes submission of the frame for display and begins waiting for the next frame

This is a universal definition of “all the time an app take to make a frame, minus any time spent waiting”.

rdr CPU is the time measured

  • From the moment the app manifest its intent to start drawing a new frame
  • To the moment the begins submission of the frame for display.

Now the definitions of MainThread and RdrThreads are… I have absolutely no idea. This isn’t documented anywhere is it? So who knows what they measure. These aren’t standard measures. They measure “stuff that Asobo finds useful”.

What I see from your screenshot is that:

  • app GPU matches exactly “GPU” from MSFS overlay
  • app CPU matches exactly the frame time right under your FPS in the MSFS overlay
  • the MSFS overlay tells you you are limited by CPU (I think? It’s hard to read if it’s a C or a G), just like the OpenXR Toolkit overlay tells you.

In order words: OpenXR Toolkit and MSFS overlay agree, but they use different naming conventions.

My guess is that MainThread and RdrThread have somehow some overlap, but this is not indicated by the overlay. Thread = thing that runs in parallel. The MSFS overlay doesn’t provide any information about what runs in parallel and what sort of phasing (delta between when a thread runs and another one starts running).

Yet the DevMode overlay is telling you in plain letters “Limited by CPU”? (again please help me read if this is a C or a G… looks like a C to me).

“loads” are 100% not representative of frame times. You have multiple CPU cores, and as described above, it’s isn’t clear from the overlay what interdependencies there are between threads. For example, let’s assume the following guess:

  • MainThread is pinned to Core 0
  • RdrThread is pinned to Core 1
  • Top of the frame loop, MainThread wakes up, performs some work related to game logic, networking, physics… you name it. You have load on Core 0.
  • Meanwhile, RdrThread is waiting until the MainThread has a sufficient clear picture of what needs to be rendered. When this happens, Core 1 is idle.
  • Eventually MainThread signals RdrThread to wake up and do its job. At this point, you have a load on both Core 0 and Core 1.
  • At some point, MainThread might run out of work to do, but since RdrThread is not done doing its work, MainThread has to wait for it. It goes to sleep. Core 0 is now idle.
  • Eventually, RdrThread completes and signals MainThread to wake up and finish frame submission. At this point Core 1 is idle again and load is on Core 0.
  • MainThread finishes its work and submits the frame for display.

We can try to do a cheap timing diagram of this showing how neither Core 0 nor Core 1 will run at 100%:

As you can see here too, MainThread and RdrThread both participate to CPU frame times, but not in a predictable slice. The total duration of MainThread does not corresponds to the frame time on the CPU due to the idle/hand-over to RdrThread in the middle.

Now IF you CPU was faster, both the time spend in MainThread and RdrThread would be shorter, which would lead to faster CPU frame time.
However, IF you CPU has more cores, but these cores aren’t any faster, your CPU frame time would remain identical.

Going back to comparing measurements from OpenXR Toolkit, this is the (tentative) picture I draw:

I said TENTATIVE because Asobo and only Asobo knows what MainThread/RdrThread do and how they interact with each other. Therefore this is a best guess based on how typical multi-threaded applications would perform.

9 Likes