I tried the Turbo mode twice. Didn’t notice any performance increase at all with my G2.
Alt-Tab out of VR made MSFS hang om both occasions.
Win 10
DX11
TAA (no DLSS)
No MR
1 Like
Then move on in this case ![]()
As said on my website:
Note: Turbo mode is offered as-is. There will be no support for issues filed while using Turbo mode.
1 Like
Yup. I’m so happy what the toolkit does for my VR experience (acceptable performance and good visuals with tuning of saturation, exposure, vibrance etc.), so I won’t miss the Turbo mode one bit. But, if it’s there you got to try it out ![]()
1 Like
I tried and moved on after a few attempts at racing to disable Turbo before CTD… I should have read the release notes instead of just browsing! ![]()
It’s difficult of us simmers to move on when most of us would sell a kidney for an extra 10 FPS! ![]()
I’m not sure what turbo mode does however it’s keeping me around 40-42 fps during takeoff in Toronto and 45-47fps the rest of the flight. Previous to using turbo I would takeoff at 22-27 fps and fly at 40-41. There is some minor hanging every once in a while but barely even noticeable. appreciate all the work you do on this tool!
My setup is
I7-12700
3060ti
W11
32gb ram
Openxr scale 100, reprojection on
Xrtool 85% scaling 80% sharpening, performance, msfs medium
I tried new version and Turbo today. I can’t say there’s a lot of difference, but I didn’t knwo how to measure it, because I must use MR. I made OXRTK to forese MR with 45 lock. I definitely stayed that way. So MR was working together with Turbo. I was flying in GA plane in the alps, so it was locked at 45 for most of the flight, so I can’t know it helped or not. As I’m CPU-limited with 4090 and 5900X it may not have made any difference. But I didn’t have any CTD either, so maybe I’ll leave it on and see if it makes any difference for stuttering. At times I though there’s more stuttering without it than with it, but I’m not really sure. In that area I seem to have stuttering relevan to scenery loading mostly, nothing regular that could be easily identified as improved or worsened.
Woah this sounds almost too good to be true. I had a couple of people seeing up to 20 FPS gain but that was in DCS, a game that isnt truly OpenXR (and therefore cannot do good frame management like MSFS does).
You can toggle Turbo on/off without restarting VR (toggling on will freeze for 1s though). This might help confirm that the gain is from Turbo, but I suspect you might have changed other settings too to explain sugh gain.
Show me a simmer who doesn’t click a new “turbo” button, and I’ll show you a simmer who’s tired of simming
– Samuel Johnson, 1777
8 Likes
I’ll try it out when I get home from work. I actually updated to the new version today and turned turbo on with cas and the thing was going haywire. Reverted back to my original settings (but left turbo on) and notice the fps counter was at my limit so I kept increasing the limit until I saw it stop at 80fps while in the menu screen (has never been over 45).
I live in Toronto and bought the flytampa YYZ airport so it’s my default takeoff for playing with setting,I’ve done it probably 50-60 times in the last week. Note- these improvements were sunset/night flying. At the end of my session I tried a takeoff in mid day and it was hanging quite a bit. I had been playing with settings for around 2 hours at this point so I don’t know if a restart would have fixed that issue. Don’t usually fly during the day because my oculus makes everything bright white and looks unrealistic.
If it’s matters I’m using a Quest 2 - also noticed I’m CPU bound now 3-5ms throughout whole flight when I only ever saw cpu bound in the loading screens previously.
sorry reposting here, asked in discord as well
can someone help me understand these numbers
with MR ON
in OXRTK
CPU 12ms
GPU 20ms
IN MSFS
CPU 20-25ms
GPU 20ms
with MR OFF
In OXRTK
CPU 20ms
GPU 20ms
in MSFS
CPU 10ms
GPU 20ms
looks like GPU is 20ms across all 4 but CPU seems to vary (i guess that is expected with MR on or off) but can someone explain to me if i have a bottleneck and what it is? im trying to understand if i will benefit from a better GPU with these settings
Well, you really only need one kidney after all. ![]()
I have no idea why yet but as you discovered, it looks like using the OpenXR Toolkit frame throttling and setting it to your framerate or framerate-1 magically makes OpenXR Toolkit report the correct app CPU measurements. Not exactly sure why that is. Using the frame throttling makes you CPU-bound from the OpenXR perspective (you slow down frames on the CPU side). So I suspect this has something to do with that and how MSFS does multi-theading of its frame waiting.
Whatever the game is doing right now, it’s managing to confuse OpenXR Toolkit, the WMR overlay, the Varjo Analytics, and probably more. None of these are giving consistent results.
So is there a way to know if one is CPU-limited or GPU-limited? In my case I’m fairly positive I’m CPU-limited because of my 4090 paired with 5900X CPU. However when tuning and raising GPU-intensive settings it’s essential to know where the balance lies, I don’t want to go to the GPU-limited territory, just raise the settings as high as it is safe to not go over that point. Is there a reliable metrics now to do that?
the DevMode overlay I suppose. For me it’s 100% useless as it flickers all the time and never giving me the same result.
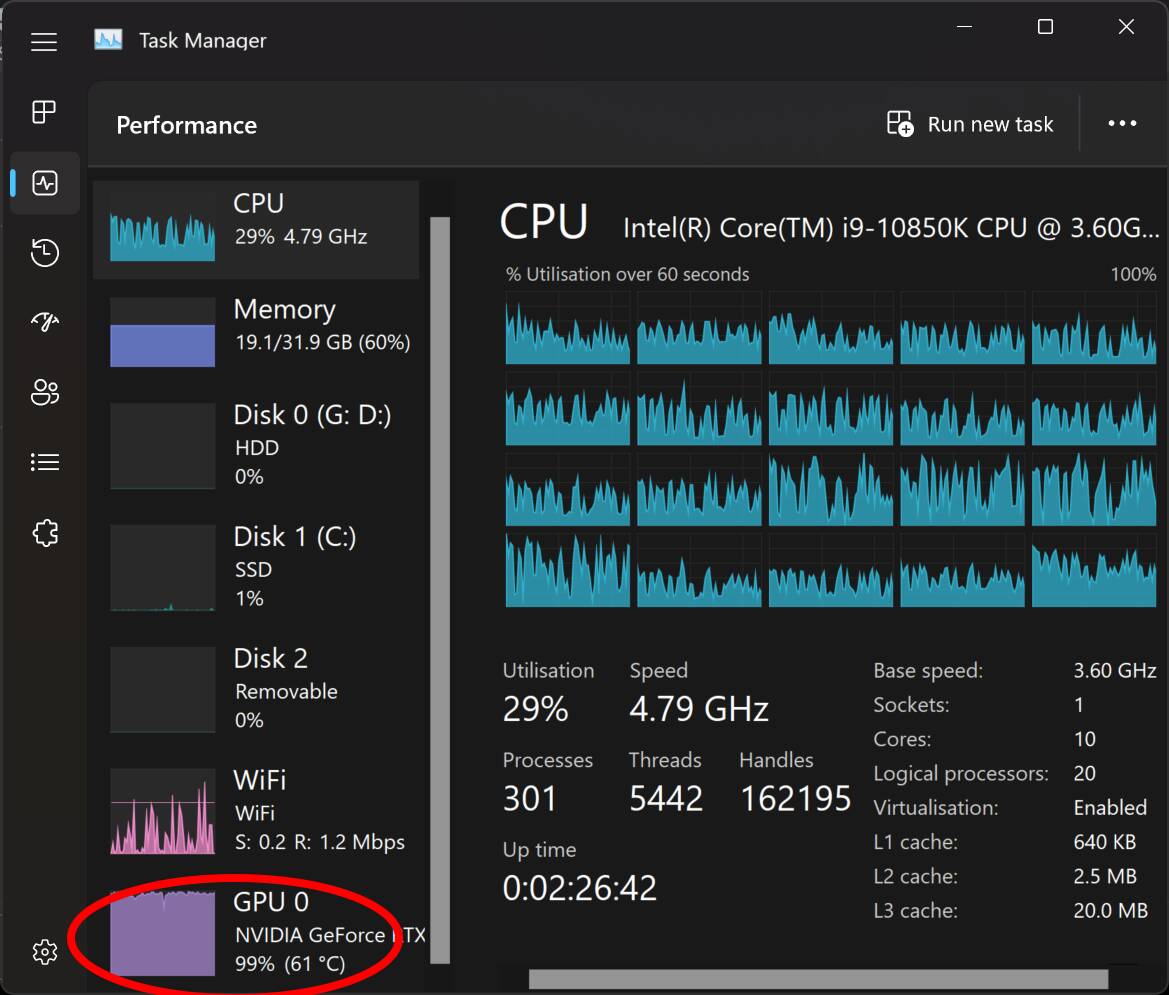
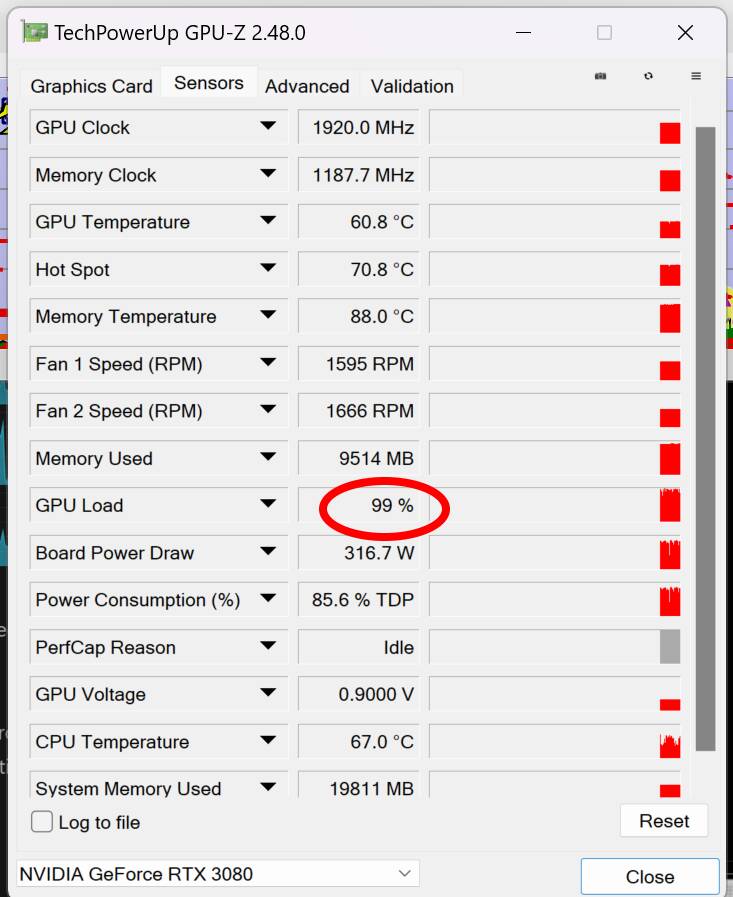
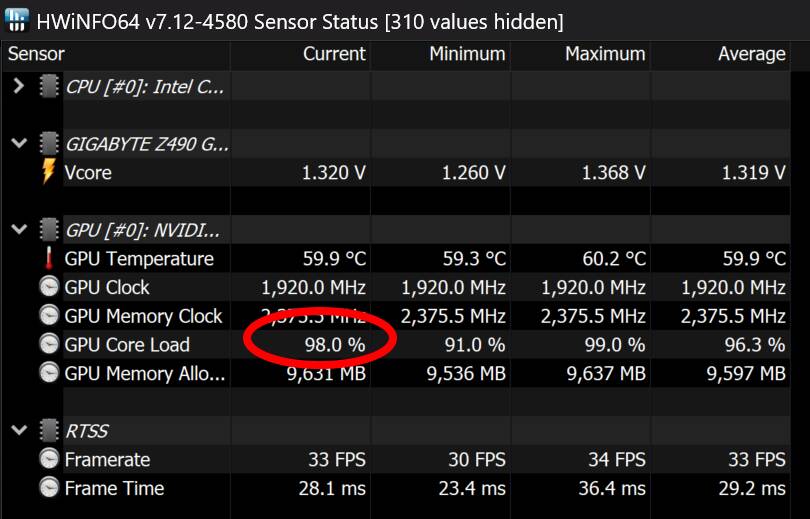
If DevMode is not being reliable, a crude way to determine whether you are GPU limited or not is to monitor GPU load using a utility like Windows Task Manager (doesn’t seem to work with DX12 in my experience but DX11 is fine), GPU-Z or HWiNFO. If your GPU load is constantly >= 97% then you are GPU limited. Note this is not reliable if you use frame rate caps or MR, but for normal unfettered VR it is good enough.
eg. here I am mostly GPU limited flying Concorde supersonic (scenerio loading at such a fast speed is what stops it being 100% GPU limited)
Turbo mode has significantly reduced judders in VR when moving my head in the flight deck. The smoothness difference is remarkable. CTDs do happen when using ctrl+tab to exit VR, however, my workaround is by closing the Mixed Reality Portal session to go back to 2D, and simply restarting it, then ctrl+tab to return to VR. Even with FSLTR traffic @ 90 IFR aircraft, I’m seeing a +10 FPS increase with no judder. This never happened before. @mbucchia you’ve made my VR experience so much better with Turbo. Can’t thank you enough sir!
RTX 3090
i9-9900K
32GB RAM
DLSS Quality
1 Like
Thank you for introducing Turbo in OXRTK. It has changed my VR experience. No more judder/shaking with head movement in the flight deck. Keep up the excellent work.
1 Like
But I have to use MR ![]() so I wonder how do I measure that… Maybe I can disable MR, tweak settings and enable it back…
so I wonder how do I measure that… Maybe I can disable MR, tweak settings and enable it back…
1 Like
You have no choice but to disable MR to understand where your bottlenecks are. MR is artificially capping your frame rate. Therefore you are MR-limited ![]() neither your CPU nor GPU are limiting you when your frame rate is capped.
neither your CPU nor GPU are limiting you when your frame rate is capped.
Your question is likely "what prevents me from hitting the next best frame divider (eg you are hitting 30 FPS today and aim for 45 FPS). Your way to answer that is to unset MR and let your frame rate be unlocked. You will then see how short you are of 45 FPS and whether your CPU or GPU is preventing you from hitting 45 (plus estimated overhead for MR). Perhaps it’s even both CPU and GPU.
For example at target: 45 FPS (22.2ms), CPU: 24ms, GPU: 28ms = you are GPU limited, but even if you remove that limitation, you will become CPU limited before reaching your target. Therefore you are both GPU and CPU limited for the 45 FPS frame rate.
1 Like
Alright! I have spent some time analyzing traces from MSFS and understading the patterns, and I can finally explain what we are seeing here.
In the most basic scenario, the one where you are CPU-bound, there is little choice: the CPU performs all operations for frame N, including enqueuing commands for the GPU rendering, and all of it must completes before starting frame N+1.
We have something that looks like this:
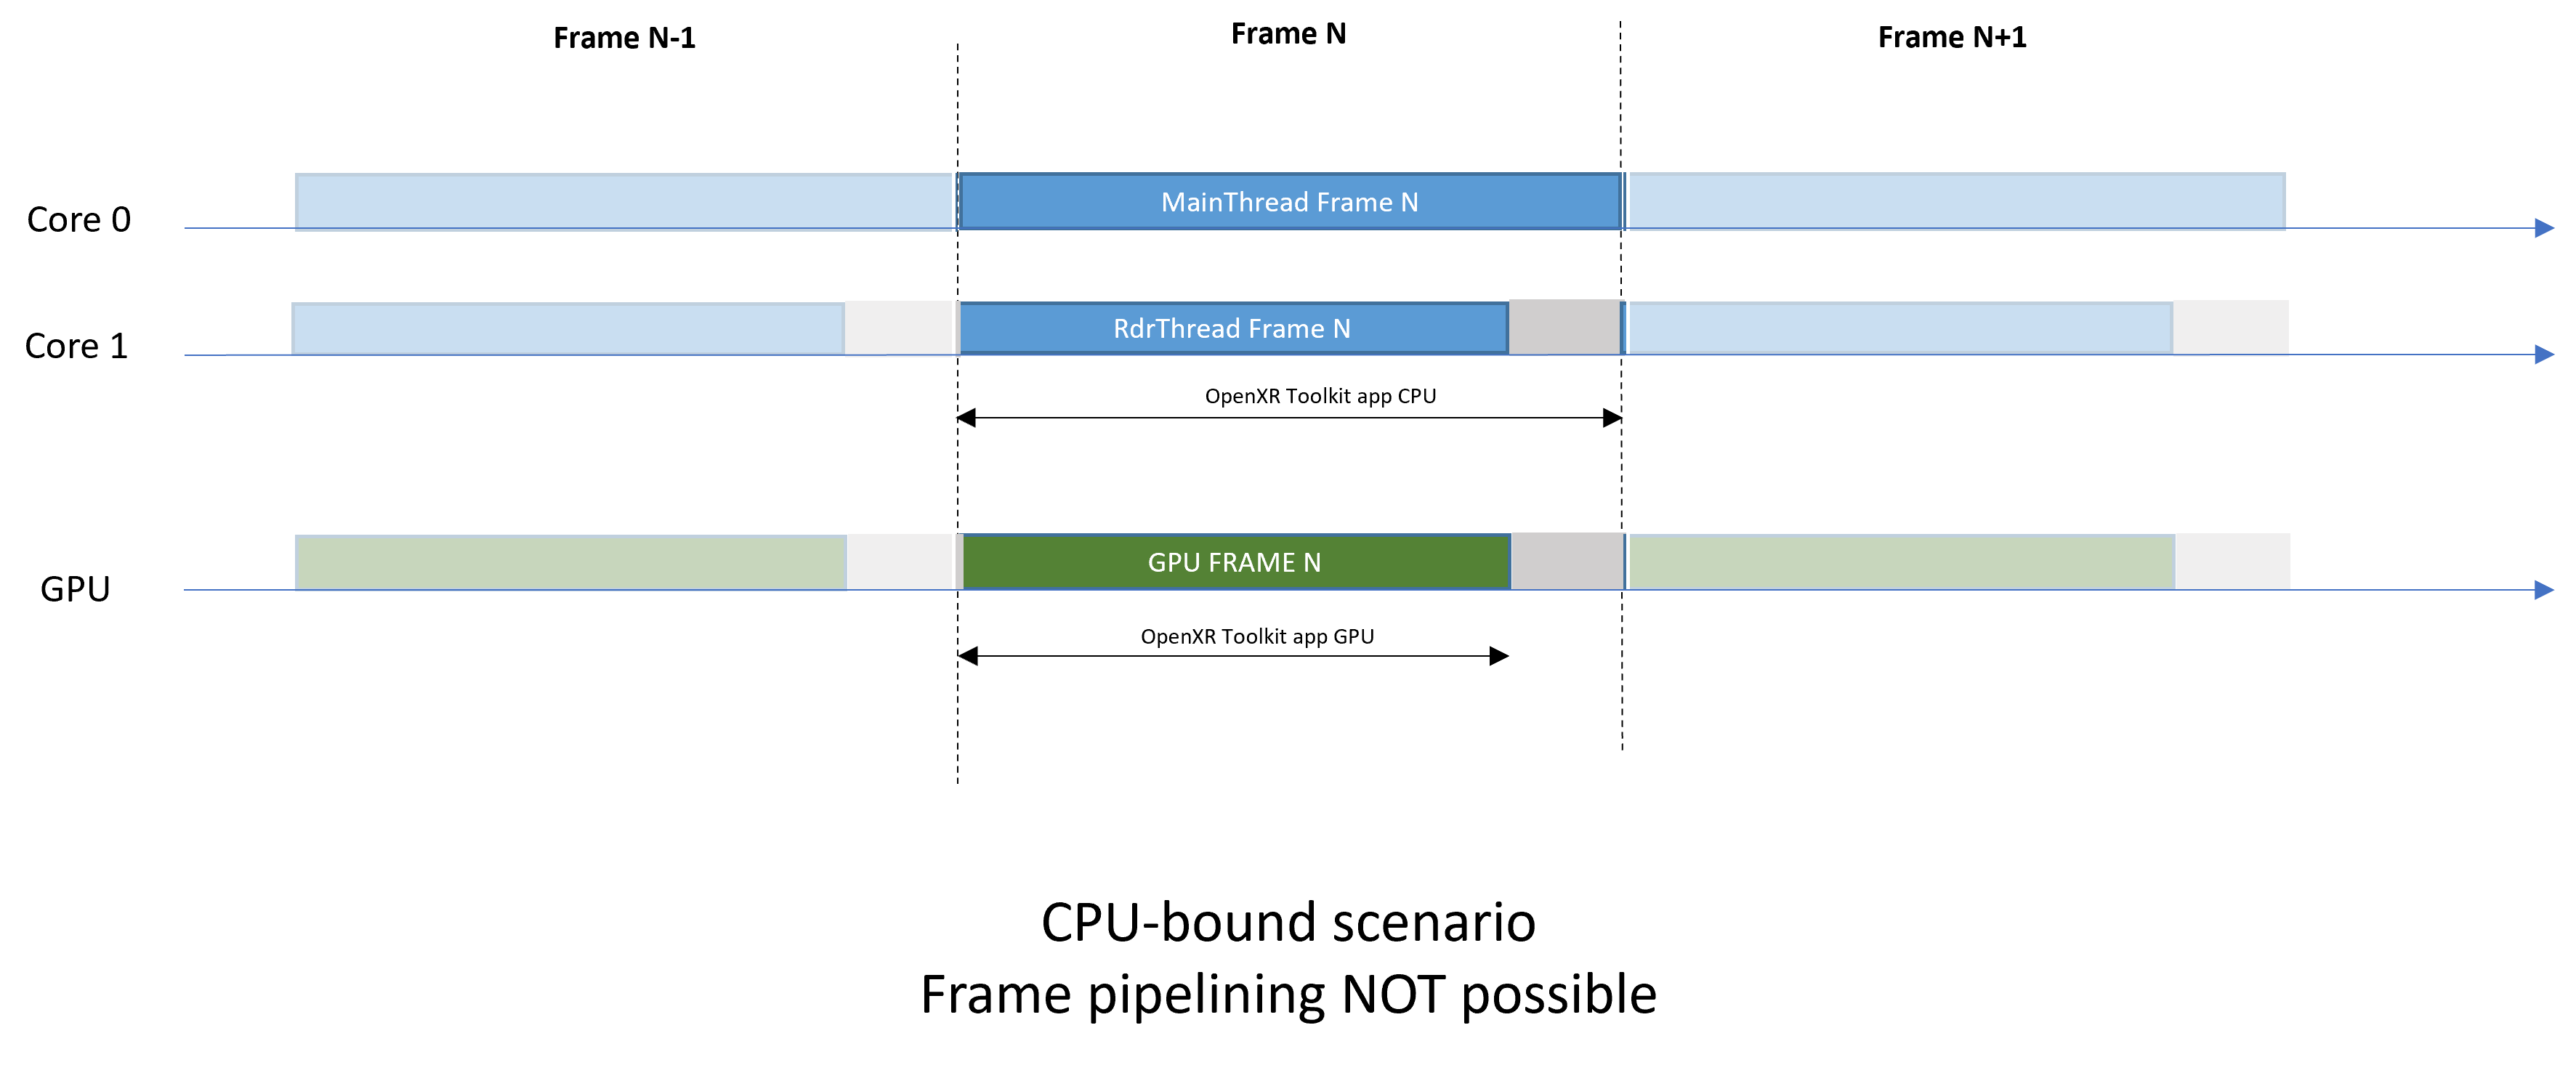
Pretty straightforward: the app CPU measurement envelopes all the work done on the CPU for frame N. The app CPU is an accurate representation of the CPU frame time.
Now, to the more interesting scenario, the one where you are GPU-bound. In this scenario, a feature was introduced in OpenXR to allow something called frame pipelining. It allows the CPU to know ahead of time the predicted display time of the next frame, even when the current frame is still finishing to be rendered. Knowing this predicted display time means that the engine can start working on physics, game logic, etc. on the CPU for the next frame while the GPU finishes rendering of the current frame. We will call this phase “pre-rendering”.
Now things look a little more complicated:
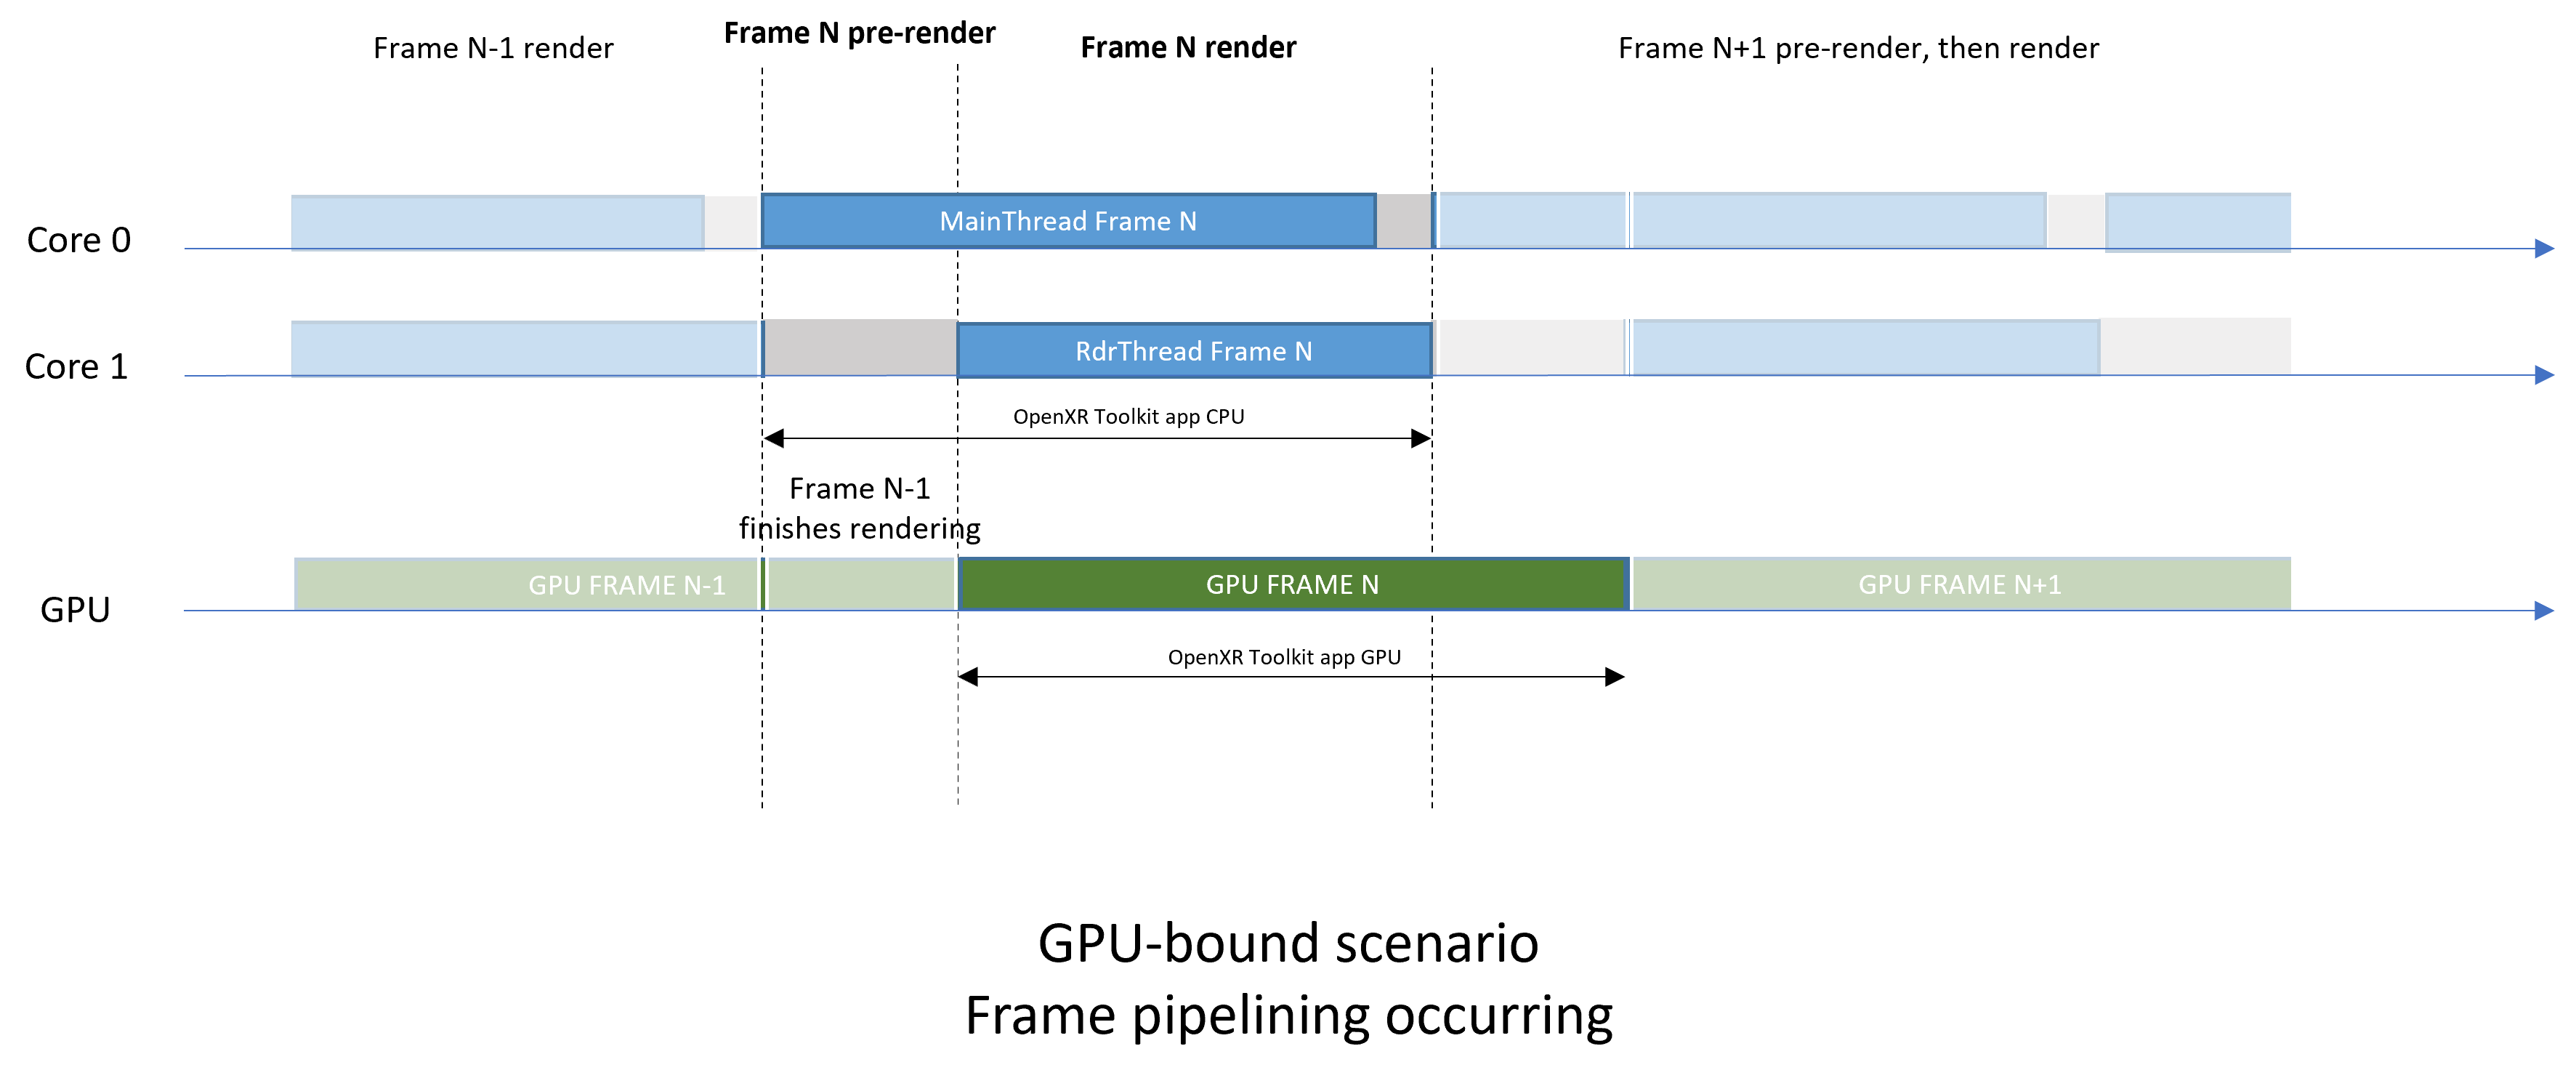
What we see here is that at any given time, there is an overlap of work, with the CPU working on frame N while the GPU is working on frame N-1, before eventually working on frame N.
The app CPU measurement includes both the frame pre-rendering and the actual rendering (enqueuing commands for the GPU). The app CPU is NOT representative of your actual CPU frame time as you know it due to the overlap.. The pre-rendering time, while it is part of the work needed for frame N, occurs while the rendering of frame N-1 finishes. Therefore, the pre-rendering time does not “count” towards frame N, since frame N’s time slot has not begun yet.
Now to the more interesting or debatable questions regarding the GPU-bound situation:
-
Is the
CPU boundindicator wrong? Yes, in the case of pipelining this indicator is 100% wrong. And it shall be removed in the next version of OpenXR Toolkit to avoid confusion.
NOTE for the reader who might not care about MSFS: Not all applications will do pipelining, in fact very few will do. TheCPU boundindicator is still relevant to those non-pipelined applications, like OpenComposite. But since we can’t know for sure what each app is doing, the indicator will just be removed. -
Is
app CPUwrong? The value ofapp CPUdoes represent the time that elapses on the CPU between the moment the engine starts working on a frame and the moment that frame is completed. That is the definition of “CPU frame time”. This is just not the measurement that most people care about. -
Is
app CPUuseful? This is the better question to ask. Because of the parallelism happening, the value ofapp CPUdoes include some work being done while the previous frame is finishing up. That work only exists because the situation is GPU-bound and the CPU has an opportunity to get a headstart. The actual amount of work happening during frame N on the CPU is whatrdr CPUreports. -
Is
rdr CPUuseful? Yes and no. It can help you figure out how much headroom you have before getting into CPU-bound territory, however it’s not a good indicator of how much better your performance would be if you were not GPU-bound. For example, if yourrdr CPUis 11.1ms, that does not mean that upgrading your GPU would help you get closer to 90 Hz, since not being GPU-bound would preclude pipelining from happening, and thereforerdr CPUcould no longer be the “longest load” that runs on your CPU (MainThread likely would). In other words: the less GPU-bound you are, the less CPU-efficient you will be. -
Is
rdr CPUthe CPU frame time? Not really. As said aboveapp CPUdoes follow the definition of CPU frame time, but pipelining makes the definition of CPU frame time obsolete and useless. This is likely why Asobo chose to display its MainThread and RdrThread timings rather than a (pointless?) CPU frame time.
10 Likes