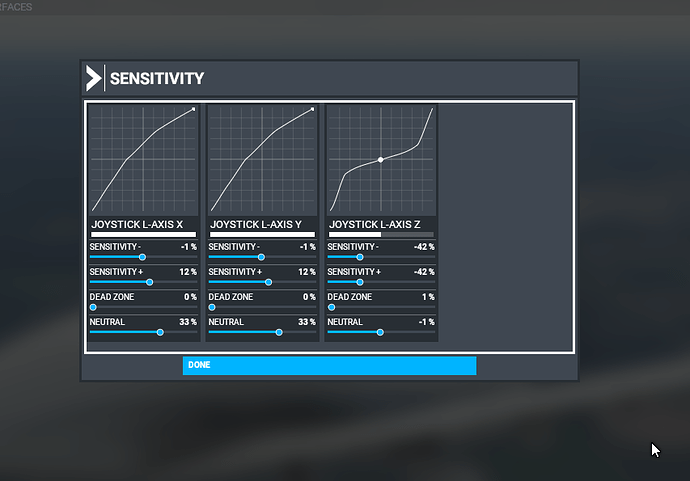
I am a bit confused as to how the sensitivity input/output graph is suppose to work. I assume that the graph represents the input on the X-graph-axis(horizontal) and the output is on the Y-graph-axis (Vertical). The graph starts at the zero-zero (0,0) point. For the joystick this seems to be reasonable. Move the joystick left and right the dot move left and right to represent the displacement input signal left and right. You tweak the values to get a corresponding output value.
Assuming from above the joystick sends an input value of +32000 to -32000 for an output of +32000 to -32000 - A one to one ratio. (The chart above says that a different joystick may have differing values for these input values)
Side question: Has anyone seen the deflection NOT go all the way to the end? Are some issues with peripherals due to this input value difference you talk about?
This makes sense for the joystick - left/right/rotate. Now you can tweak the output to limit the values of Y as you move the joystick, however you cannot change the max value of +32000 to -32000. So you end up with drastic outputs at close to max deflection. This is not what one would expect. I expect to be able to set upper and lower values (+32000, -32000) to say (+10000, -10000). I certainly don’t want what is implemented currently.
The dead zone - seems to be the only thing implemented correctly. Set a dead zone - any X input results in a zero output up to a point.
The new neutral slider is confusing. Setting this slider to -100 to zero to +100 moves the curve in the Y graph-axis. Setting this to -100 as an example of what happens, moves the curve such that an input of -32000 results in an output of -32000, then based on the Sensitivity -ve (say 1%) results in a upper value of zero. Setting neutral to +100 give an lower output of zero and upper of +32000. Again not what one would want. I would like both upper and lower to be settable.
I would ask that you also provide some help/documentation on how to set these parameters. Examples of typical configurations and what they are expected to compensate for.
Now your implementation for rudder pedals seems to be strange. The setting page shows the rudder pedals and no input = zero output, half way input is half way output. This seems correct. But the sensitivity does not allow me to set the rudder input/output the way I want. I would like to set the slope to a more shallow angle, ie. lots of rudder pedal input results in lower rudder deflection. However the upper and lower limits are still there. Setting the sensitivity ± gives me the lower slope, but only up to half deflection and then the drastic higher output after half way deflection. Having the ability to set the upper and lower limits would allow for this to be a more smoother graph.
Pic shows a negative sensitivity ±ve gives a shallow line near zero, but steep later. While a negative neutral number with offsetting ± sensitivity gives a similar graph. What would be the correct setting? (pic just to show different setting )
Rudder brakes are a different application here as the dot starts at the top (slider) and moves down and in reverse in this case. Now I want lower sensitivity at the start of applying brakes. The graph representation is not correct. I would have assumed it would should the x and y graph axis on the left and bottom. not in the center.


