IMHO most people who watch the streams mainly want the system to “work as expected” or to hear what is being worked on and what is coming next. Fair enough … as I already said, I do not expect the dev streams to be like P99 CONF or Black Hat or something like that.
Getting a very detailed “state of the bug hunting” would cost too much time and, while it would be interesting for a goose like me, and I guess for you @WindlessBulb411 too, … even many software developers would not be able to follow.
In most companies the people who have the knowledge to find or fix such bugs are so rare and so busy that you do not want to take them aside for a day or two to prepare a presentation about what they are searching for and why. Explaining such a complicated system in a correct yet understandable way … is a serious amount of work on its own.
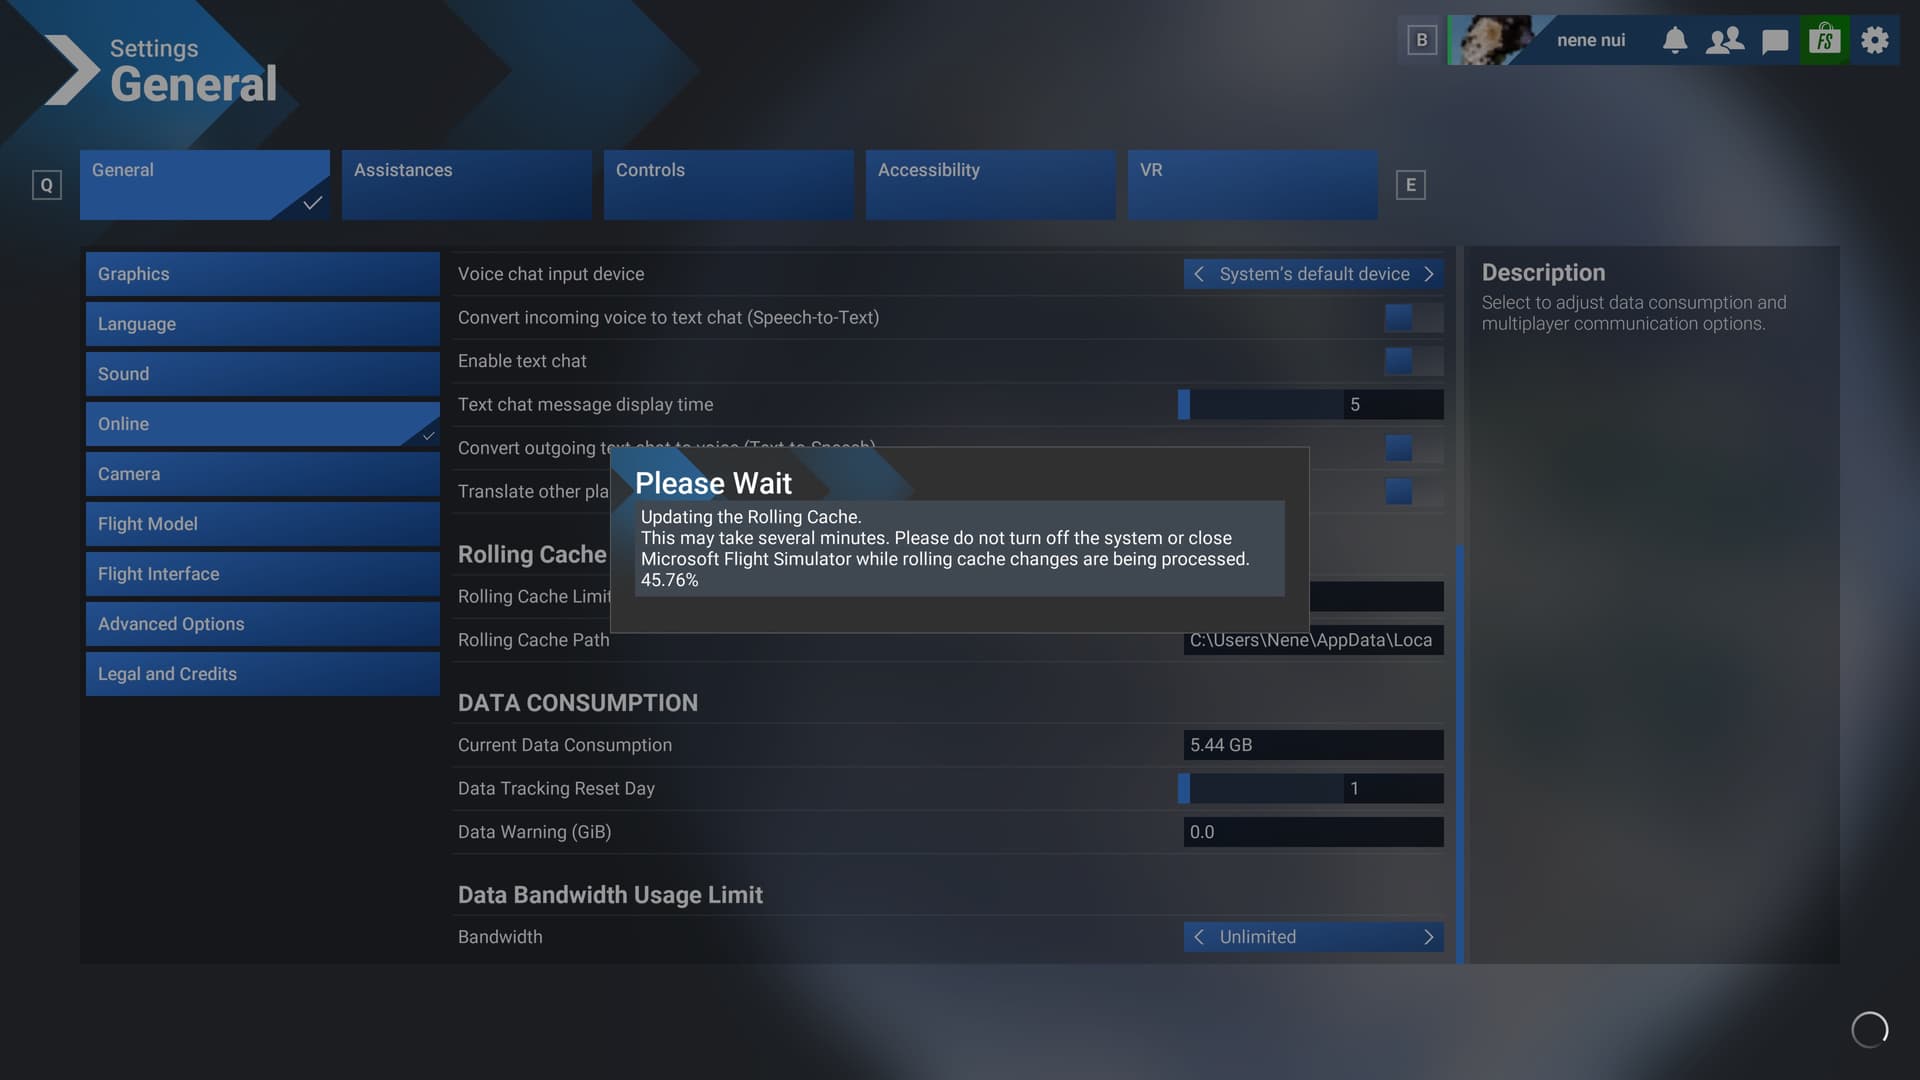
It looks like that feature was removed from the UI … and I agree that it should be added again.
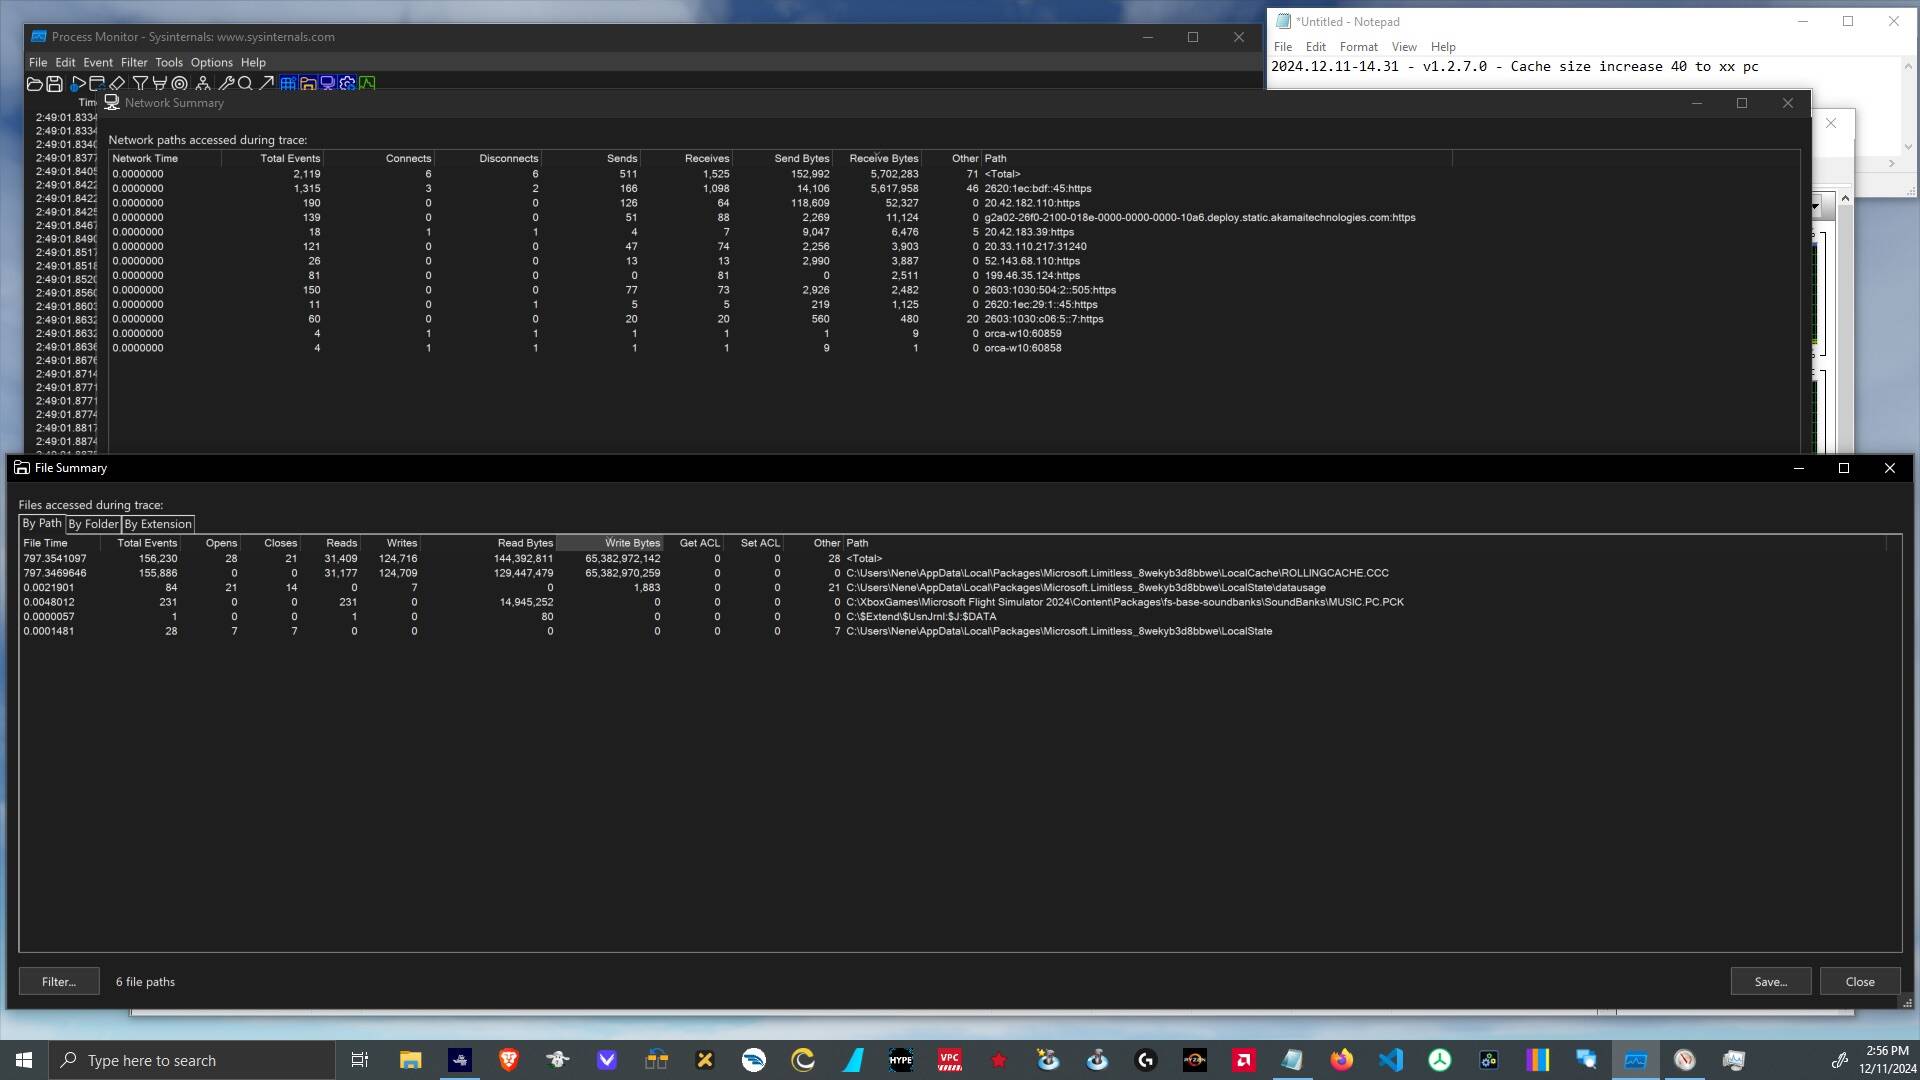
I just deleted the RollingCache.ccc file. After the next launch I did automatically get a clean 16 GB cache. You can see the full path in almost every Process Monitor image I posted above.
When I tried to reduce the size in the “Settings → Online” section the sim told me that I can only grow it. Which does make sense to some degree, because a size reductions will have to completely clear the cache and that will dramatically increase launch times again etc.
A true shrink algorithm is a lot of work … so I understand why they are not doing it. However, it is strange, that the “shrink warning” dialog does not offer a button like: “Yes, yes, fine … delete all my cached content, but please shrink the size … please”
… and to avoid the “shirk to clean” hack … just add a “clean cache” button too.
PS: Seems like the servers are red hot burning again right now … so I guess it is not a good time for flying … but it is a good time for recording “bad cache and network” activity.
That’s a good experiment, particularly Process Monitor showing how much data flows into the cache.
I have my cache at 256GB and have similar benefits. My guess was the background data trickle could be weather or local activity. It’s fairly benign compared to the major downloads.
I “fear” that you are correct … I really really am still hoping that it is a little bit more sophisticated than that. A trivial FIFO will make (lots of) manual “install style caches” unavoidable.
I also fear that there is little to no preprocessing of the data … e.g. JSON will be JSON, and not some preprocessed archived C++ data dump. The size patterns show a “byte count inflation” … so while the over-the-write stream seems compressed … the cache to RAM stream seems uncompressed.
I was thinking about tracking the changes between different Rolling Cache states to make the change patterns visible. Perhaps by the end of next week I will have some “proof for the pudding”.
From a distance it feels like there is a lot of room for improvements (besides the necessary bug fixes).
If it is a trivial FIFO … hopefully at least in a ring buffer … then it will usually “always” be 100% full (after some time).
I am still hoping that there might be at least a few different ring groups in the same cache file … different ring buffers for different asset categories.
But even with that I am increasingly less optimistic. Hmm.
Tests will tell.
We know library items have a version, so logically the cache could have a versioning system of sorts.
The FIFO is great for streaming data, as data can be written continuously at speed (with a bit of address trickery).
My observations for a new flight/airport is there is a significant burst of network activity, then significant disk reading, then the sim is ready to Start a flight. So network data in first, then decode the data for the sim.
We will have to propose a question to Seb for the next dev video, to explain how the cache works and ask for a percent full display, please.
As the data is coming in the response from the server to the sim it will be something different.
However, if the 30 KB download …
is JSON data, then it is around 300 KB of raw uncompressed data.
is map weather data, then why is the sim updating the weather when I do not even look at the map?
is server availability info, why is if so much?
A 30 KB reason is clearly not a trivial “ping-response” e.g. in order keep the relative time deviation under control.
Again. I have no idea what it is.
But I am always puzzled when I see a lot of data exchanged during extremely idle system conditions, because that needs to be multiplied by 10,000 to 100,000 parallel game sessions. And in total that always becomes significant stress on the servers.
(just to be a pedantic goose: kB … kiloBytes … would be the 1000 version. I usually make rule of thumb “claims” and use a 1000 x factor scale. Less headaches included.)
I could imagine there are a bunch of things such as periodic time and weather info for displaying the world map (in case you click on free flight and the globe is displayed?). But honestly who knows, moving some things to the cloud doesn’t mean they made it efficient, especially when rushed. Calls that might have been for local data are now moving across the network?
Still interesting to see. I once tried to Wireshark the Xbox traffic with MSFS 2020 when all of the low bandwidth and connection lost errors were happening, but wasn’t really able to interpret what it was doing very well.
At least with FS2024 all connections that I can see go to port 443 … HTTPS … so Wireshark will not provide any more info than Process Monitor since all payload is encrypted anyway.
Process Monitor so far turned out to be a very useful tool for my tests, as it provides many filter options and nice summary reports. This way it becomes easier to see usage patterns.
Seeing the real req-res data would obviously make it a lot easier to understand the nature of the data. But without that there is more mystery and it remains more of a tech-puzzle … for those long winter days.
Here are two example images which show the viewing pattern. Some views have been from higher up overview positions, while other views have been close up to interesting objects (subjects? … can you find the reindeer “hidden” in the first picture?).
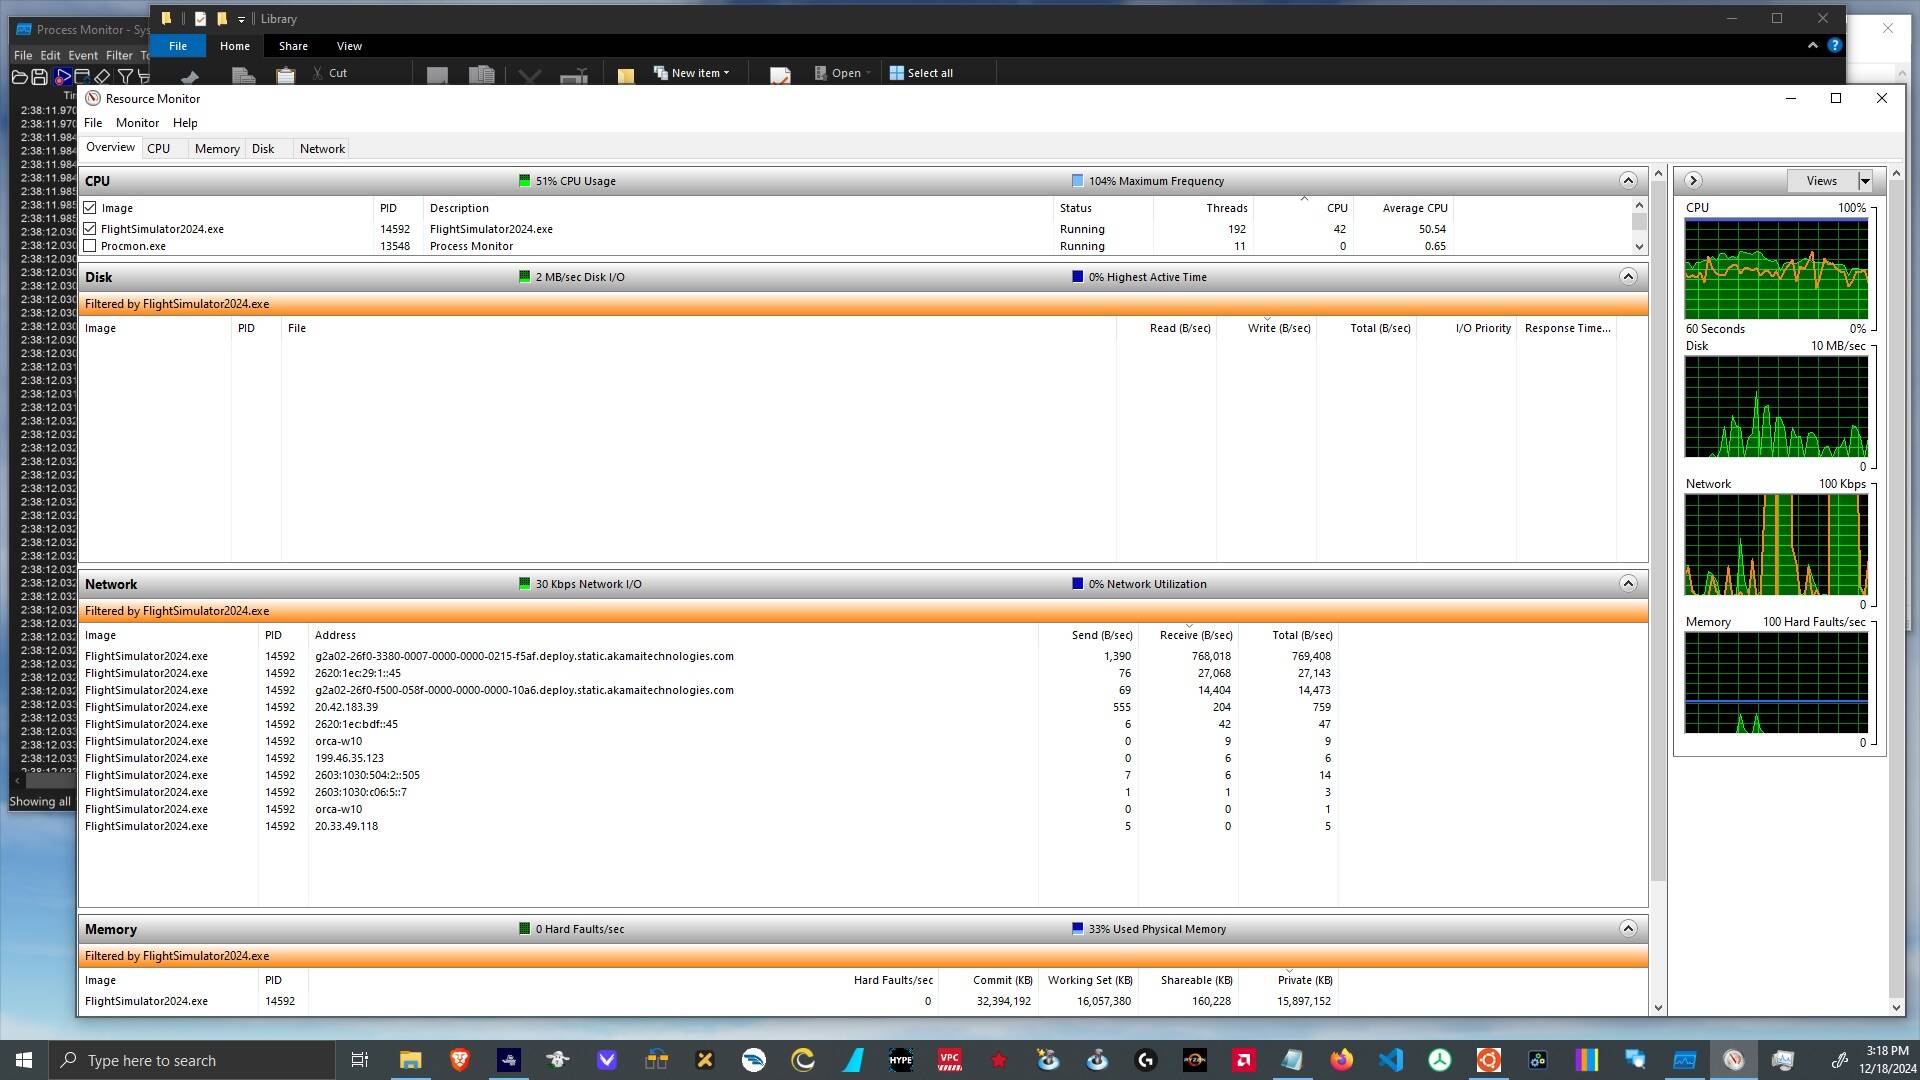
The visit happend (by accident) in a period where download speeds from the servers have been somewhat low (<= 20 Mbps) and even a few “bandwidth too low” alerts have been shown too. The throughput did fluctuate greatly. This is an example report from the Resource Monitor app:
In the above image one can see what I would call “LOD inversion” (due to server failures a.k.a. as timeouts). For example the blue SUV very close to the camera is only of very low LOD nature, while in the distance there are a number of “ultra LOD” cars, like the fuel truck, the red van on the left etc.
To summerize this test:
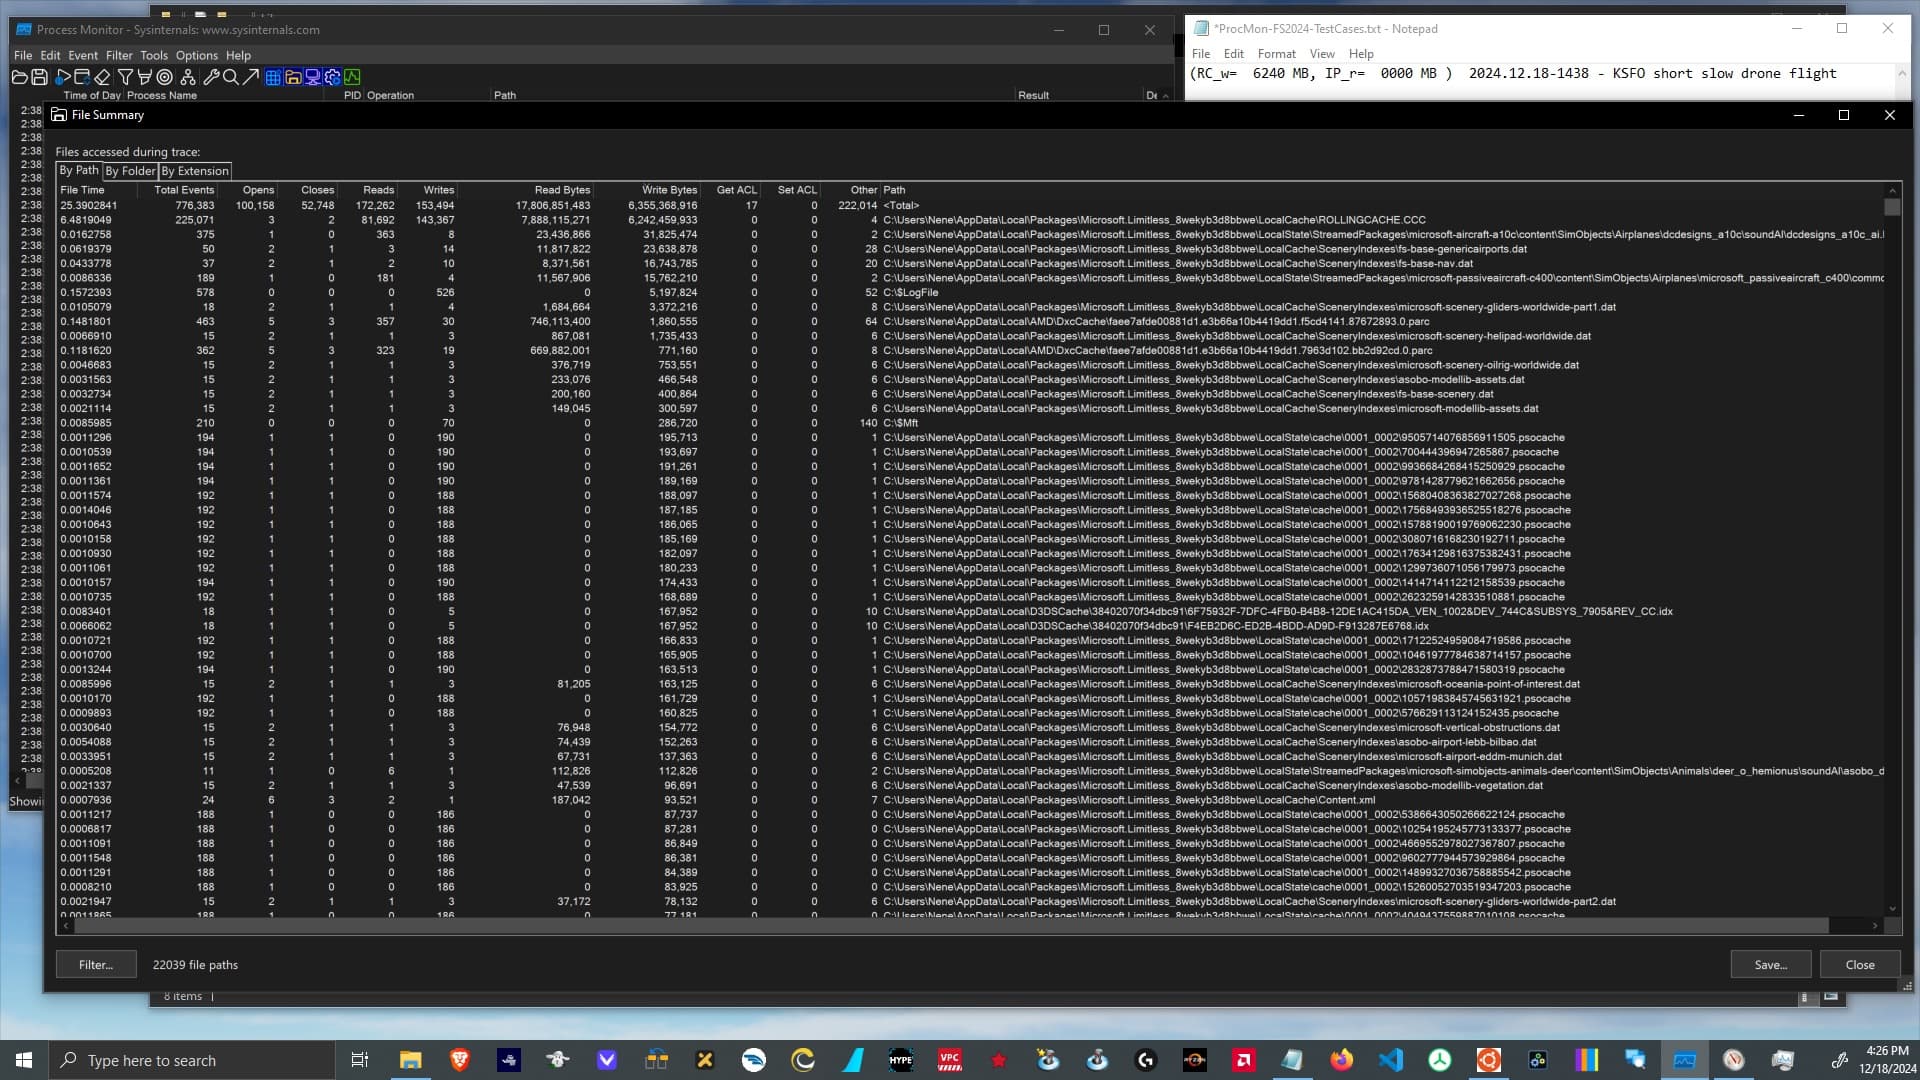
A major custom build international airport like KSFO can easily write 6 GB and more into the cache.
So with a 16 GB cache and an “ultra aircraft” flying between two “ultra airports”
… even a simple two-way flight might required the first airport to get streamed twice.
Slow download speeds can result in server request timeouts (failures)
… which can cause any kind of asset to only be visible in a lower than expected level of detail (LOD).
The “healing process” for objects that have been cached in a “corrupt” (low LOD) state, is … well … unclear.
Maybe one has to wait until the data is dropped from the cache
… which would become a problem in (desirable) very large RollingCache.ccc configurations.
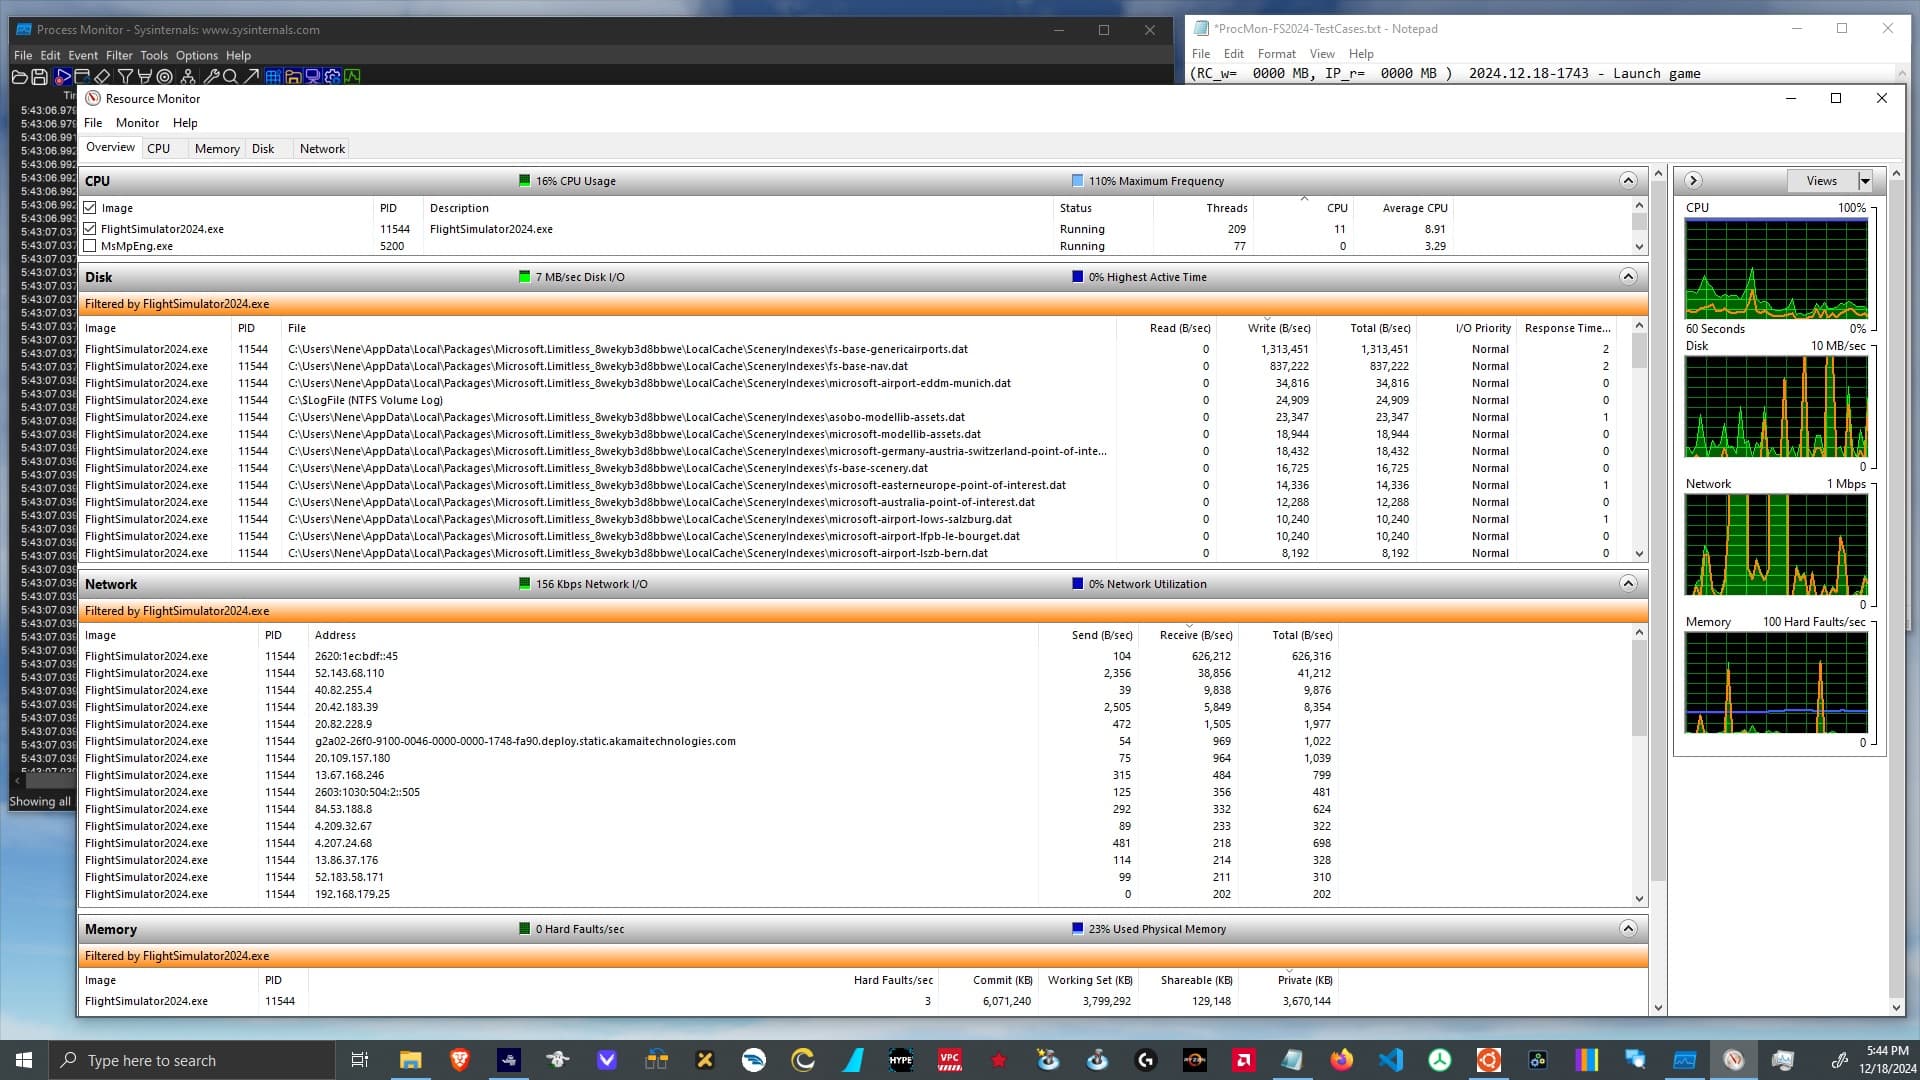
2024.12.18-17.43 - v1.2.7.0 - Launch game … downloads the same 40 MB again and again
Here I wanted to double check what I was suspecting and did already mention in a previous test:
Does the game really cache all important files … or does it download some on every launch?
I was already seeing too many writes to the SceneryIndexes folder. So lets check that specifically.
The term “cache” here is not restricted to the RollingCache.ccc. Any kind of local storage is in essence a form of local “cache”.
What triggered the interest of this goose was that in the Resource Monitor I was always seeing write operation to the same file names inside this folder:
The positive observations are … well … in this case I think there is nothing really positive, besides that FS2024 does launch reliably for me, no matter what is happening behind the colorful screen. And it “only” took 3 minutes to launch this time. I have seen (recorded) a lot slower launches too.
The “negative” (confusing?) observations are:
All 301 files have been modified (re-downloaded and re-written to disk) during the launch.
All 301 files are bit-to-bit (sha256) identical to the versions that already have been on the disk from the previous launch(es).
Around 40 MB of useless data has been downloaded in 1 to 2 minutes
… most likely causing a launch delay of 1 to 2 minutes (of a total of 3 minutes)
… under the present network and server performance. On bad times of a day that might even require (a lot) more time.
Why?
To summerize this test:
Around 40 MB of downloads related to 301 files stored inside the SceneryIndexes folder get downloaded on every sim launch
… even when they are bit-identical to the files which already have be stored on the local drive.
This seems to prolong the launch process by 1 to 2 minutes under “normal” conditions.
There seems to be a lack of “meta-index” files with checksums and versions … an “index-index”.
With such a simple addition the sim launches might be a lot fast.
PS: The forum bot will now prevent me from posting additional test results … unless some other user also will leave some post below. So if you find the above useful … write a line.