Also, I wasn’t speaking of just Community folder add-ons, but also those that are Marketplace purchases that are being, for the time being, forced upon us via streaming. In this case, it would be any airplanes purchased via the Marketplace rather than scenery since those are currently disabled.
I can easily help with that limitation by posting, as needed, to overcome it.
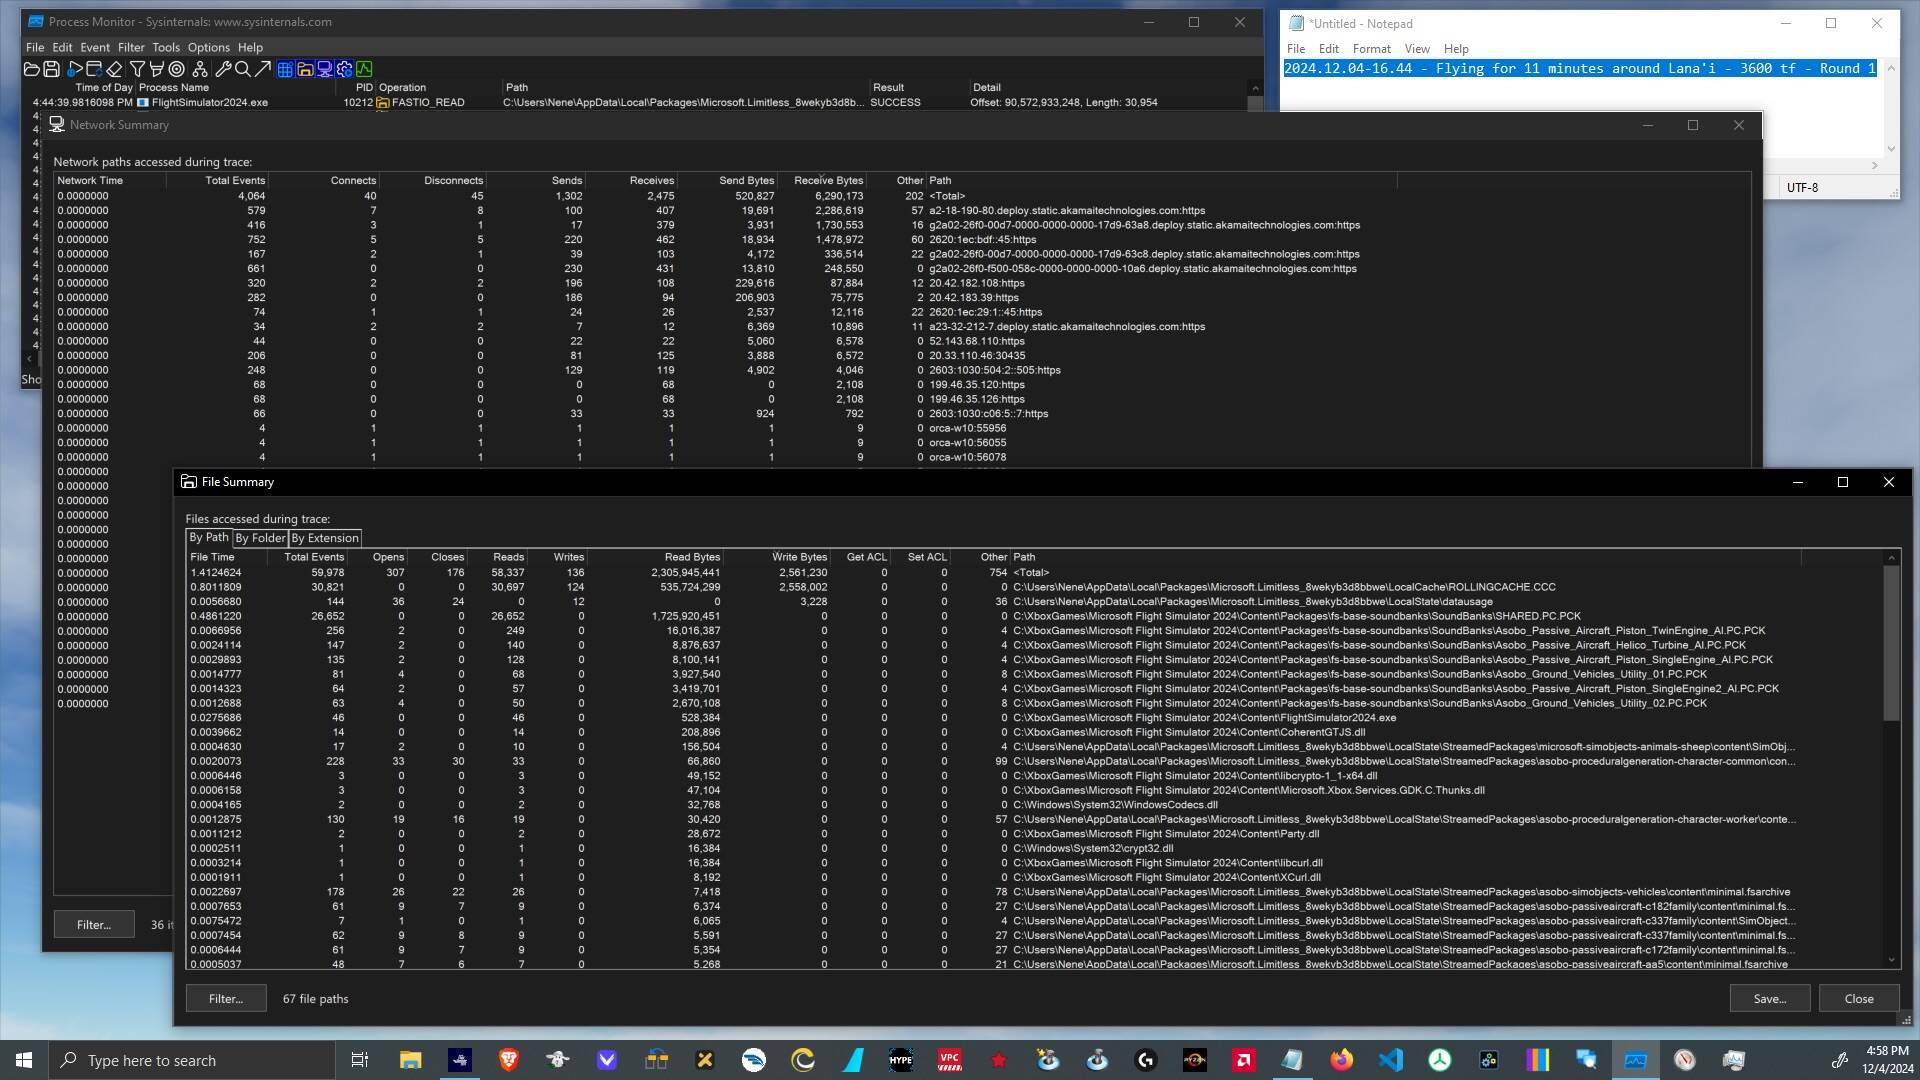
The Process Monitor recording then showed the following network and file access results. The first image has the data for round 1 and the second for round 3:
My FS2024 config remained as in all the previous tests … but this time I want to stress:
All graphics settings have been, as always, at “Ultra” or above, where possible.
Before I try to draw some conclusions I want to compare the data from the 3 different round trips:
Round 1
Round 2
Round 3
Network - Send Bytes
520,827
495,950
491,216
Network - Received Bytes
6,290,173
1,828,951
1,790,695
Files - All - Read Bytes
2,305,945,441
2,320,858,362
2,163,690,657
Files - Sound - Read Bytes
1,725,920,451
1,614,814,875
1,614,814,875
Files - RC - Read Bytes
535,724,299
619,388,892
496,997,315
Files - All - Write Bytes
2,561,230
69,261
86,447
Files - RC - Write Bytes
2,558,002
65,548
83,219
On average (per seconds) over a 678 second flight that translates to:
Round 1
Round 2
Round 3
Network - Send Bytes/s
768
731
724
Network - Received Bytes/s
9,277
2,697
2,641
Files - RC - Read Bytes
790,153
913,552
733,034
Files - RC - Write Bytes
3,772
96
122
The positive observations are:
Files
There is always the same amount of data read from disk … around 2.3GB.
So a deterministic flight produces a deterministic data demand. This is good.
The biggest chunck (1.7 GB) comes from a file in the fs-base-soundbanks package.
Almost the entire rest is read from the RollingCache.ccc … around 0.5 GB.
All data written goes to the RollingCache.ccc
… and in round 2 and 3 this is just a tiny amount of around 100 Bytes per second.
So practically no new data arrived that needed to be cached.
Network
The amount of data that was send is basically constant … around 750 Bytes per second.
Only a few MB of data have been received over those 11 minutes.
The “negative” (confusing? interesting?) observations are:
Files
Regarding the writes in round 1, still all data written goes to the RollingCache.ccc,
… but in round 1 it is a factor 40 more then in round 2 and 3.
So it seems like during round zero the sim was not able to stream all the landscape data needed … in time
… and this is why that data was streamed in the next round.
However, in absolute terms we are talking only about 3 MB which needed streaming and cache insertion, which is not much
… as the RollingCache.ccc provides 90-times more data from the local drive.
So clearly the cache reduces the network usage significantly.
Network
Why is the sim reading 3 KB/s from the servers, when it is just writing 0.1 KB/s into the RollingCache.ccc?
From a pure “data volume” perspective one might say that nobody cares about 30 Kbps,
… but it “smells” like this streamed data is essential to paint a landscape that is already fully cache.
In that case the lack of caching (or computing?) that data locally is adding “latency” and unnecessary server “dependency” (= adding unnecessary backend stress).
Given that I did (try to) disable all “Live” data features (no weather, no traffic, no chat, etc.)
… I would not have expected such “high” download rates for a fully cached landscape.
But maybe some disabled “Live” feature is not really disabled?
Or maybe the (invisible) glass cockpit of the Vision Jet is the reason?
To summerize this test:
The RollingCache.ccc does deliver, as promised, a dramatic reduction in necessary network traffic
… when it comes to landscape information (ground textures, 3D meshes, etc.).
However, based purely on an educated guess (as I do not know the code),
… it feels like the sim does not cache responses to landscape related queries
… like “which texture ID at this LOD should I display for that GPS location”?
This would explain why we see 20 times more data read from the network then written to the RollingCache.ccc.
This does not smell like “data” but rather like “data about data” (query results).
The Process Monitor recording then showed the following network and file access results. The first image has the data for round 0 (cache warmup) and the second for round 2:
My FS2024 config remained as in all the previous tests.
Similar to the last test I first want to compare the data from the 4 different round trips.
Round 0
Round 1
Round 2
Round 3
Network - Send Bytes
2,205,740
2,501,717
838,938
695,372
Network - Received Bytes
321,821,099
284,884,657
2,565,739
19,981,048
Files - All - Read Bytes
2,373,614,906
2,548,535,279
3,282,319,517
2,492,714,947
Files - Sound - Read Bytes
521,012,880
521,012,880
900,418,196
521,012,880
Files - RC - Read Bytes
1,778,284,607
1,915,207,059
2,295,163,152
1,921,592,853
Files - All - Write Bytes
1,096,984,755
1,084,647,114
551,667
18,077,890
Files - RC - Write Bytes
1,096,980,019
1,084,644,155
547,147
18,074,177
On average (per second) over a 724 second flight the above translates to:
Round 0
Round 1
Round 2
Round 3
Network - Send Bytes/s
3,046
3,455
1,158
960
Network - Received Bytes/s
444,504
393,487
3,543
27,598
Files - RC - Read Bytes
2,456,194
2,645,313
3,170,114
2,654,133
Files - RC - Write Bytes
1,515,165
1,498,127
755
24,964
For the analysis we now also have a baseline from the previous 3,600 ft test. Some aspects are identical to the 3,600 ft test:
Files
All data written goes into the RollingCache.ccc.
Almost all data read comes either from the RollingCache.ccc or a local sound package.
The major differences to the 3,600 ft test are:
Files
The amount of data read from the RollingCache.ccc is
around 700 to 900 KB/s … at 3,600 ft
around 2,500 to 3,200 KB/s … at “low altitude” … so a factor 3 more.
In “low altitude” there have been a lot less bytes read from the sound packages … a factor 2 to 3 difference.
Network
At low altitude it required flying the same path more than two times
… before all data was streamed to the RollingCache.ccc.
Round 3 has reached almost the same level of bytes send as the “3,600 ft” tests.
So this suggests that most data, that needed to be cached, actually was downloaded by now.
Looking just at this “low altitude” test, the positive observations are:
Files
All data written goes to the RollingCache.ccc
But why was 3 times more data written then downloaded?
Perhaps the rolling cache stores data in a preprocessed format?
This actually could be very good news.
If, and that is again a pure guess, if RollingCache.ccc uses the native in-memory sim engine data encoding, then bringing back data from the cache would be way faster, then the initial decoding of the streamed data.
However, “Network Bytes” are usually counting compressed data streams.
So maybe it just means that RollingCache.ccc data is simply uncompressed … and not preprocessed?
That would then be bad news, as it would mainly mean wasted disk capacity.
Network
A higher LOD demand, due to lower altitude, requires more frequent updates of the landscape
… and so naturally the volume of data send and received will go up.
Here we see consistently a factor of around 4 to 5.
Round 0
Almost all downloaded data comes from “static” data servers (CDN).
This should be the high LOD ground textures and 3D mesh data, etc. So this is expected.
The “negative” (confusing? interesting?) observations are:
Files
Round 1
We can see the same large amount of writes as in round 0 … a total of 1 GB.
This is an indicator, that a lot of landscape data was still not streamed in round 0.
This would point to slow or overloaded backend servers (API or CDN).
Round 2
Read bytes did go up by around 0.5 GB … which is very interesting
… as this goes hand in hand with a doubling of sound data read from disk
… and a radical reduction of bytes that needed to be written to disk.
In the “3,600 ft” test the demand for sound data was even higher
… however, the total sum of bytes read form files was practically identical … 2.5 MB/s.
So what could this all mean?
Maybe, and this is a big “maybe”, this is a hint that the FS2024 sim uses an IO subsystem which is “priority and throughput” aware.
If true, then that would be very good news for FS2024.
Think of it as an “auto LOD” feature, but just for file IO operations.
However, why are we seeing the same disk read of 2.5 MB/s … even when in each round new data gets streamed.
One might expect that with more data streamed for a certain region, more data would be read from cache on later rounds.
This could either be a “bug” or a “feature”, depending on that is really going on inside the sim. Hard to guess from the outside, and hard to explain in a few words.
Network
Round 1
Almost identical data volumes as in round 0.
So there was still a lot of ground data that was not streamed, due to high latency of the request.
On average we can see a download of 400 KB/s (4 Mbps).
Round 2
The download of static data is reduced almost by a factor of 100.
So basically no new data for the cache did arrive in this round.
However, the send bytes are still higher then in round 3,
… and so this indicates that the servers have been asked, but did not deliver (in time) what was requested by the sim.
Round 3
The amount of downloaded static data went up by a factor 10 again
… and so the reduction in round 2 most like was due to (too?) high latency of the backend (API or CDN) servers.
Even after round zero to 2 there was still a small amount of data that was missing in the cache.
To summerize this test:
Many observations of the previous “3,600 ft” test also apply to this “low altitude” test.
Multiple low altitude flights are needed to really stream all the data for a region.
This indicates that the backend (API or CDN) most likely is not “fast enough” yet.
The 11 minute low altitude flight needed about 1 GB of additional landscape downloads
… and on average 3-times more data was read from the RollingCache.ccc per second.
Some recorded events are hard to interpret and it could either be the result of “bugs” or “features”.
Maybe, and this is a big “maybe”, the FS2024 sim uses an IO subsystem, which is “priority and throughput” aware. Maybe.
My assumption is that during round 2 the servers failed to deliver the necessary data … this is why you see more send data in round 2 then in 3. But the received bytes are bigger in round 3 … which is why I would guess that this shows, that the servers were more responsive in round 3 and the data finally arrived.
But always remember, I am just a goose trying to read the tea leaves. I would never rule out that I have no idea what I am really looking at.
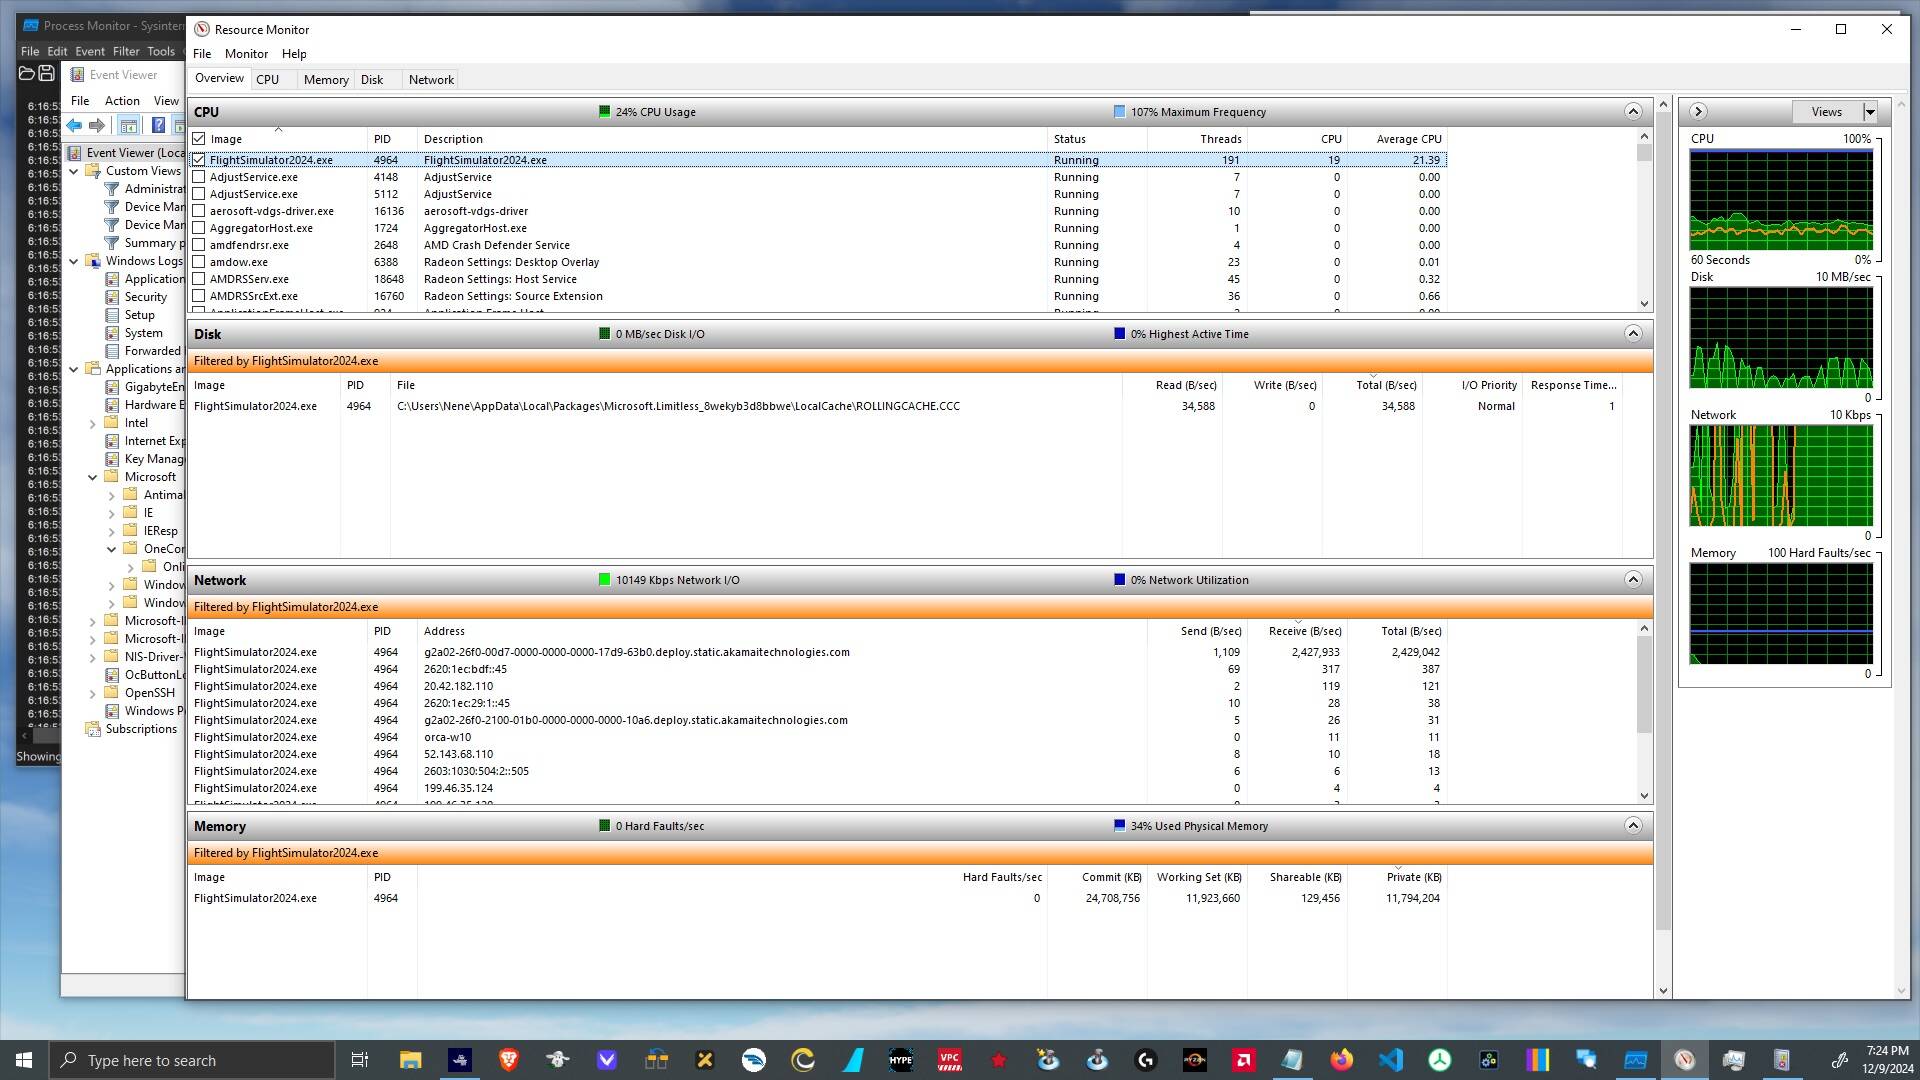
The Process Monitor recording then showed the following network and file access results. The first image has data after the config and the second from after a full inspection:
If you did this test more than once, I assume the 2nd or 3rd time at the same airport and gate, most of the data for the plane and airport would then be cached. If you then loaded the same plane in to a different airport, most of the new data would be for the new airport, which would give an indication of how much data an airport is requiring (depending on how much you look around?)
What I noted today, that I found odd, is that nearly all of my few free flights I’ve done with 2024 have originated at the same airport.
Why, then, do I still see the buildings pop-in when clicking the Start Flight button on the World Map when it switches to an overhead view? I see this on the first flight of a fresh sim session (aka fresh launch of sim).
Shouldn’t all that be cached already and then some?
And it is a good idea to “try” to find out how the airport data is structured … even when there will be a lot of variation.
But for that I guess I will wait until the “install” feature is available, as I think it might be interesting to get an “order of magnitude” feeling for:
the total since of a complex airport (= install)
the “normal” amount of stream or cache data if one simply moves around an airport just a little (like a normal “gate to taxi to takeoff and back” roundtrip)
What I suspect, from some of those recordings, is that:
FS2024 does not yet cache the “asset ID query results” … as I would call them.
What I think I can see is:
A) For each GPS location and “LOD target” they need to get a list with the IDs of the assets which need to be shown.
… those are the Azure “API” servers (I think).
This part is new, as in FS2020 it could be computed locally (during that very long launch process?) from the stored files.
B) Once they have the IDs for all the static data, then they do:
B1) … check if the data is already in VRAM or RAM
B2) … or if they at least have it locally … as a dedicated install, or in the RollingCache.ccc
B3) … and if all that fails they good to the “static” Akamai “CDN” servers
My recordings seem to show that the (A) PI server communication sometimes is under too much stress … resulting in high (roundtrip) latency … and it will take a long time to actually find the proper asset IDs … even when they are cached.
If that is the case, and they have the code so it is easy to check, then one easy solution would be to also cache the API responses locally. After all … they are also “more or less” static data. At least for a certain period of time “and” for a certain user.
Something like that could take a lot of stress of their servers.
The user part is important. Depending on what a user did buy they will see different content. I am pretty sure that they use “regular” databases for that … and not the CDN. (OK … in theory a CDN could be used too, but it is unlikely and I will skip the details to not make this too long).
So if (A) requires a database, then I think it is also somewhat easier to understand why that might not scale too “nicely”. Even distributed database do not scale as one might hope (skipping the details again).
UPDATE: What I forgot to mention about, but you can find it in some of the detailed tests, is, that “streamed” packages actually do have locally “installed” files. Perhaps some of the initial assetID lookup can be performed based on those files. But the recordings still show a lot of API server requests. So the local files obviously can not provide all the necessary data.
My very rudimentary understanding of how MSFS works is that when you load in, it spins up a server instance of some kind to handle all of the various data sources for your flight (terrain, weather, atc, traffice, etc).
I’m surprised that if the goal is “thin client”, why don’t they process all (or more…) of the terrain and scenery assembly on the server with full LOD and high detail, and just stream the final image to you at 30 or 60 fps. That way, the client can dedicate itself to handling the plane. I suppose that is a heavier server load, but it would presumably be less data streamed to the client, so it might even out?
IMHO the approach which Asobo has selected provides the best (potential) tradeoff between high quality, high FPS, lots of local (community) customization etc … and … reduced data rate from the backend, reduced server complexity (no need for real time GPUs), lots of static (shared) CND delivery, etc.
Providing a more “complete” image would not only increase the data volume and increase the latency (= reduce FPS) … but injection of user specific content (my aircraft) or custom community content would be a lot harder (e.g. for proper shadow casting that would basically require 100% “game video streaming” from Asobo servers).
Streaming a landscape in the form of layered tiles at different LOD is basically what every earth mapping software does … and usually the size of the tiles is chosen carefully so that each block fits a certain number of TCP packets … and that it is neither too big or too small.
But as we all can see … so far the implementation in FS2024 has a number of “rough edges” which need a lot of polishing.
What I don’t like in the Network window is the amount of connections to several distinct IPs. This is indeed very likely still a sign of retries due to server capacity issues.
For the distinct IPs, I guess each servers has a specific role which is understandable given the scope of the game, but having too many specific roles can be problematic as startup typically requires a defined sequence and context exchanged multiple times between game and different server roles. Also a bottleneck on one or more roles can block the whole sequence as we saw on day 1.
On the dev stream, I didn’t like them only pointing out the 5xx HTTP codes as being the problem. Sure servers being unreachable is the biggest one but claiming 99% working condition with around 10% (don’t remember exactly) of 404 codes (resource not found) is not honest. Maybe some 404s can be ignored but certainly not all of them.
If anyone from MS reads this thread and since planes are apparently used for compensation, @nenenui deserves at least a free extra plane for that in-depth analysis
I also pointed out in a different topic that the graphs of HTTP status overviews, while technically correct, did paint a somewhat “misleading” picture … of a highly complex technical deployment landscape with lots of dependencies. Such a “post mortem” would not please the audience of say a “P99 CONF” crowd.
Where I would slightly disagree is the “amount of connections” part. For keep-alive connections it is fairly normal, that after some duration they need to be closed and reopened again. And it also is normal to open more then one connection to one server, e.g. in cases where latency is an issue.
But when I compare a “smooth” operation to a “low bandwidth” operation then I can see in the recordings a-typical amounts of open-close counts. Or an a-typical ration of bytes send to bytes received. There I would be confident that I am looking at a related server problem.
After all … looking at Process Monitor recordings … is just reading tea leaves. We can not see the actual content of all those messages.
I appreciate your very positive feedback very much. But if MS reads that … I do not need additional “perks” for me personally.
I am a happy goose already … and I did buy the Aviator collection anyway … even when I usually only fly a single aircraft (the Osprey is perfect for my sightseeing pleasure).
Process Monitor does indeed collect information about every file related event. And I have seen the fsarchive type of data. But usually the amount of data written or read is not significant … compared to other files like the RollingCache.ccc or the sound packages.
I also have not seen disk activity which would suggest that the sim is hitting hardware IO limits. I think it is nowhere near those limits.
Now I am no expert in Windows storage drivers and file system access scheduling etc. So as always … my “educated guess” might be completely wrong. But an average for 4 MB/s (40 Mbps) … is far away from SATA III and 6000 Mbps (phy layer) by two orders of magnitude. That is a lot of headroom for system layer inefficiency.
As I pointed out in a posting above … it feels to me like the local cache is limited by remote API server latency. I really hope that it is not the local cache index system (but that is invisible from the outside).
I will try to post that really interesting “ground texture cache hickup” from yesterday soon. I found it very insightful. (… insert cliff hanger here …)
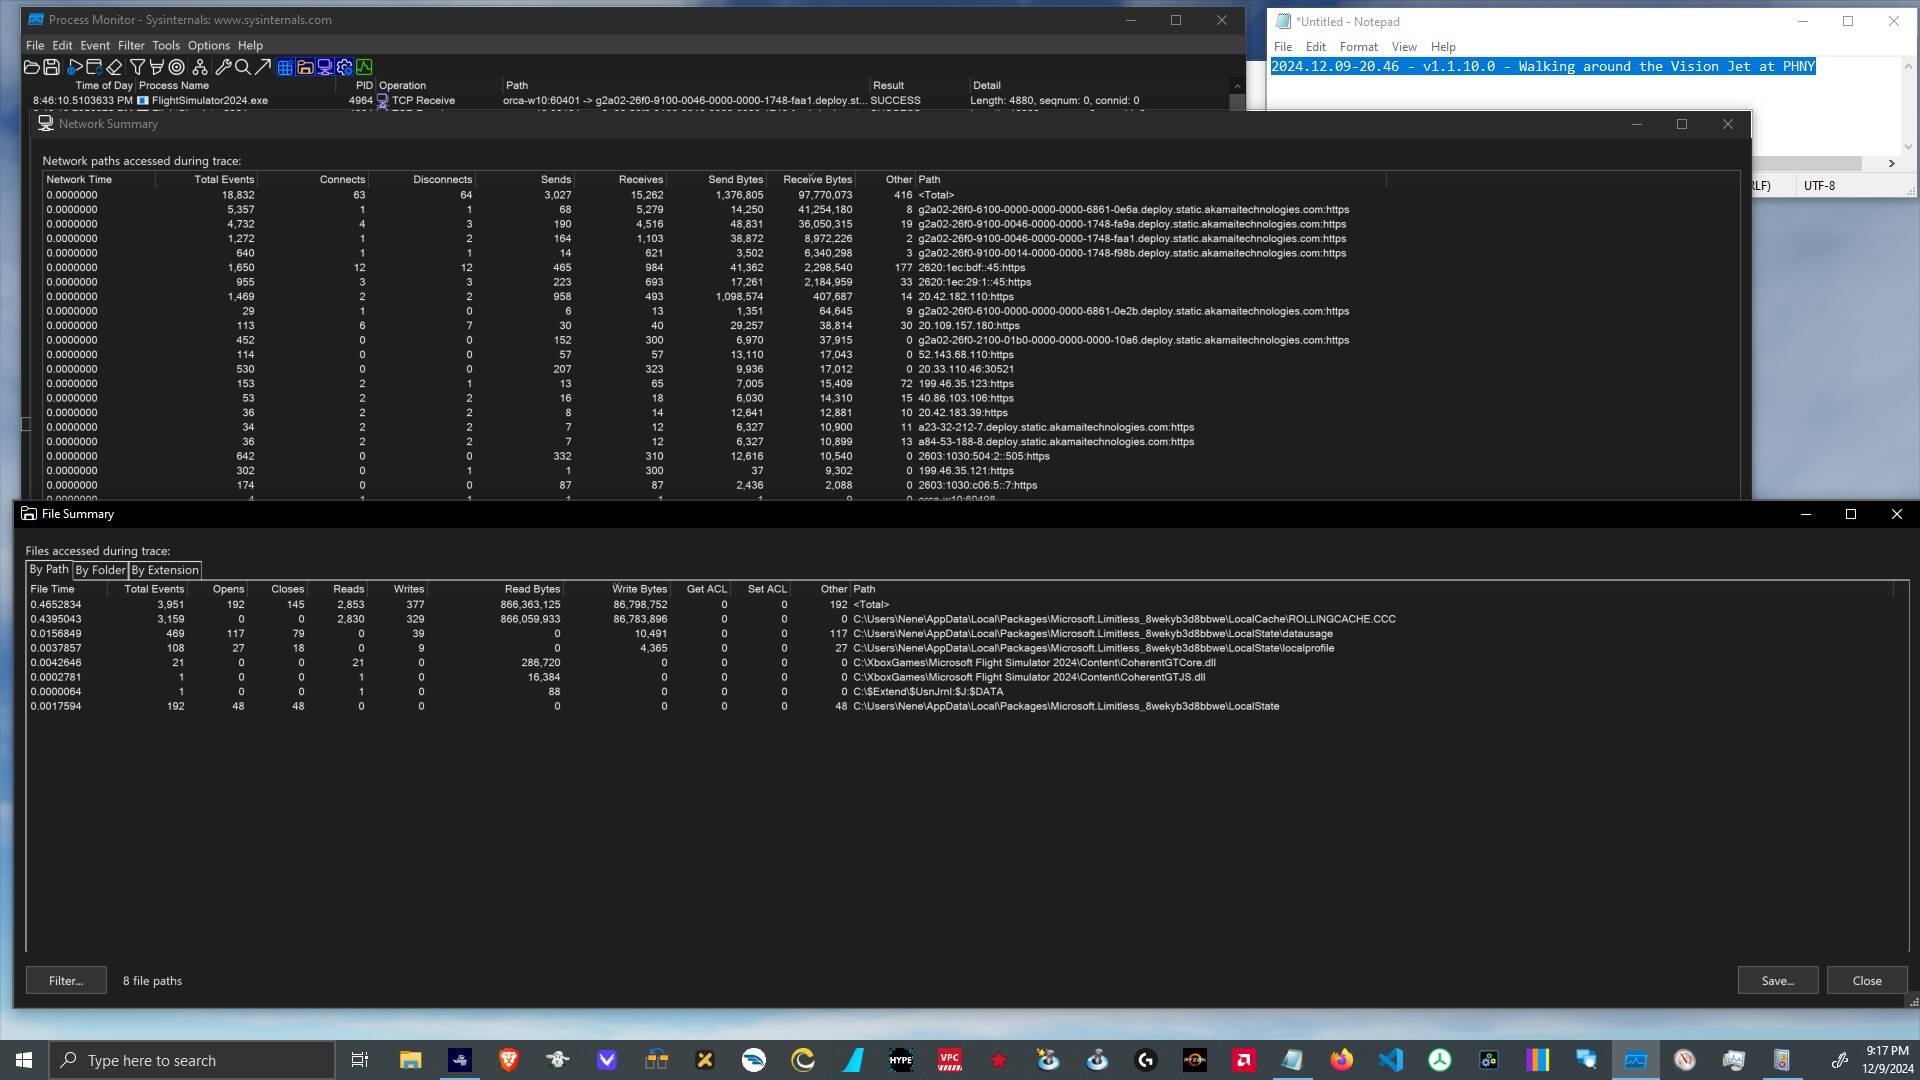
2024.12.09-20.46 - v1.1.10.0 - Walking around the Vision Jet at PHNY
While getting ready for a flight I noticed in the “Select aircraft” UI that the servers seem to be very slow again (e.g. thumbnails for liveries have been missing). So I figured it might be a good time for some more testing. Sadly I lost a very long Process Monitor recording, because that app did crash (too much data?). So what I cannot show is:
The problems of streaming an aircraft which I have used almost all the times.
Why was that data no longer in the RollingCache.ccc?
Was there an upgrade of the Vision Jet package? … I see v1.8.0 now. Not sure if the cached version was older.
Why does FS2024 not read the recorded state of the Vision Jet? … I always need to pick my livery again and again.
Was this because I looked at the Boeing 787 Max before? … so is the aircraft cache limited to 2 GB?
Lots of related interesting questions … but I have no recordings related to this.
So … by accident … what I could witness instead was a perfect “ground tile LOD mystery” event. This is related to a message I left here in the forum:
For the purpose of this story I will use the following, totally made up, LOD definitions:
LOD-1 … lowest level of detail (IMHO this is way below “Low” grade).
LOD-10 … highest level of detail (call it “Ultra” grade).
My FS2024 config remained as in all the previous tests. Here I mainly want to stress:
RollingCache.ccc is at 256 GB.
Graphics settings include:
“Off Screen Terrain Pre-Caching” = Ultra
“Dynamic Settings” = OFF … so no “Framerate Target”
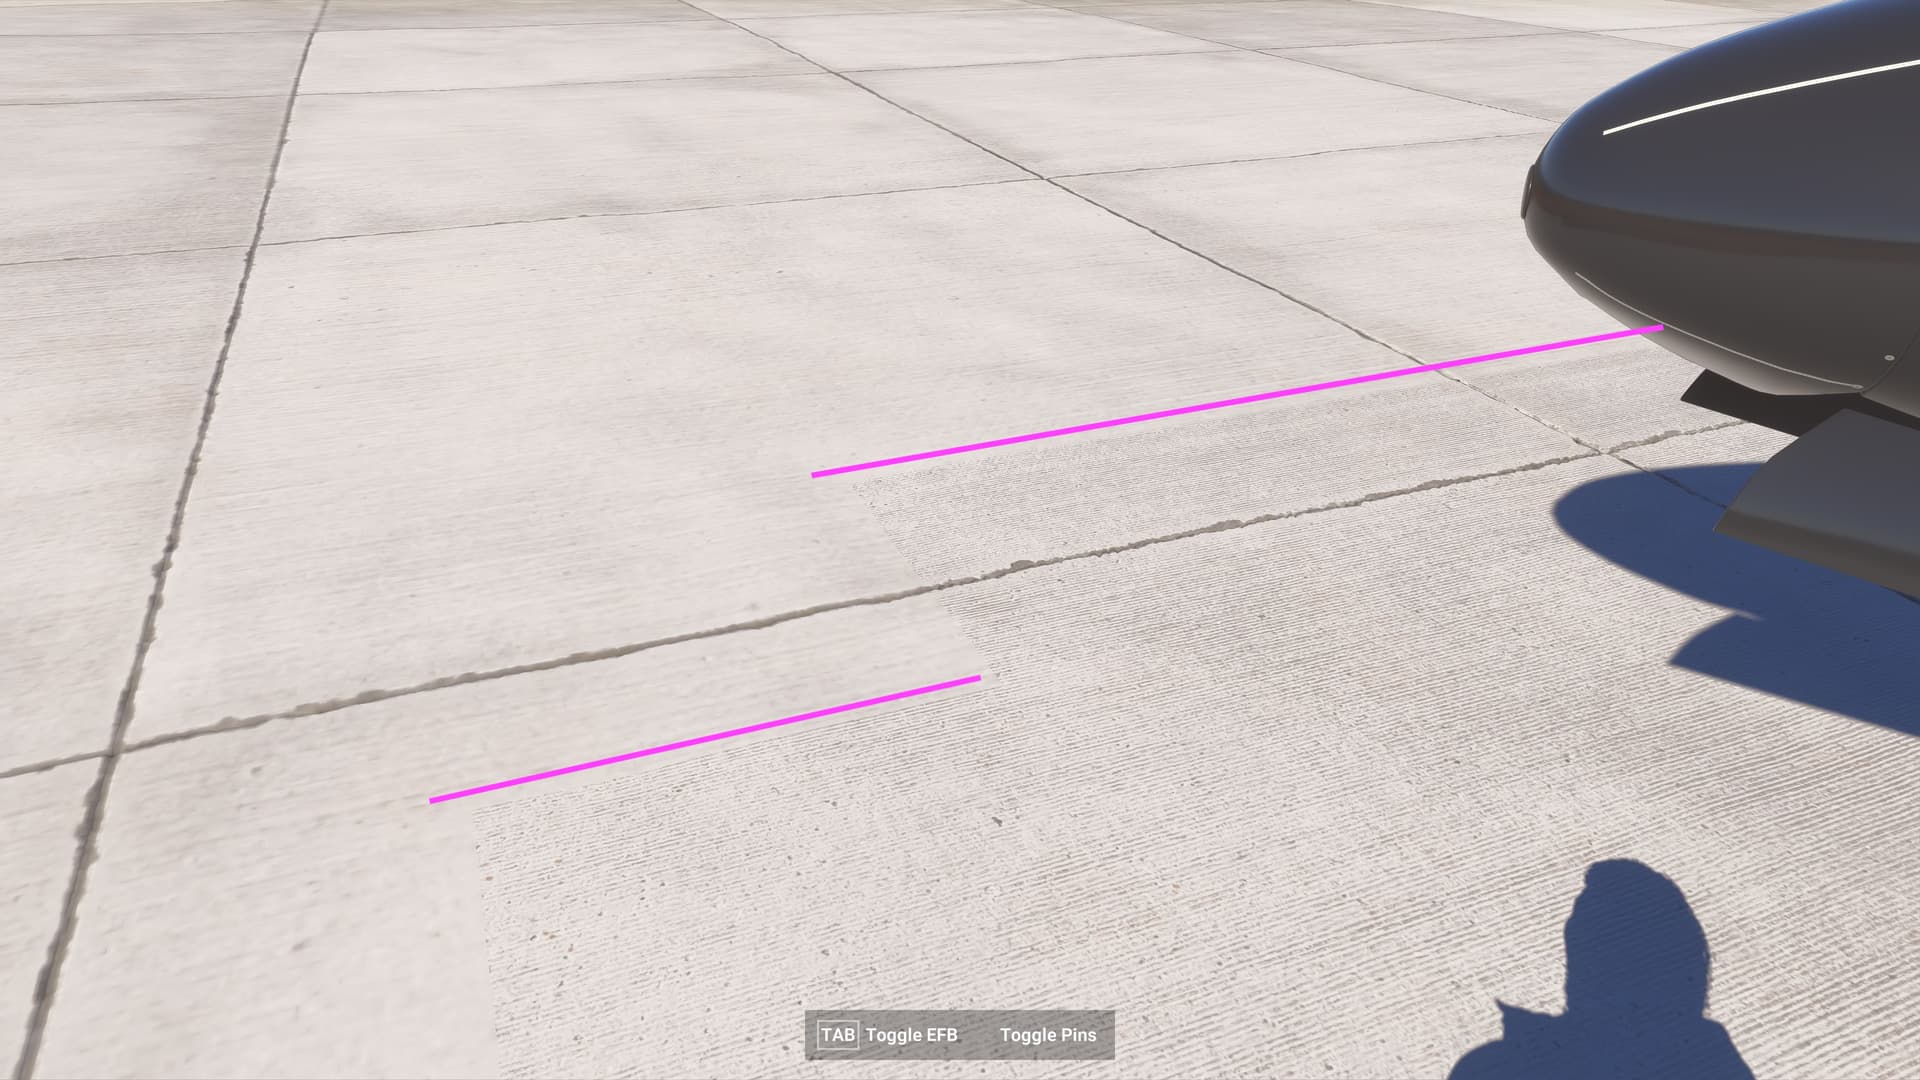
Ground tile LOD mystery timeline
18.30
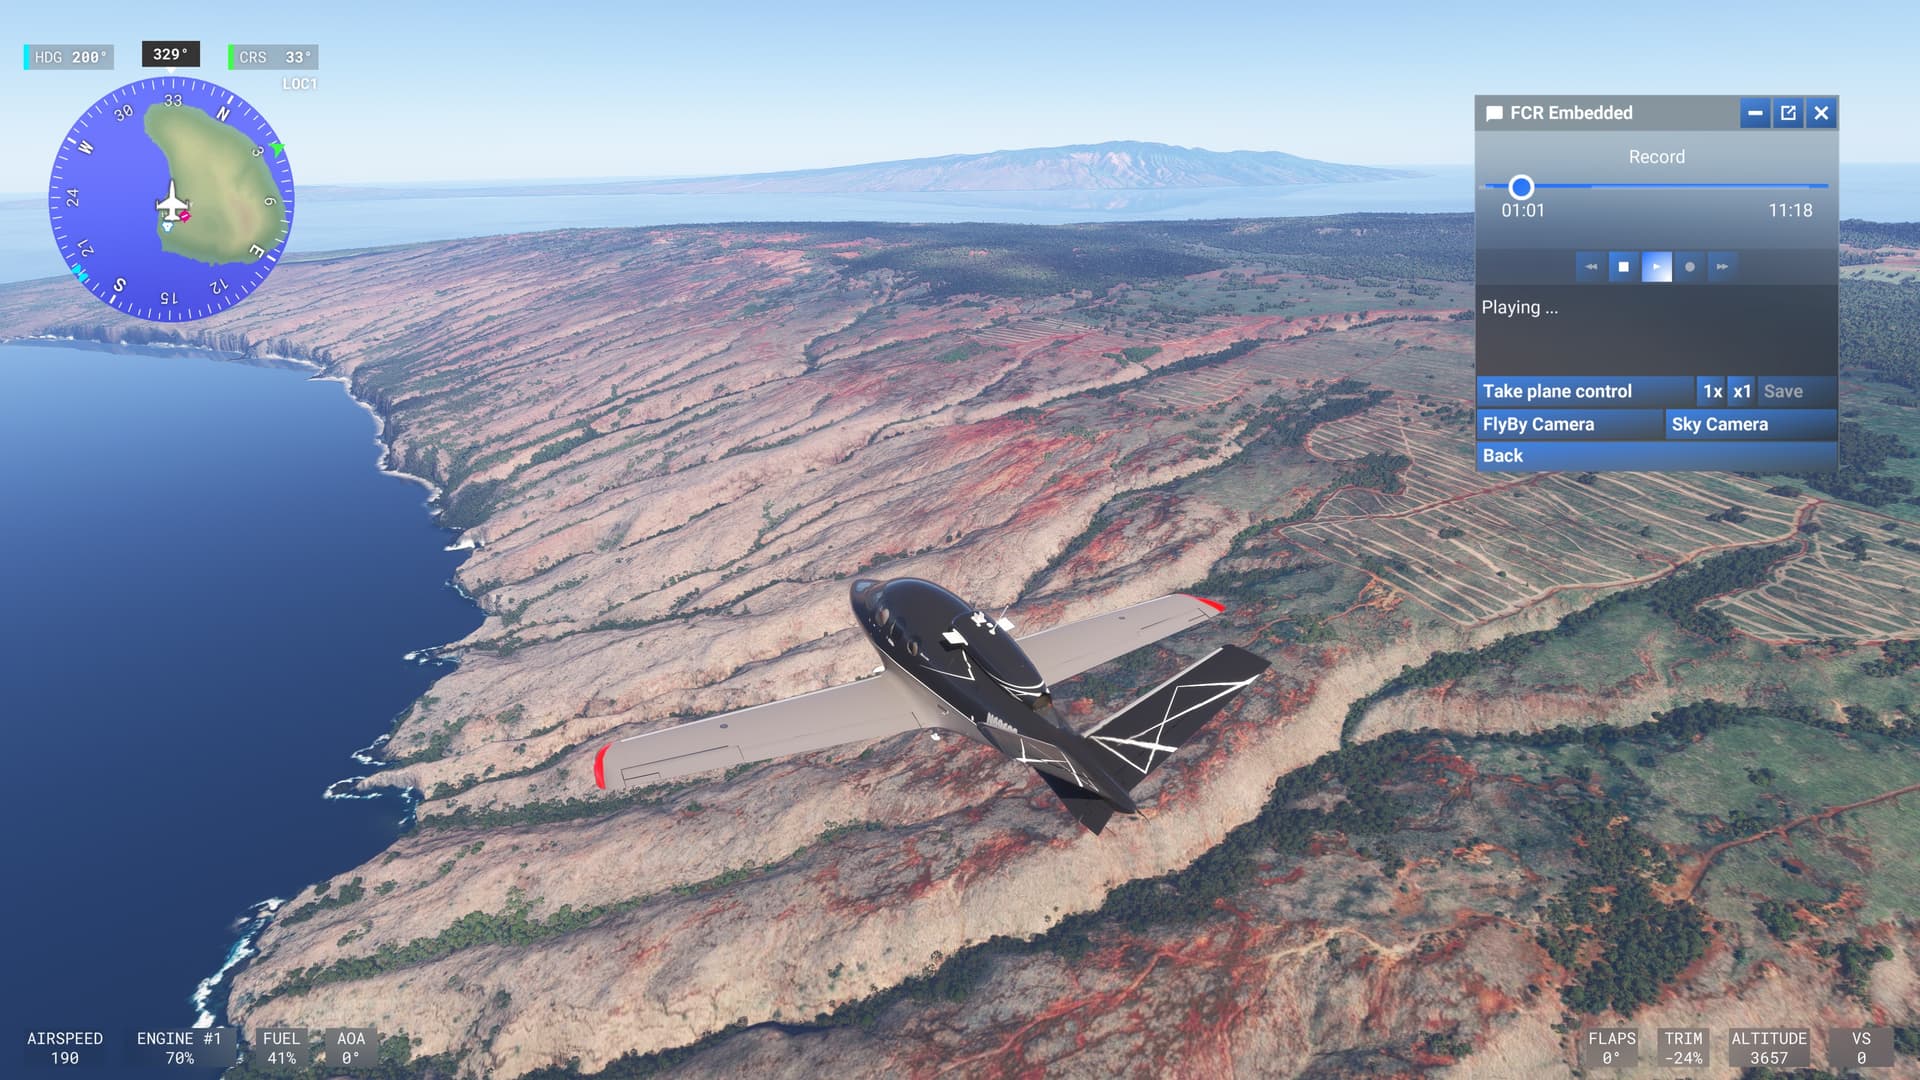
“Start flight” with the Vision Jet at PHNY Lana’i
In the last days I have performed all my flights around this island (see the previous tests).
With a RollingCache.ccc of 256 GB I was expecting that every landscape data would already be in the cache.
18.32
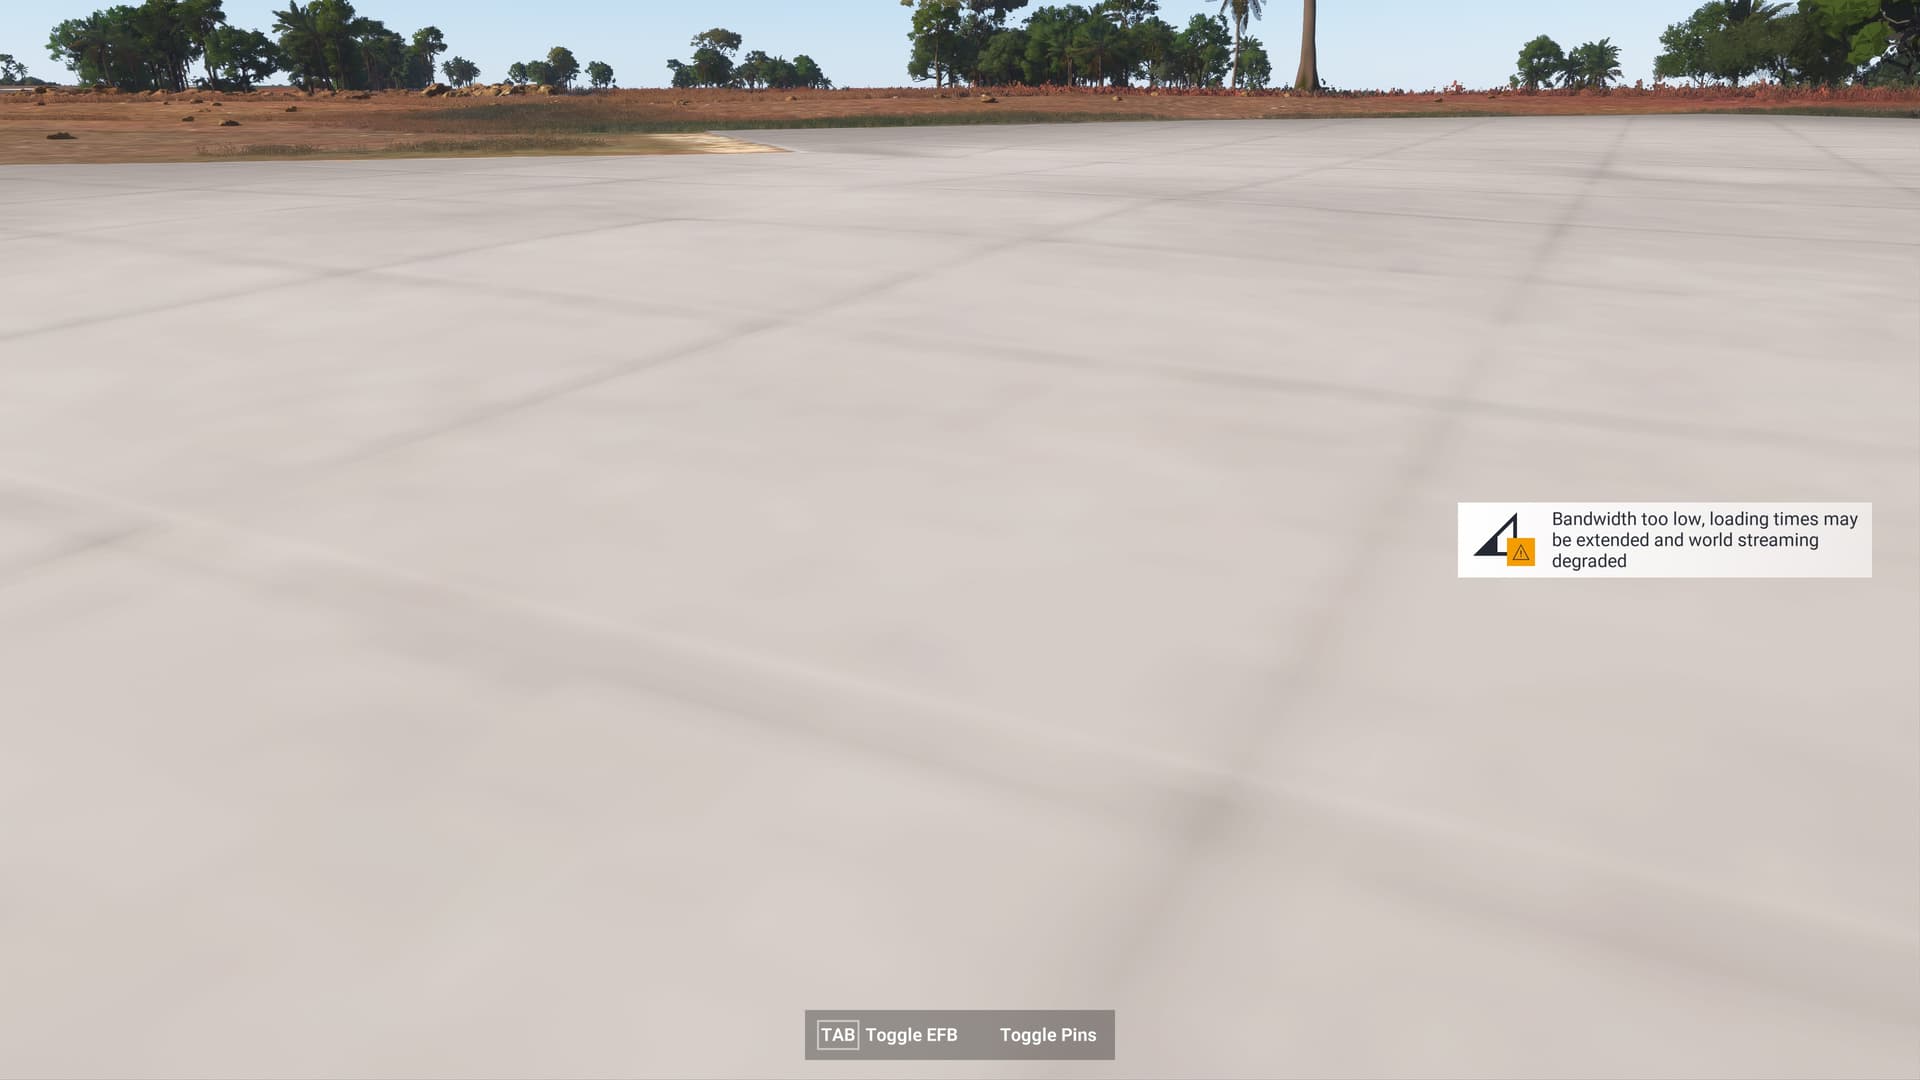
First “Bandwidth too low” warning … matches what I can see.
Even right under the feet of my avatar it looks like LOD-1 ground material.
On my favorite airport, where everything should be in the cache by now,
… even after 2 hours of network and CDN activity
… not even the basic ground tiles are present.
But most interestingly … some ultra LOD-10 ground content basically “went missing” while watching it.
None of this can be explained by poor CDN performance or a too small Rolling Cache.ccc. Those issues are clearly inside some other parts of the data lookup, data caching and post-processing pipeline.
Related ProcMon recordings
As I already mentioned at the beginning. Due to a crash of the Process Monitor I lost the related full recording. But I started another recording session at 20.46 which produced this result at 21.17 … so it contains the data of around 30 minutes:
Why we don’t have a detailed description how it works from Asobo? And not from one of the smiling “dev stream” faces but mademoiselle who really programmed it?