For Flight Analysts - The Plot Thickens
In the first tutorial of this series we have seen the basic steps how to connect a databbase browser such as SQLiteBrowser with the logbook. In a previous tutorial we have learnt how to create new flights from scratch, by inserting them via SQL.
In this tutorial we are looking at how to analyse - to select - existing flights and do some “data mining”.
Export Plugins
Before we begin: Sky Dolly already provides many export plugins, for various formats such as GeoJSON and KML. Specifically when exporting your flights in CSV (comma-separated values) you get your flight data in a text-based format that can be imported and processed with many applications, including spreadsheet editors such as Excel and LibreOffice Calc.
Sky Dolly supports the following CSV flavours:
- Sky Dolly: the complete flight data, but soon to be deprecated and replaced by a much more powerful export format
- FlightRadar24: the CSV format as used by flightradar24.com - essentially containing aircraft position, heading and speed
- Position and attitude: essentially like the FlightRadar24 format, but including pitch and bank angles
But what if you wanted more data? To do some basic data aggregation and calcuations before exporting? What if none of the export formats provides the data that you are looking for?
Enter the power of SQL and the open logbook format of Sky Dolly…
Data-Mining Your Logbook
At this point we assume that you have already established a connection with your logbook (= the database). If you are unsure have a look at the first tutorial in this series.
Hint: When trying to open a logbook don’t forget to change the file selection dialog filter to All Files (*).
In the following examples we will be using SQLiteBrowser, but any similar SQLite database editor will do, including the SQLite command shell itself, at least as far as the SQL queries themselves are concerned.
Selecting a Flight
All following queries usually involve selecting some given flight from the logbook.
Remember:
- The flight table contains basic flight information such as flight conditions and start- and end times (of the first recorded aircraft) as well as the sequence number of the user aircraft
- The aircraft table contains basic aircraft information and the sequence number of each aircraft: a flight may have multiple aircraft (“formation flight”), but always at least one.
- Finally the position table contains the recorded coordinates, velocity and attitude (*), including a timestamp (in milliseconds). Each position sample belongs to an aircraft.
There exists other tables such as engine, primary_flight_controls and others: they are on the same hierarchy level as the position table and essentially work the same.
(*) This is subject to change in some future Sky Dolly release, but the idea will remain the same
All this leads us without further ado to your first “select flight” queries. The most easiest query is simply selecting a flight by its given ID:
-- Get specific flight given by its ID
select f.id, f.creation_time, f.title
from flight f
where f.id = 63
where the value 63 needs to be replaced by an existing flight ID. In fact, the logbook in Sky Dolly shows the flight IDs, making it super-simple to select the desired flight data:
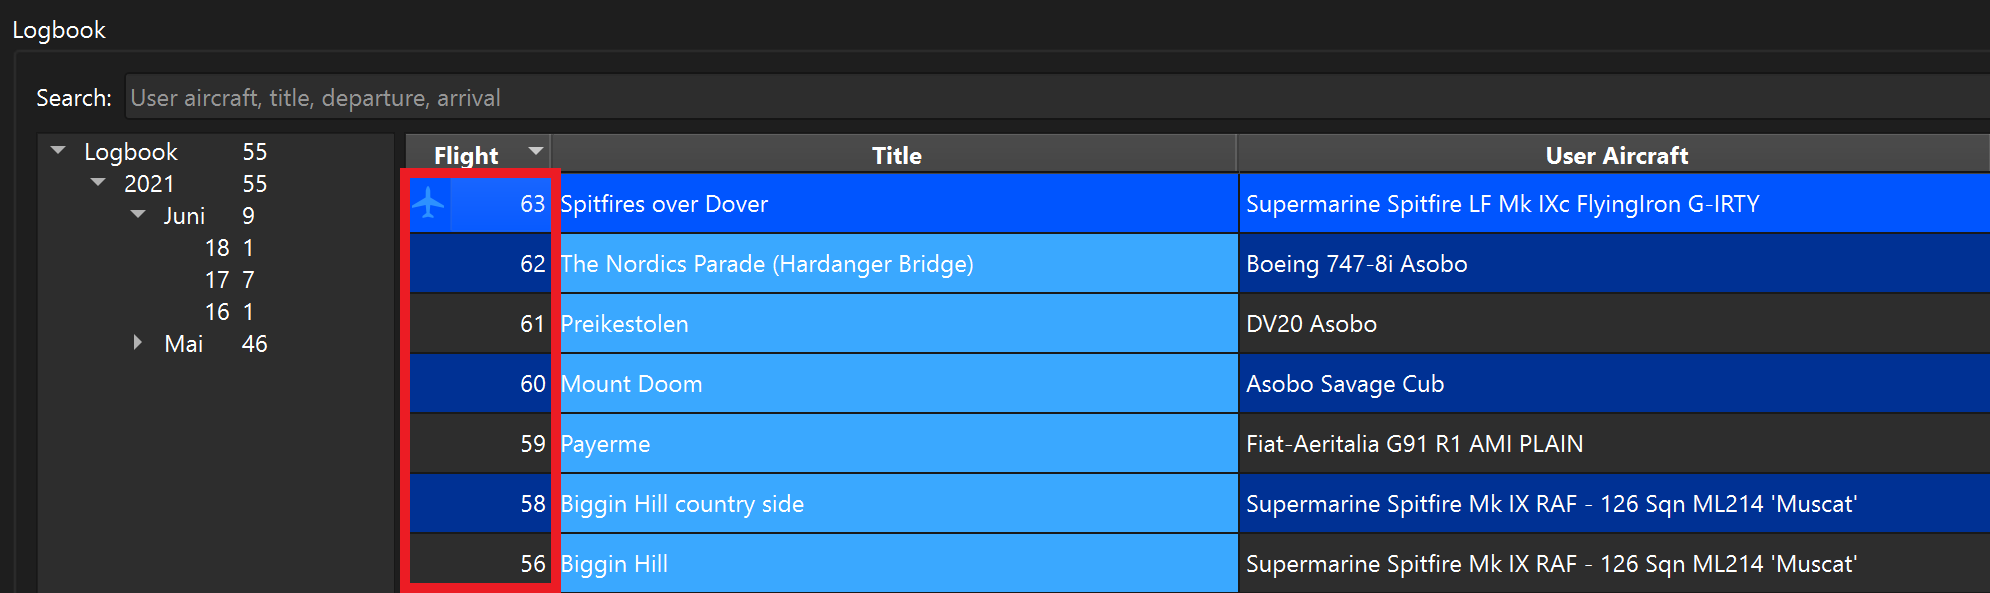
We can also query a flight recorded on a given date:
-- Get latest flight on a given date
select f.id, f.creation_time, f.title
from flight f
where strftime('%Y-%m-%d', f.creation_time) = '2021-05-26'
order by f.creation_time desc
limit 1
Here we make use of the SQLite-specific built-in function strftime that formats the date & time into a convenient ‘YYYY-mm-dd’ text format.
As there might be multiple flights on the given date we order the result set in descending order (“order by … desc”) by creation_time and limit the result set to 1 (“limit 1”).
Of course the actual date value ‘2021-05-26’ needs to be replaced again with the desired date.
Or we might simply want to select the most recent recorded flight from the logbook:
-- Get most recent flight of the logbook
select f.id, f.creation_time, f.title
from flight f
order by f.creation_time desc
limit 1
Now that we know how to select a given flight let’s step it up a little with some more interesting queries that join the flight table with other tables…
Creating Your Custom Flight Data Query
Explaining the various SQL table join operations would go far beyond of what I can show here. However excellent tutorials about SQL do exist, for example:
The following example query shows how you can select your custom data and make it available as CSV. We will see that we can also create some basic charts easily with SQLiteBrowser itself. So fasten your seatbelts…
select f.id as flight_id,
       f.start_zulu_sim_time,
       f.end_zulu_sim_time,
       a.type,
       a.flight_number,
       p.timestamp,
       p.latitude,
       p.longitude,
       p.altitude,
       p.pitch,
       p.bank,
       p.true_heading,
       p.velocity_z * 0.5924838012959 as speed_in_knots
from   position p
join   aircraft a
on     p.aircraft_id = a.id
join   flight f
on     a.flight_id = f.id
and    a.seq_nr = 1
-- Select the above data from the most recent flight in the logbook
where  f.id = (select ff.id
               from flight ff
               order by creation_time desc
               limit 1)
Wow, that escalated quickly ![]() Let’s analyse what we just did here:
Let’s analyse what we just did here:
- We select the desired data columns like flight ID, aircraft type (e.g. “Asobo A320neo” etc.), position and attitude from the joined tables flight, aircraft and position
- The velocity_z contains the aircraft velocity in Z direction that corresponds to the “forward” direction, in feet / seconds. We convert it to knots, to illustrate that we can also transform the data with basic mathematical functions (*)
- We select the position data from the first (“seq_nr = 1”) aircraft in the flight
- We can also nest SQL queries: here we select the ID of the last recorded flight in the logbook (as shown before)
(*) SQlite provides a whole set of math functions: Built-In Mathematical SQL Functions
Exporting to CSV
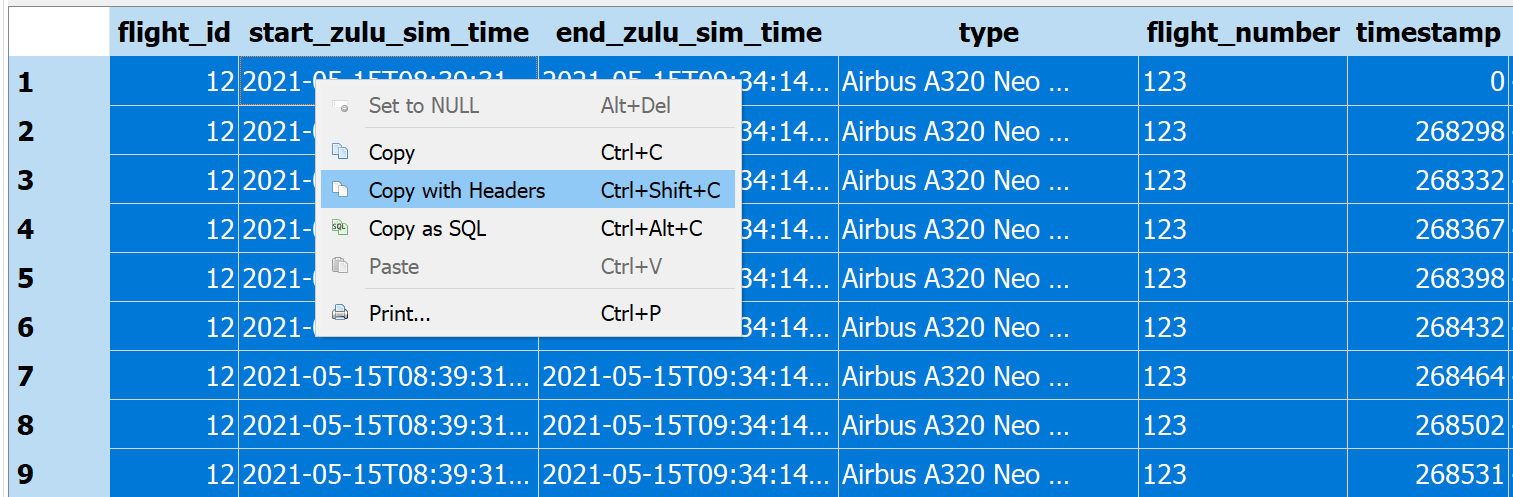
Exporting the result set of the above query - any query result for that matter - is easy with SQLiteBrowser:
- Simply select all result rows (CTRL + A) and
- Select Copy with Headers
Now open your favourite text editor and create a new text file. In this example I use Visual Studio Code, as it provides a wast amount of plugins, including editing CSV data in table format and even visualising GPS coordinates (in CSV format) on a world map.
Now paste (CTRL + V) the previously copied data and save your newly created text file with the *.CSV file extension. Depending on your editor and installed extension plugins this might enable syntax highlighting for CSV and enable alternative edit modes such as a CSV table editor:
-
CSV syntax highlighting (Rainbow CSV):
-
CSV table editor (Edit csv)

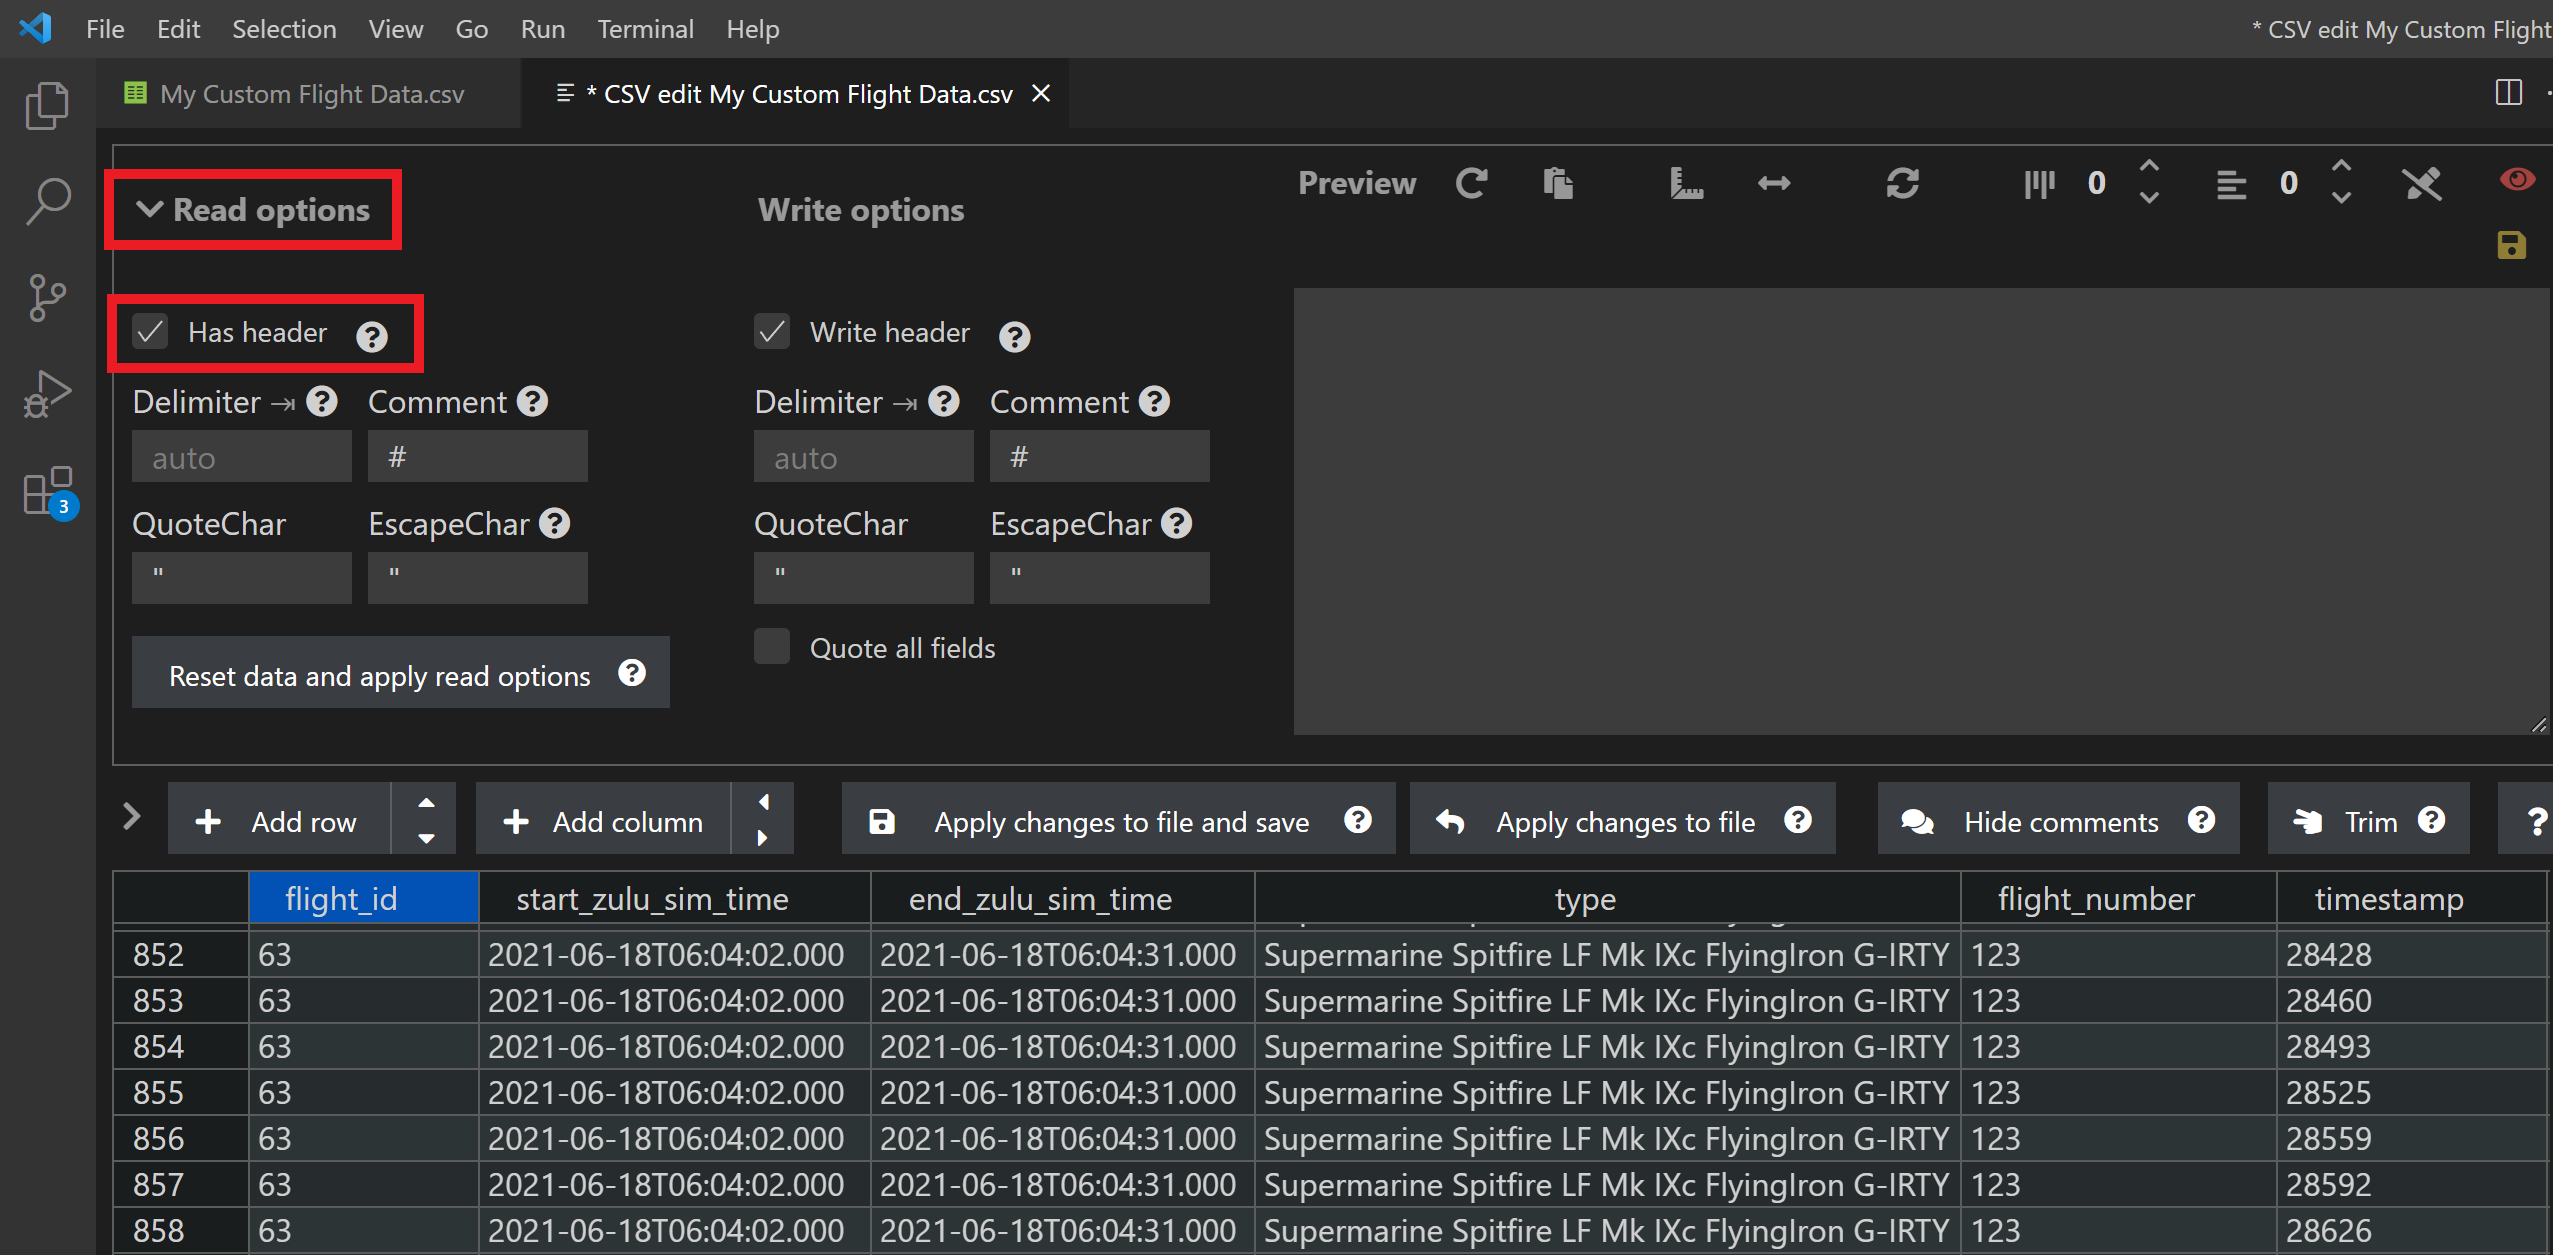
Hint: Enable the Has header read option.
- Visualise flight (Geo Data Viewer)

Visualising Data
Even with SQLiteBrowser we can already create some basic charts. But let’s have a look at some more queries first in order to gather some interesting data to visualise.
Flight Statistics
The following query evaluates our top 10 favourite aircraft types, according to their number of flights:
-- Select the top 10 aircraft types (number of flights)
select type        as AircraftType,
       count(type) as Count
from   aircraft a
group by type
order by count(type) desc
limit 10
Note that we can rename colums with “as AircractType” or “as Count”, for better readability in the result set. In this query we also group result rows according to some given criteria: here we group by the aircraft type.
We are also using a so-called aggreate SQL function here for the first time, the count function. So in this example we simply count the number of used aircraft types, order the result set in descending order and limit the result set to 10 rows.
Example result:
| AircraftType | Count |
|---|---|
| Pitts Asobo | 46 |
| Asobo Savage Cub | 17 |
| Fiat-Aeritalia G91 R1 AMI PLAIN | 13 |
| Airbus A320 Neo Asobo | 12 |
| Supermarine Spitfire LF Mk IXc FlyingIron G-IRTY | 9 |
| Supermarine Spitfire Mk IX RAF - 126 Sqn ML214 ‘Muscat’ | 6 |
| Extra 330 Asobo | 6 |
| DV20 Asobo | 5 |
| Airbus A320 Neo FlyByWire | 5 |
| Boeing 747-8i Asobo | 4 |
Likewise we can create a top 10 flight list according to flight duration:
-- Select the top 10 *flights* (flight duration in minutes)
select f.id, f.title, a.type, max(p.timestamp) / 1000 / 60 as minutes
from   aircraft a
join   position p
on     p.aircraft_id = a.id
join   flight f
on     a.flight_id = f.id
group by p.aircraft_id
order by minutes desc
limit 10
Example result:
| id | title | type | minutes |
|---|---|---|---|
| 12 | Flight Zurich to Geneva | Airbus A320 Neo FlyByWire | 53 |
| 33 | New Zealand Tour (Mount Doom) | T-45C Goshawk TW-1 | 49 |
| 34 | Tokyo Drift with Crash Landing | Boeing 747-8i Asobo | 47 |
| 14 | Sion nach Samedan | Fiat-Aeritalia G91 | 38 |
| 29 | Cliffs of Dover | Supermarine Spitfire | 25 |
| 28 | Rio de Janeiro Sightseeing | Icon A5 Asobo | 22 |
| 11 | Take-Off II from Zurich with failed start | Airbus A320 Neo FlyByWire | 16 |
| 23 | Paris Arc de Triomphe (Crash) | Extra 330 Asobo | 16 |
| 10 | Take-Off from Zurich | Airbus A320 Neo FlyByWire | 15 |
| 13 | Landing in Geneva | Airbus A320 Neo FlyByWire | 12 |
By nesting the above query into the following query we can create our own top 10 aircraft type list, according to the total duration (in minutes) flown with each aircraft type:
-- Select the top 10 aircraft types (total flight time)
select a.type, sum(a.minutes) as total_minutes
from (select aa.type, max(pp.timestamp) / 1000 / 60 as minutes
      from   aircraft aa
      join   position pp
      on     pp.aircraft_id = aa.id
      group by pp.aircraft_id) a
group by a.type
order by total_minutes desc
limit 10
Example result:
| type | total_minutes |
|---|---|
| Airbus A320 Neo FlyByWire | 106 |
| Fiat-Aeritalia G91 | 84 |
| Boeing 747-8i Asobo | 65 |
| Pitts Asobo | 59 |
| T-45C Goshawk TW-1 | 49 |
| Supermarine Spitfire | 33 |
| Extra 330 Asobo | 25 |
| Icon A5 Asobo | 22 |
| Asobo Savage Cub | 22 |
| Supermarine Spitfire ‘Muscat’ | 15 |
Disclaimer: I am not affiliated with nor do I endorse any of the above aircraft types. All the presented example results are simply to be considered as some “random snapshot” of an older logbook of mine and are meant to be for illustration purposes only.
The Plot Thickens…
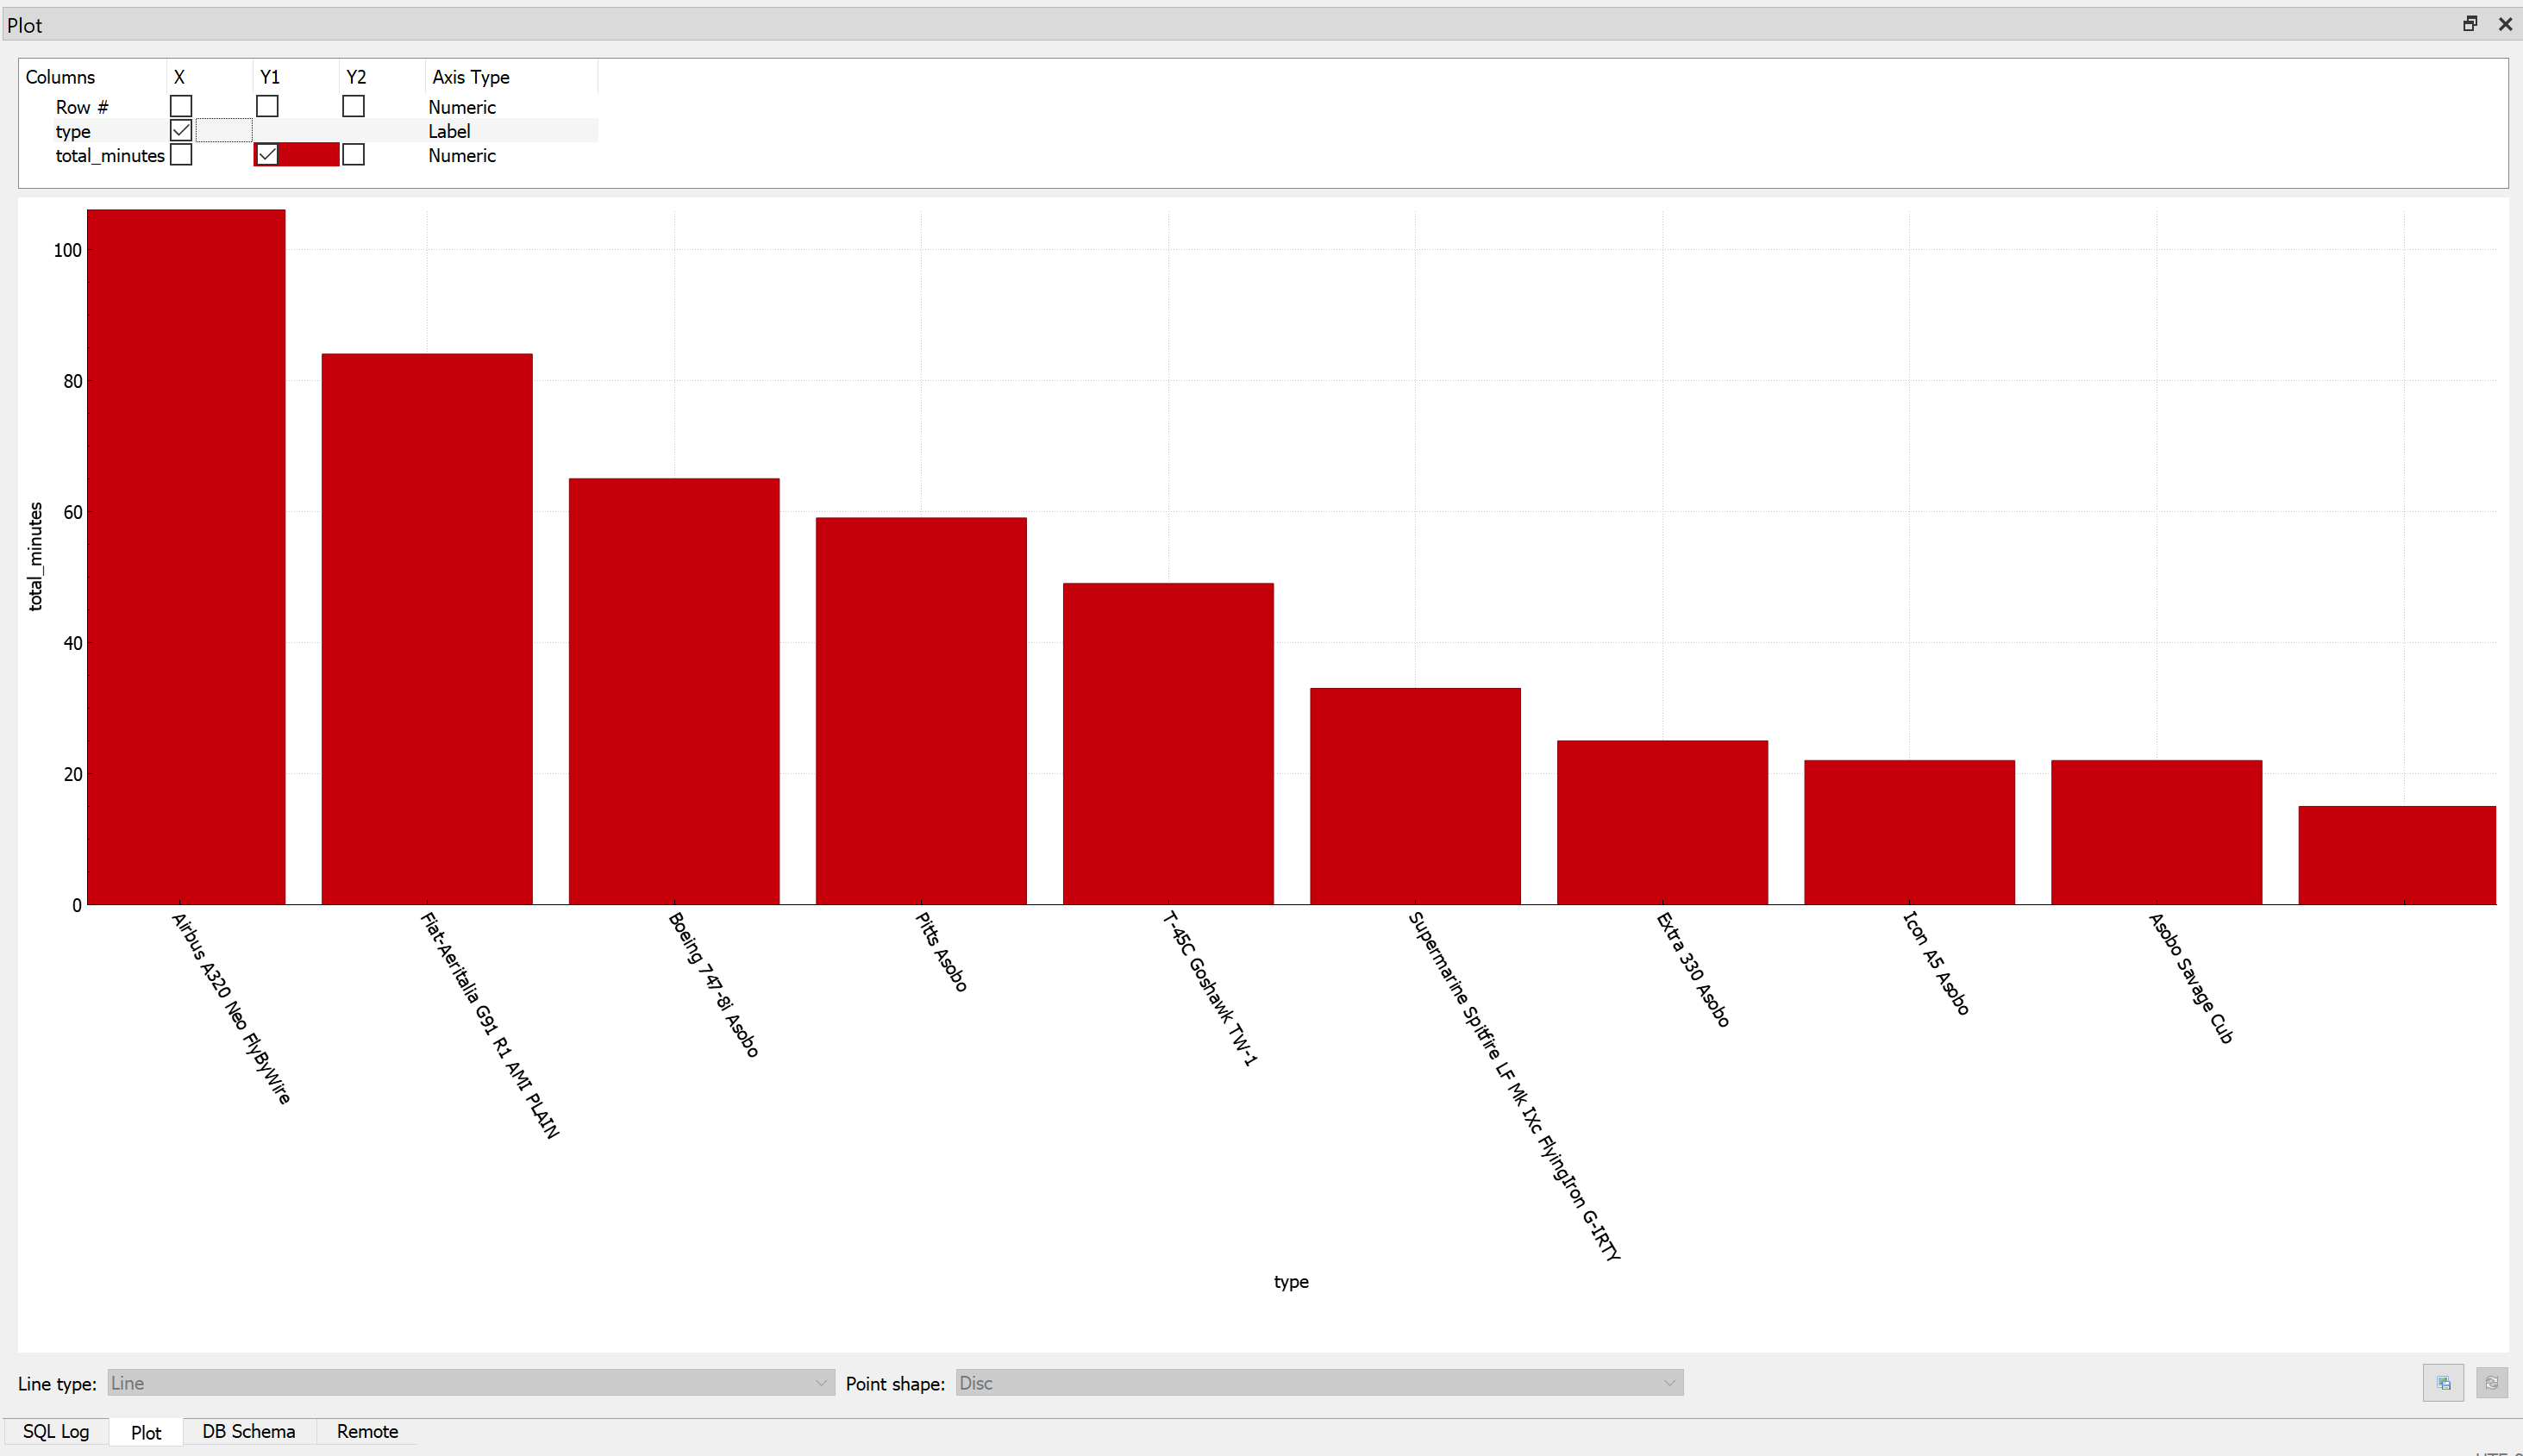
The SQLiteBrowser offers a simple Plot module that allows to visualise the current result set in an X/Y plot diagram.
We can easily visualise our previous top 10 favourite aircraft type list, by simply opening the Plot tab and selecting the desired columns for the X and Y axis, including bar chars (in case the X axis values are of type text):
Likewise we can go back to our intial custom position export example and plot the altitude (Y-axis) for each given timestamp (X-axis):
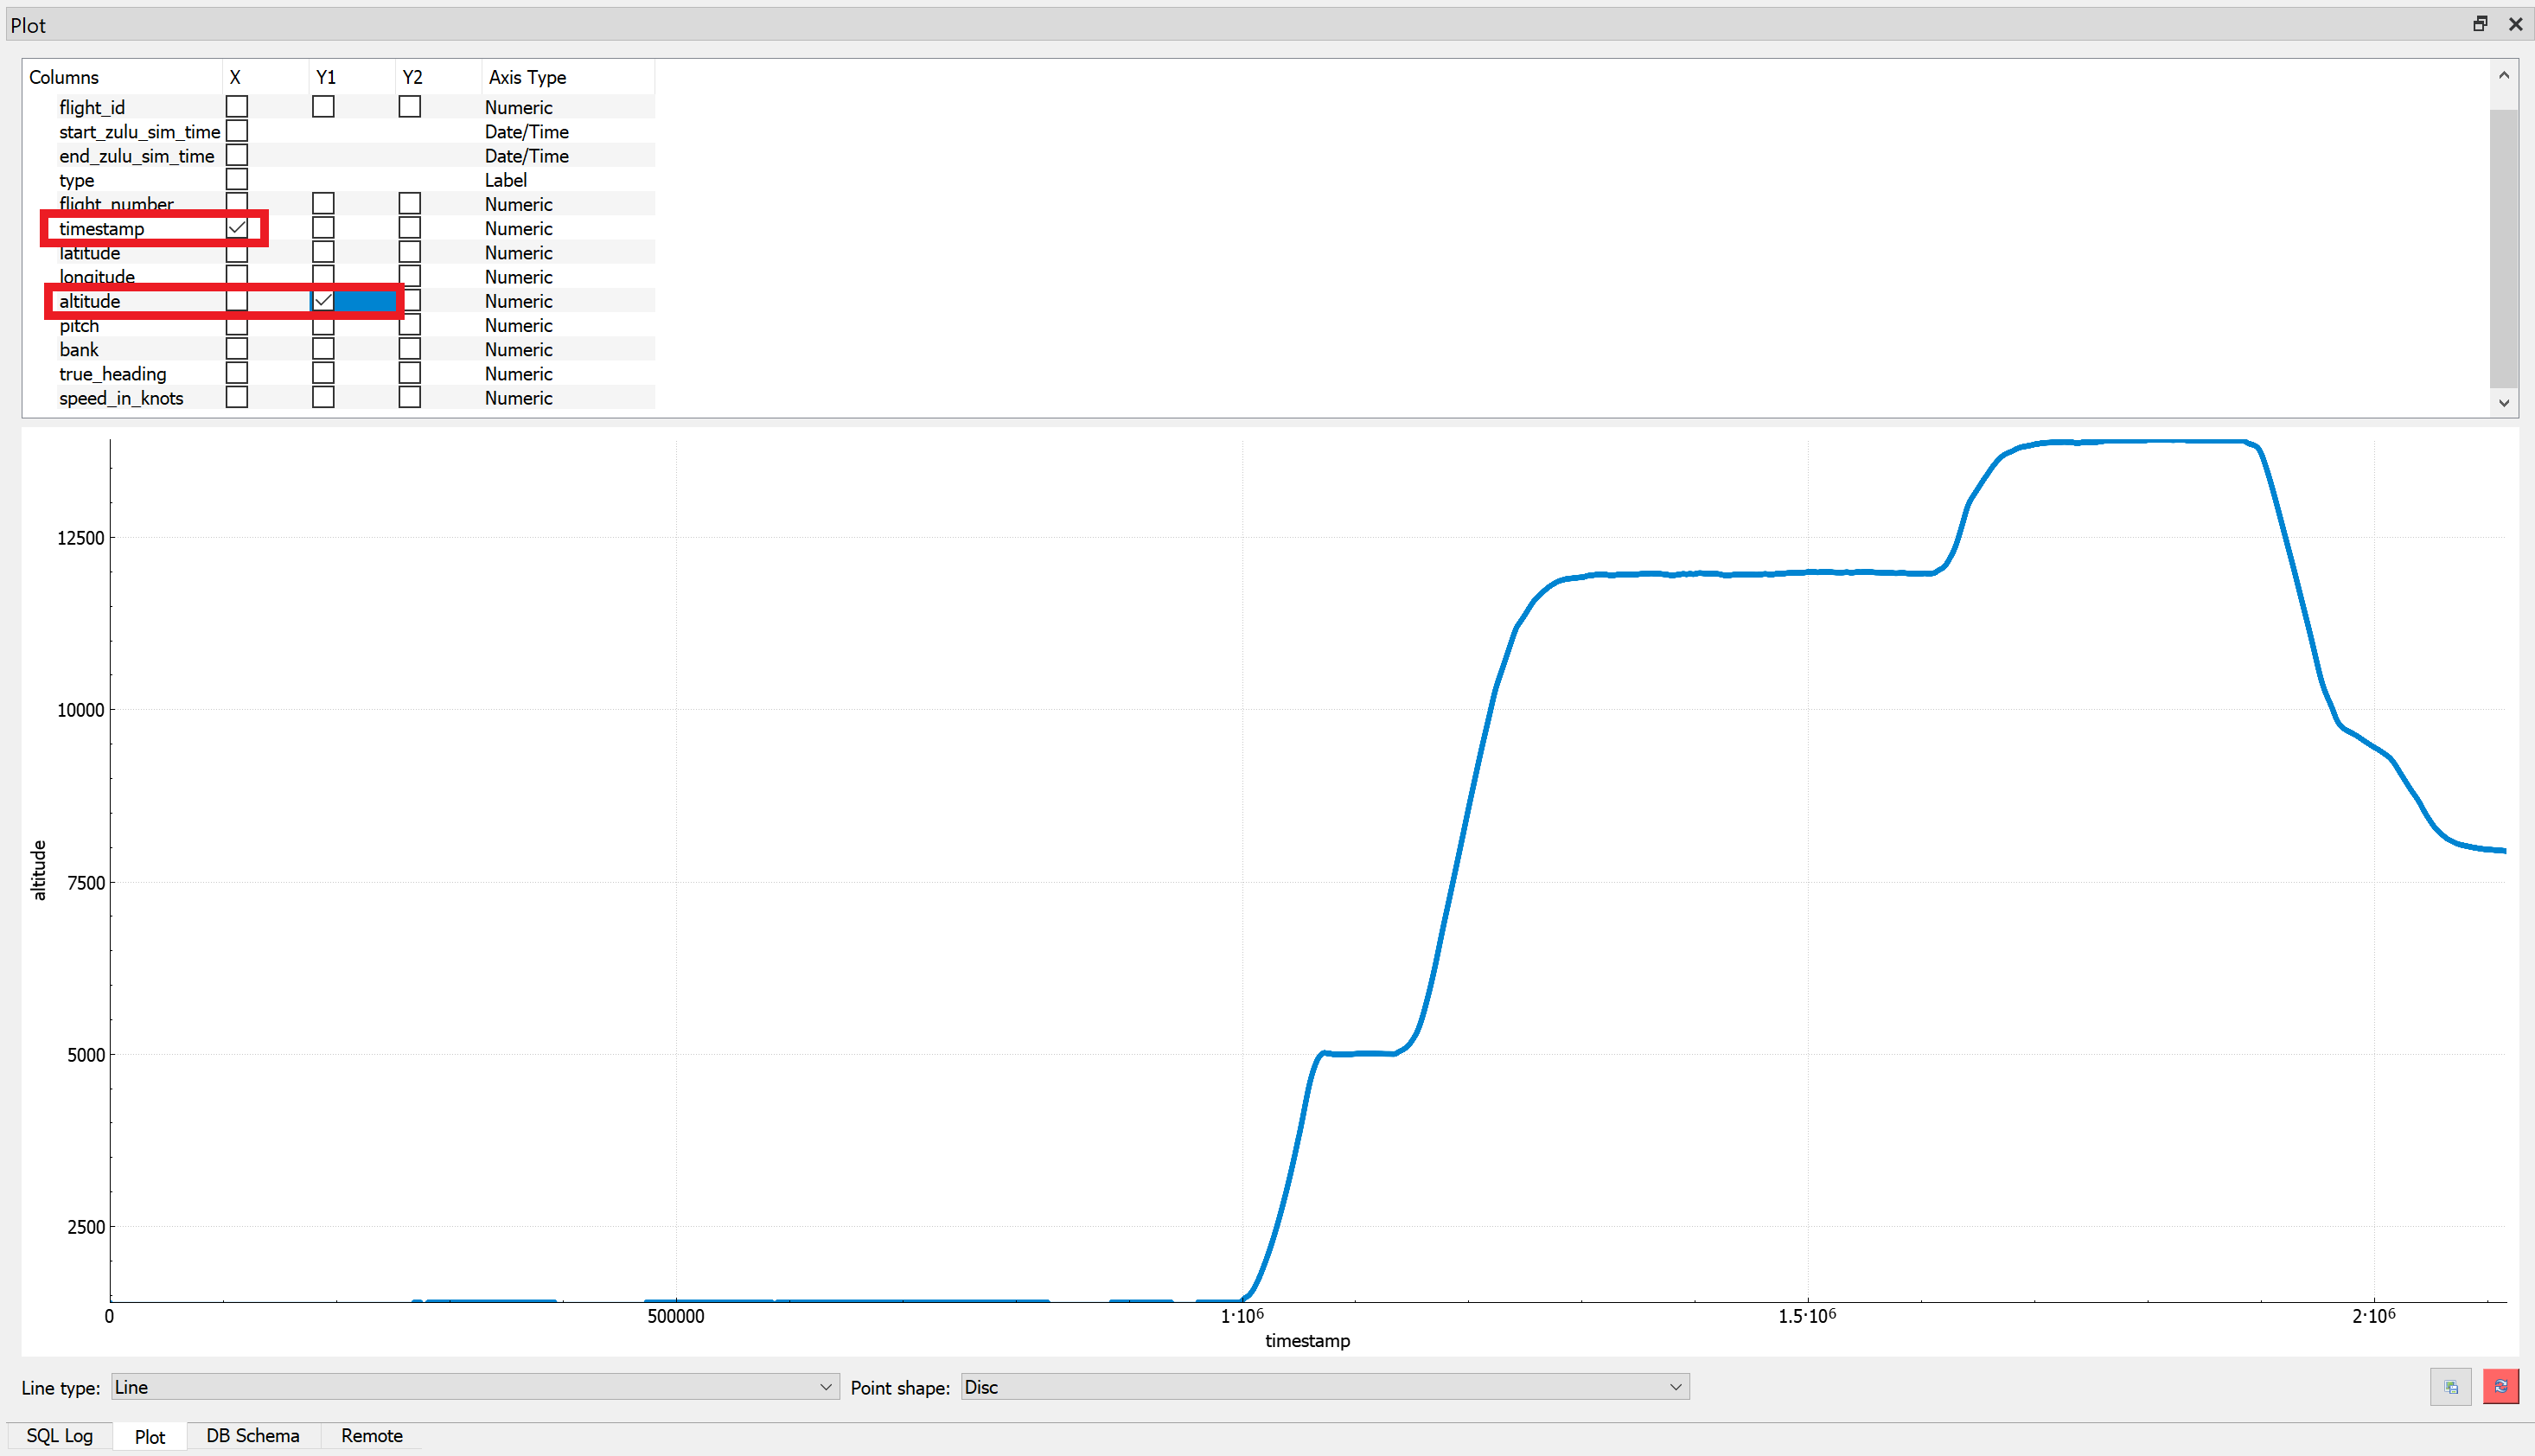
Those plots can then be saved in various formats, including PDF, JPEG or PNG.
Summary
We have seen that:
- With SQL we can create our own custom reports and extract the data that we need, including basic math calculations
- We created several “top 10” statistics, including “your favourite aircraft type”
- We can easily export our custom SQL result sets as CSV data
- We can further process & visualise it in external tools, including basic plot and bar charts in SQLiteBrowser itself
Now it is up to you to come up with your own interesting statistics and logbook visualisations. With the above presented techniques and tools there are almost no limits of what you can do.
If you have any interesting SQL query feel free to share it with others here ![]()