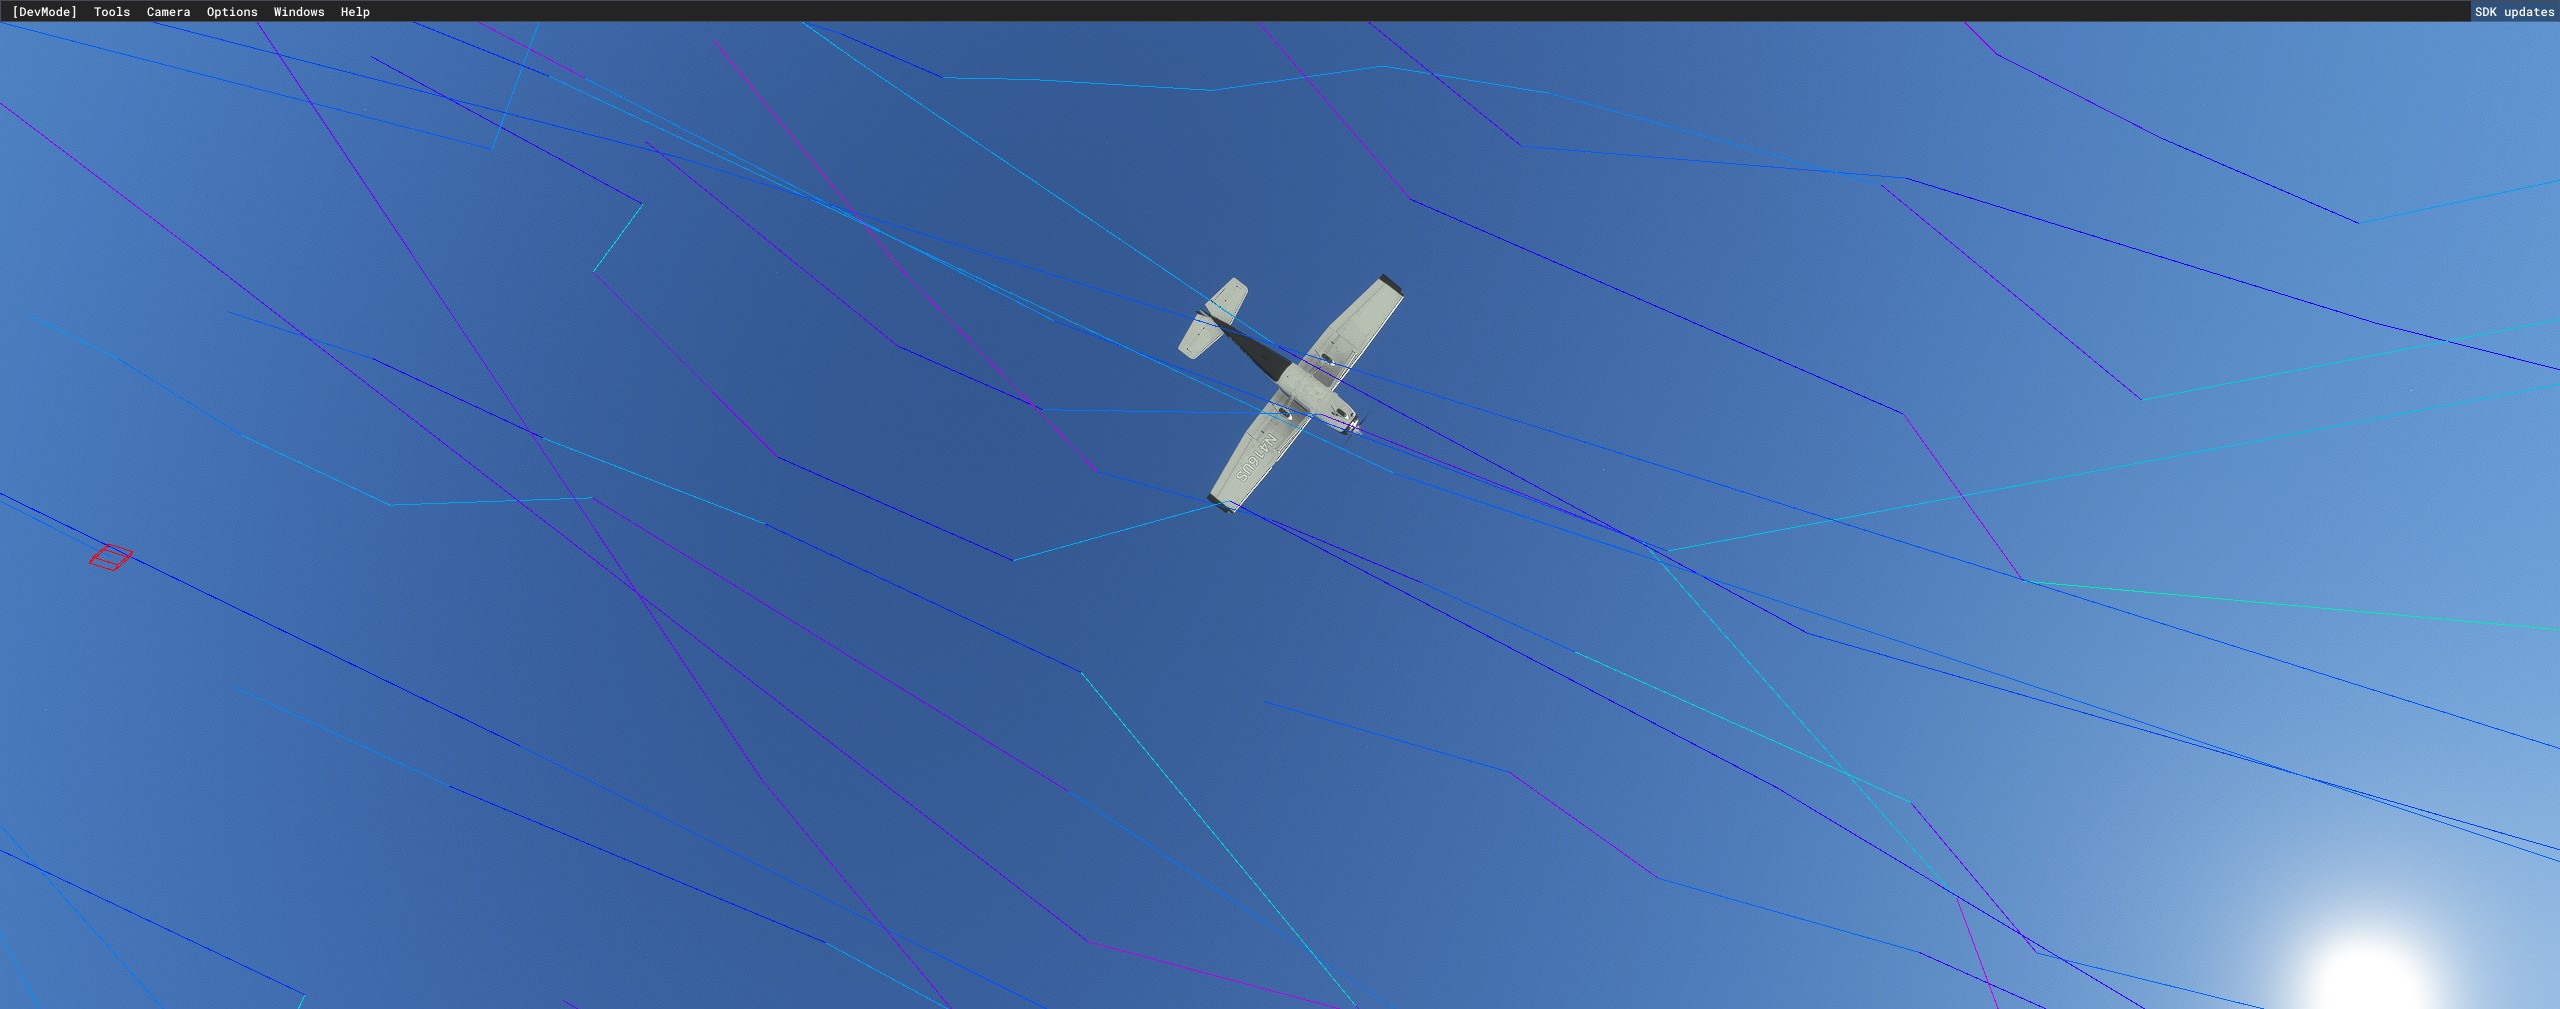
Just use the visualizations if you really want to know what’s going on with the wind. Enable the proximity airflow simulation and the weather debug window while you fly and it should clear things up. As you fly, switch back and forth between the atmospheric airflow visualization and the proximity airflow simulation to get the whole picture.
Each one of these lines are hitting different surfaces of your aircraft at different velocities and angles that is decided by the environment, time of year and wind data combined, and you’re flying through them one after another at different speeds. There are too many variables at play to just look at a couple numbers.
SU11 provides us with tools to get a much better understanding of how a lot of the weather engine works. I really hope people will use them, at the very least for the airflow simulation. It’s a lot more advanced than people in this thread seem to realize. It can at least help the community report any bugs to Asobo. “My plane shook too much last time I flew” or a frequency graph is not very helpful in the context of an atmospheric airflow simulation that runs for miles and is entirely based on virtual air particles bouncing around and interacting with the environment down to individual trees and little bumps on the ground. The airflow simulation has way too many inputs to simplify it to a frequency and amplitude.