I’m running a 7800x3D, 4090, 64GB RAM, NVME. Fresh install of Win11, very clean system.
Trying to diagnose stutters in VR, I decided to take a look at 2D first. Can anyone explain what these CapFrameX stats mean?? I’m getting a crazy amount of frames (140+) but it doesn’t feel smooth when panning around the aircraft.
But how are the following stats possible, seems like a huge discrepancy?
In-game the fps counter is showing me 140fps+ constantly, how can, for example, the average FPS be 21??
I suspect what’s going on is that the CPU frame times are swinging wildly due to the amount of data coming at you. I am not sure where you were flying, but that’s my experience. The GPU can push the pixels, but the size and complexity of the DX commands sent by the CPU is where the issue lies. Try reducing the terrain as much as possible. These are my VR settings, to give you an example. See if you can level that graph a bit.
Red portion of the pie chart is the frame time spikes that are causing the stutters. I run a 7950x3d and 4090…normally in 4K it’s very smooth even on triple screens….so 1080p and 50 LOD with severe stutters is definitely indicative of a problem. When I have had stutters it was cleared up with 2 things: clear the shader cache (via windows disk cleanup or go into NVidia control panel and set cache to 0 and reboot, the set it back to a few gigs), and then also check which version of DLSS you have as MSFS seems to run an older version so I always update that as I am using DLSS quality mode. I use this freeware program to check which DLSS files are running in my games and you can easily download and swap to the latest ones. GitHub - beeradmoore/dlss-swapper. The other thing you could check is to run a check on your ram sticks and make sure there are good and don’t have any problems (I had a stick go bad after just 1 year). Windows has a ram stick check utility that you can google to see how to run it.
I’m not bothered about the curve. What bothers me (here is a new screenshot) is that the overlay shows 144fps and, it’s now running smooth, no stutters (in 2D):
Thanks but I don’t think you’ve understood the issue. It’s running smooth now (issue seemed to be VRR, disabling it fixed 2D mode) but capframeX is just giving garbage stats that are completely wrong (as it was from the beginning). Please see my last post above.
CapFrameX is an advanced, unique data capture and analysis program. A knowledge of how graphics are displayed and a knowledge of statistics is important to understanding results. Why are you using this particular program? Is there a performance issue that needs troubleshooting?
Average FPS means AVERAGE. The sum of all frame times are added and then divided by the number of frames. Average says NOTHING about what you see visually as there may be many frames with fast display times and maybe a few with horrible display times. Very poor display times visibly show stutters or pauses. CapFrameX shows in each “bucket” how many frames had that frame time. Are you going to see stutters if 5 frames out of 10,000 have a poor frame time? Probably not. Using statistical AVERAGE, it is impossible to have 100% FPS above the average FPS.
Because CapFrameX provides so much data, I found it impossible to use only one capture for troubleshooting. When I use CapFrameX, I vary one unique graphic parameter (for example: ultra, high, medium, low) and compare the data collections from each setting. There is a way to stack multiple collections for comparison. One of these will show the highest average or the lowest stuttering. I’ll keep that setting and then select another setting to test. It is imperative to use a static, non-moving image (parked somewhere) for comparisons. I don’t look at the raw numbers, only the comparisons. Otherwise it is too easy to fall into analysis paralysis possibly making performance worse.
OK, thanks for your input, there may be variables at play here that I don’t understand. What’s confusing is that in the past, also in MSFS, what I saw onscreen and in the FPS overlay matched up closely with the CFX analysis. Here it’s hugely discrepant. I also did a quick capture of Assetto Corso, which ran at 90fps and that’s what the subsequent analysis numbers and graph showed, 90fps average and a corresponding graph, as expected.
But seriously, how do you explain an in-game frametime of 6.9ms apparently corresponding to frametimes of MULTIPLE THOUSANDS OF MILLISECONDS on the graph (unfortunately I forgot to add a screenshot of this and am not at my PC). Surely this is just incorrect capture data?
In the past I’ve used CFX to capture MSFS stats (both from 2D and VR) and again, the numbers matched the actual performance. In the current case it’s a huge discrepancy and I don’t think the numbers are correct. When I tried to capture VR this time, it actually refused to generate a capture file at all (despite it apparently capturing), which is also very strange. My current installation of CFX doesn’t seem to be playing nice with MSFS for some reason.
I was ultimately trying to diagnose some stutters that I believed not to be performance- but sync-related, but the issues has since been resolved by switching to another runtime.
Even with incorrect capture data, if it is same incorrect for each data capture, comparisons should still be valuable. Which is why raw data should be ignored.
CapFrameX is good at collecting and analyzing lots of data but doesn’t help pinpoint why it is what it is.
There are other methods of capturing frame data. In the past I’ve used Nframe by NVIDIA. I don’t know if it is still supported. It comes with an excellent White Paper by NVIDIA describing their POV on graphic performance and defines what is a “stutter”.
The wrong data would not be valuable for my use case, I just wanted to see whether it’s really a performance issue causing the stutters (which seemed unlikely) or whether it’s some kind of “out-of-sync” issue arising from the generated frames (with fps at half native refresh) being out of sync with the native refresh of the HMD.
I ended up being right, seemed to have been purely a runtime issue, so man in the middle causing the trouble.
How CapframeX works is that it measures the time between each of the individual frames being generated during the recording period. In looking at your results, it appears CapframeX started recording data before the sim provided data. So CapframeX (correctly) recorded the initial 0.9 sec of the total of 2.6-ish seconds as zero FPS. No frames generated for 0.9 seconds would equate to a frame time of like 900ms. This is the reason why the average framerate starts at around 0.
One COULD dig into the math/statistical causes of the numbers you see but the bottom line is that starting with no frames being generated at the start of the recording skews things and renders it practically useless.
I have been using Capframex quite a bit recently and it has been working exactly as it is supposed to. Not sure how you start the CapframeX recording but I consider the best way to do it is to start Flight simulator, then start Capframex WITHOUT starting the recording. Go back to MSFS to make sure it has focus AND ISN’T PAUSED and then start the Capframex recording using the appropriate hotkey - normally F11 I believe. I would also suggest you use a lot longer recording time: I typically use 5 minutes (300 sec on the Capframex interface) to get a meaningful perspective as to what happens to the framerate depending on what is happening in the sim. This is the type of result I typically get:
With a “clean” graph this long, I can clearly see the effect of changing views (cockpit to showcase), moving the cockpit freelook camera, etc. etc. For instance there was clearly a very big spike when I jumped from the cockpit to the Showcase camera.
I would be very curious to see the plot showing thousands of milliseconds frame times. The only thing I can think of is that this was when Capframex was recording while MSFS was paused or not running.
Thanks for all the hints, but your method is exactly how I’ve used CFX in the past and it has always worked for me (and actually still did for other games when I made the OP). I’m not an expert, but also not new to the app. Sim was already running and had focus when I pressed F11 to start recording.
I also usually record longer periods, this was just because I was trying to get it to work so I tried various things in between recording short clips.
But regarding the FPS graph: Even if we take the missing first 0.9s into account, shouldn’t the line afterwards go much higher than 25-30 fps,considering I was actually getting a constant 140+ during those 10 seconds? Same goes for the average fps bar.. How could it possibly be 3.8?
I feel like it’s just completely borked when trying to capture from (my installation of) MSFS.
Are you perhaps using multiple screens? Frame generation? Not sure what else could cause that kind of discrepancy. And for sure for some reason CapframeX wasn’t seeing anything in the first part of the recording for some reason or the other
I recommend not using two or three different tools to monitor or measure FPS. They are not looking at the same place in the frame creation path, nor would they use the same calculation algorithms. Stick with one or another.
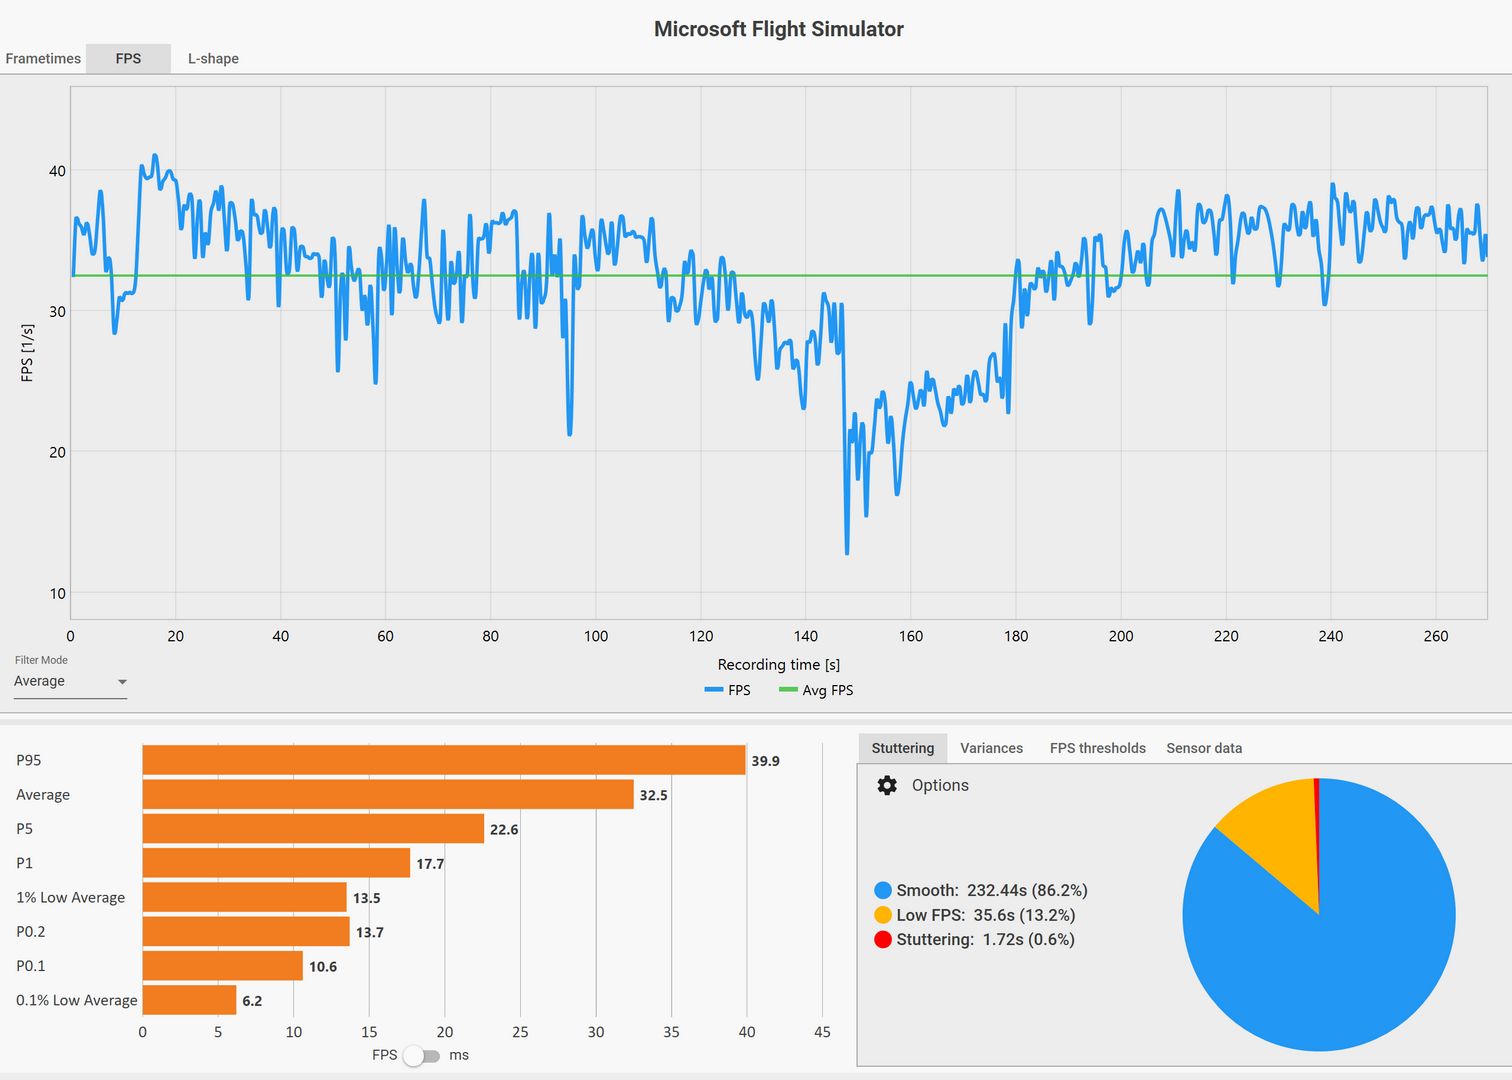
I think the key chart for you should be the one in the lower right showing the “stuttering” tab. The LOW FPS is 95%. The SMOOTH FPS is about 5%, and there is no stuttering. I think SMOOTH should be much higher, and LOW should be smaller.
I’m not sure if it is possible to reconcile CapFrameX with what you were seeing or any other FPS counter. I prefer the NVIDIA performance reports because they measure different things but don’t have fancy charts and graphs unless loaded into Excel.
I don’t think you understand.. I was only using one tool, CFX. It was the CFX fps/performance overlay.
And analyzing the smooth 5% or w/e is meaningless, I thought I made it clear that the tool is simply giving completely incorrect readings. Those numbers didn’t reflect reality.