Importing from Simbrief to Charts opens up a web version of charts. On my PC this drives my CPU to 100c when using the maps. This does not happen if I import the charts to the Charts App.
So use the Charts App and not the Web version.
Importing from Simbrief to Charts opens up a web version of charts. On my PC this drives my CPU to 100c when using the maps. This does not happen if I import the charts to the Charts App.
So use the Charts App and not the Web version.
You don’t mention what CPU you are using, but this might be helpful.
I have a i9-14900KS and a rtx 4090.
Yes I know the CPU runs hot, but the spikes I’m seeing when running Charts from the web browser does not show up when I’m importing the simbrief plan into the Charts App from indisde the Charts App. when opening it in Charts from inside Simbrief it send it to a web version of charts. In the web browser it jumps from 55c to 100c when I start zooming in or moving the map I’m looking at. In the stand alone Charts App it goes from 55c to 60c when I’m doing exactly the same. I never use the in flight Charts so I have not checked what happens there.
This has nothing to do with BIOS settings, The Charts app should behave the same from within the browser as outside. It might be that Chrome does something, I don’t know. Chrome is by the way the recommended browser according to the Navigraph web site.
I have adjusted the Bios so that the temp is below 100C 99% of the time. Even in VR in heavy traffic on a detailed airport with full resolution, and all settings at ULTRA the temp stays below 100c.
If you run HWmonitor or any other software that monitor CPU temps you will see the jump i temp when you start moving or zooming the map.
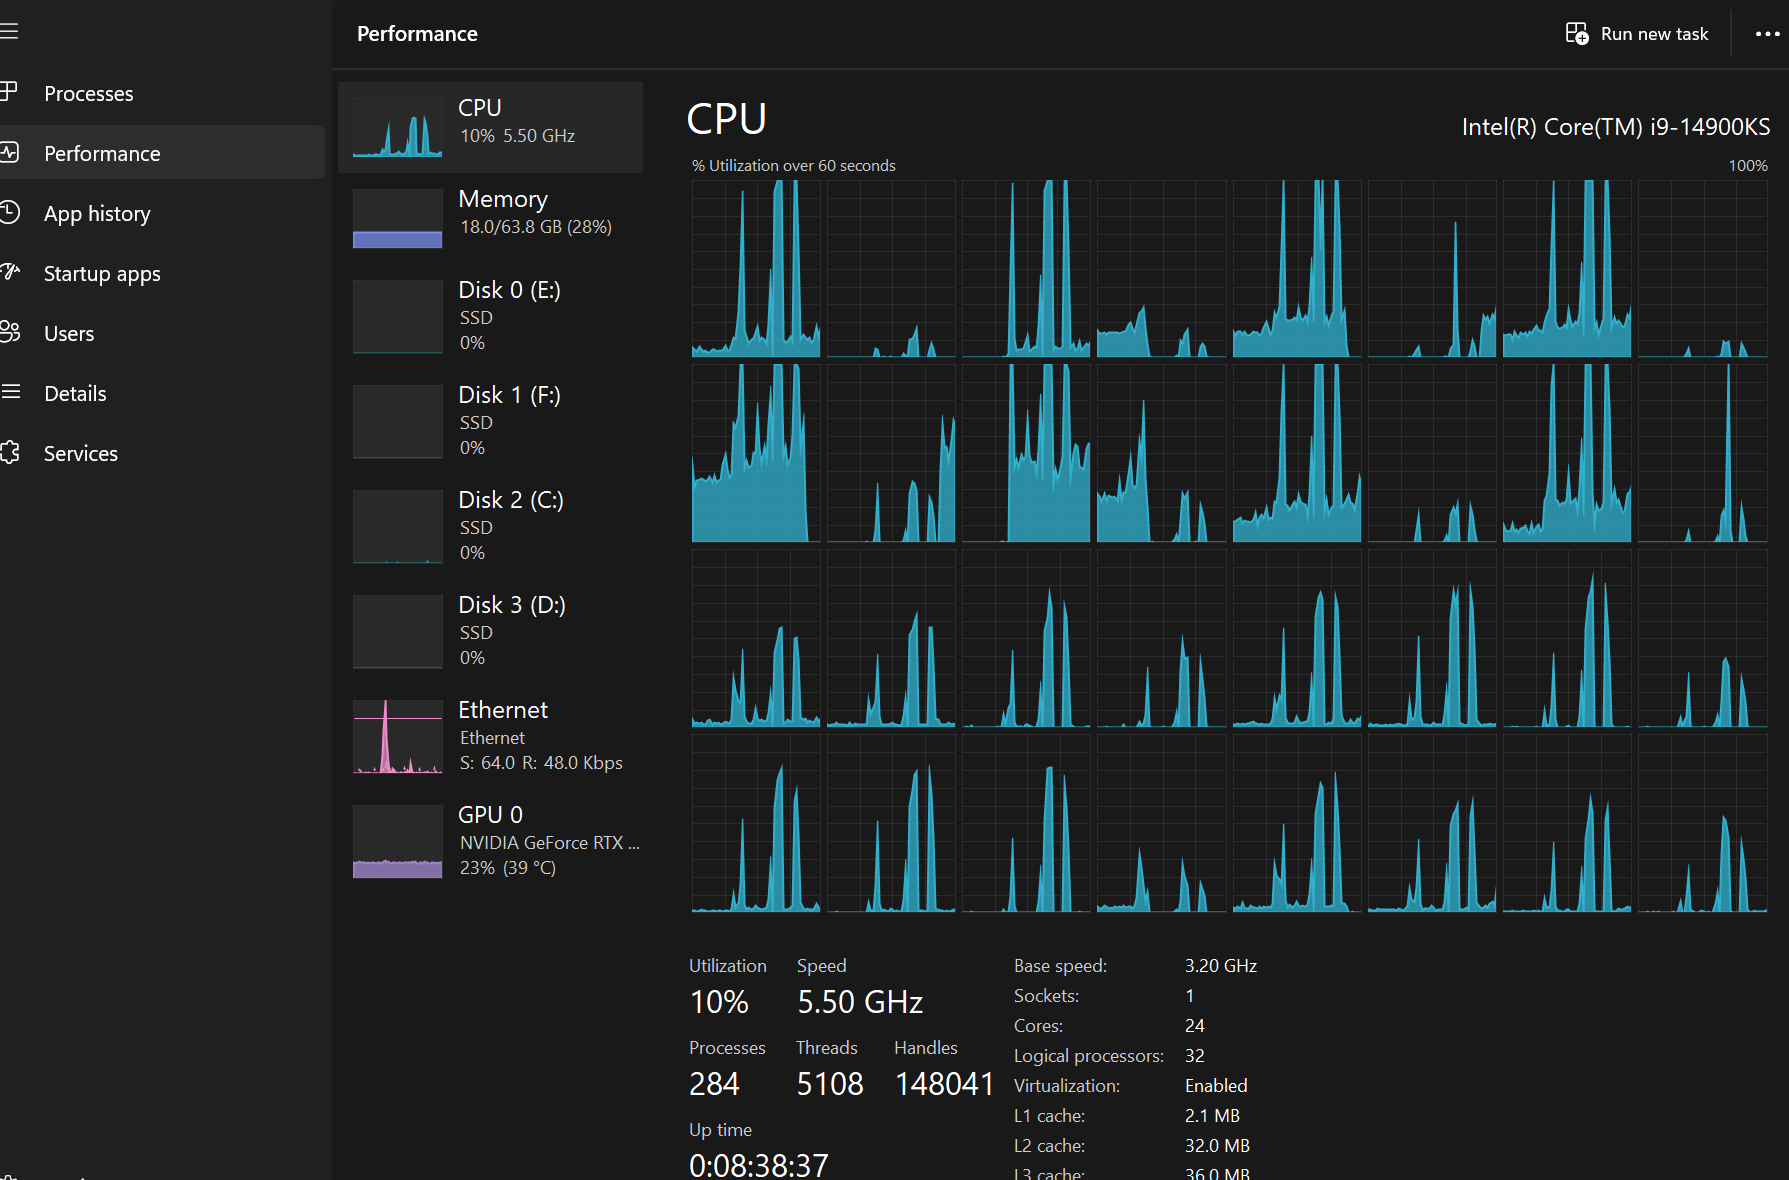
Have you updated Chrome lately? Running any possibly incompatible plug-ins? Because I just created a new flight, imported into the cloud based version of Charts in a new Chrome tab and this one virtual core was the only one that budged during the import:
Thank you Dr. You may very well have a point. I do have an upgraded Chrome, but I also have a LOT of web pages open at the same time, and over 3 virtual desktops ![]() :. A conflicting plugin might very well be the culprit. I’m not too worried about it, as I can use the Charts App and import the Simbrief plan from there.
:. A conflicting plugin might very well be the culprit. I’m not too worried about it, as I can use the Charts App and import the Simbrief plan from there.
I just wanted to warn people who might have a CPU that runs hot like I do that this might be why they see their cpu max at 100c from time to time.
Ran a long VR session with maxed settings in MSFS and in Quest 3 yesterday and the CPU temp never went above 98c.
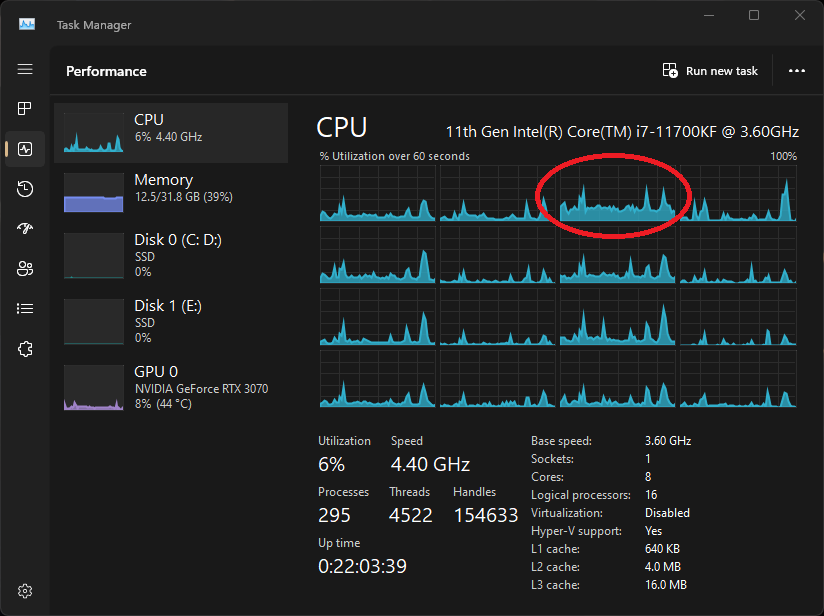
Web based Charts;
First spike is opening into web Charts, second and third spike is zooming in and out.
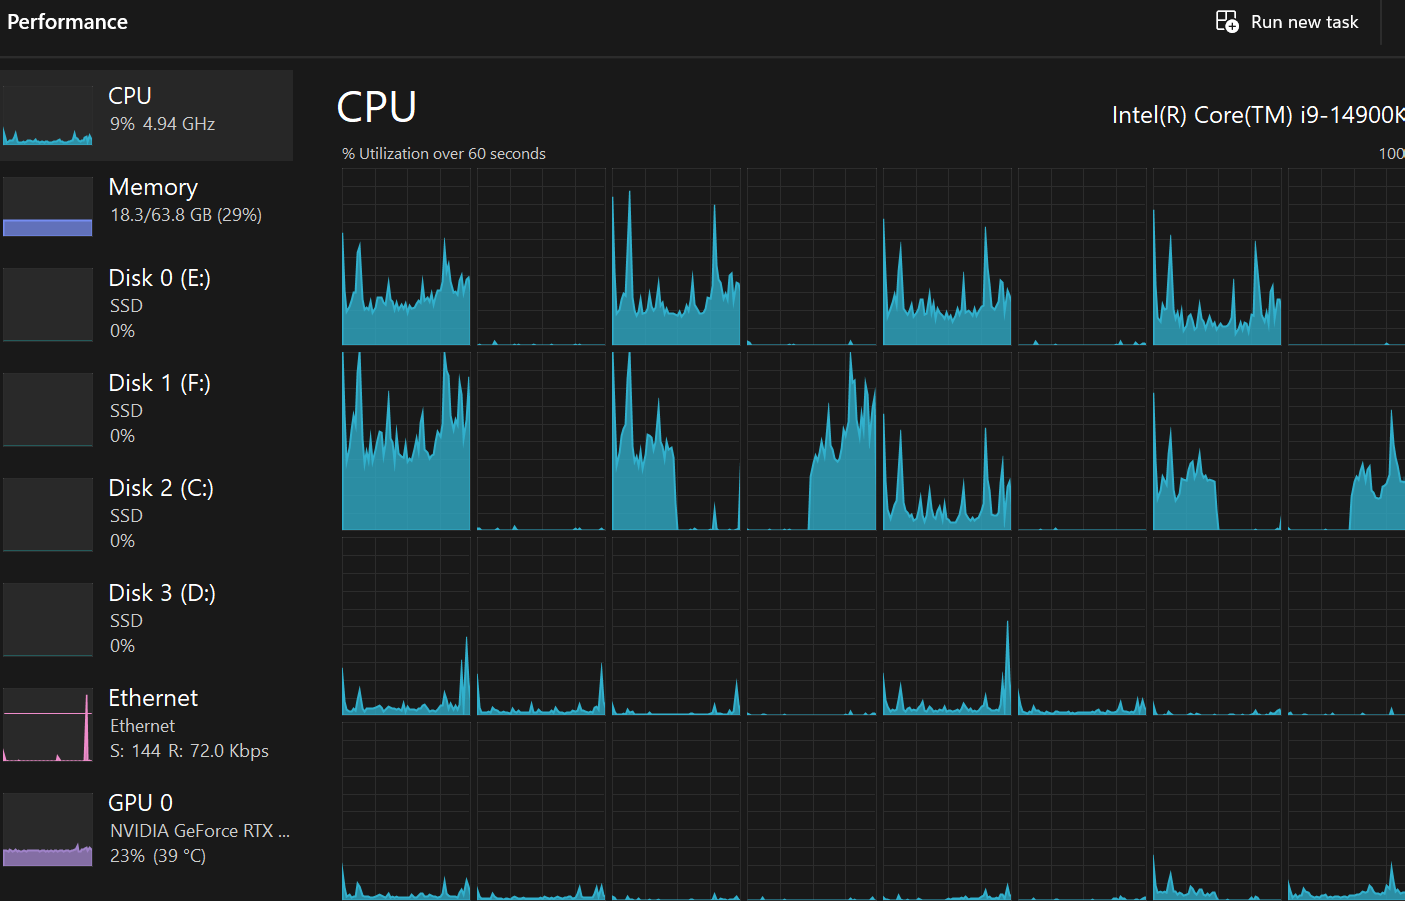
Charts App :
First spike is Opening the Charts App. Zooming does not produce any spikes, and the CPU temp in HWmonitor maxed at 96c never at 100c.
independend of a possible different application implementation , which caused may be much more cpu load which results in higher cpu temp, you should check whether the cpu-cooling / fans are in generaly sufficent … 98deg in games sounds a bit high… is in range, but throttling will may be already start.
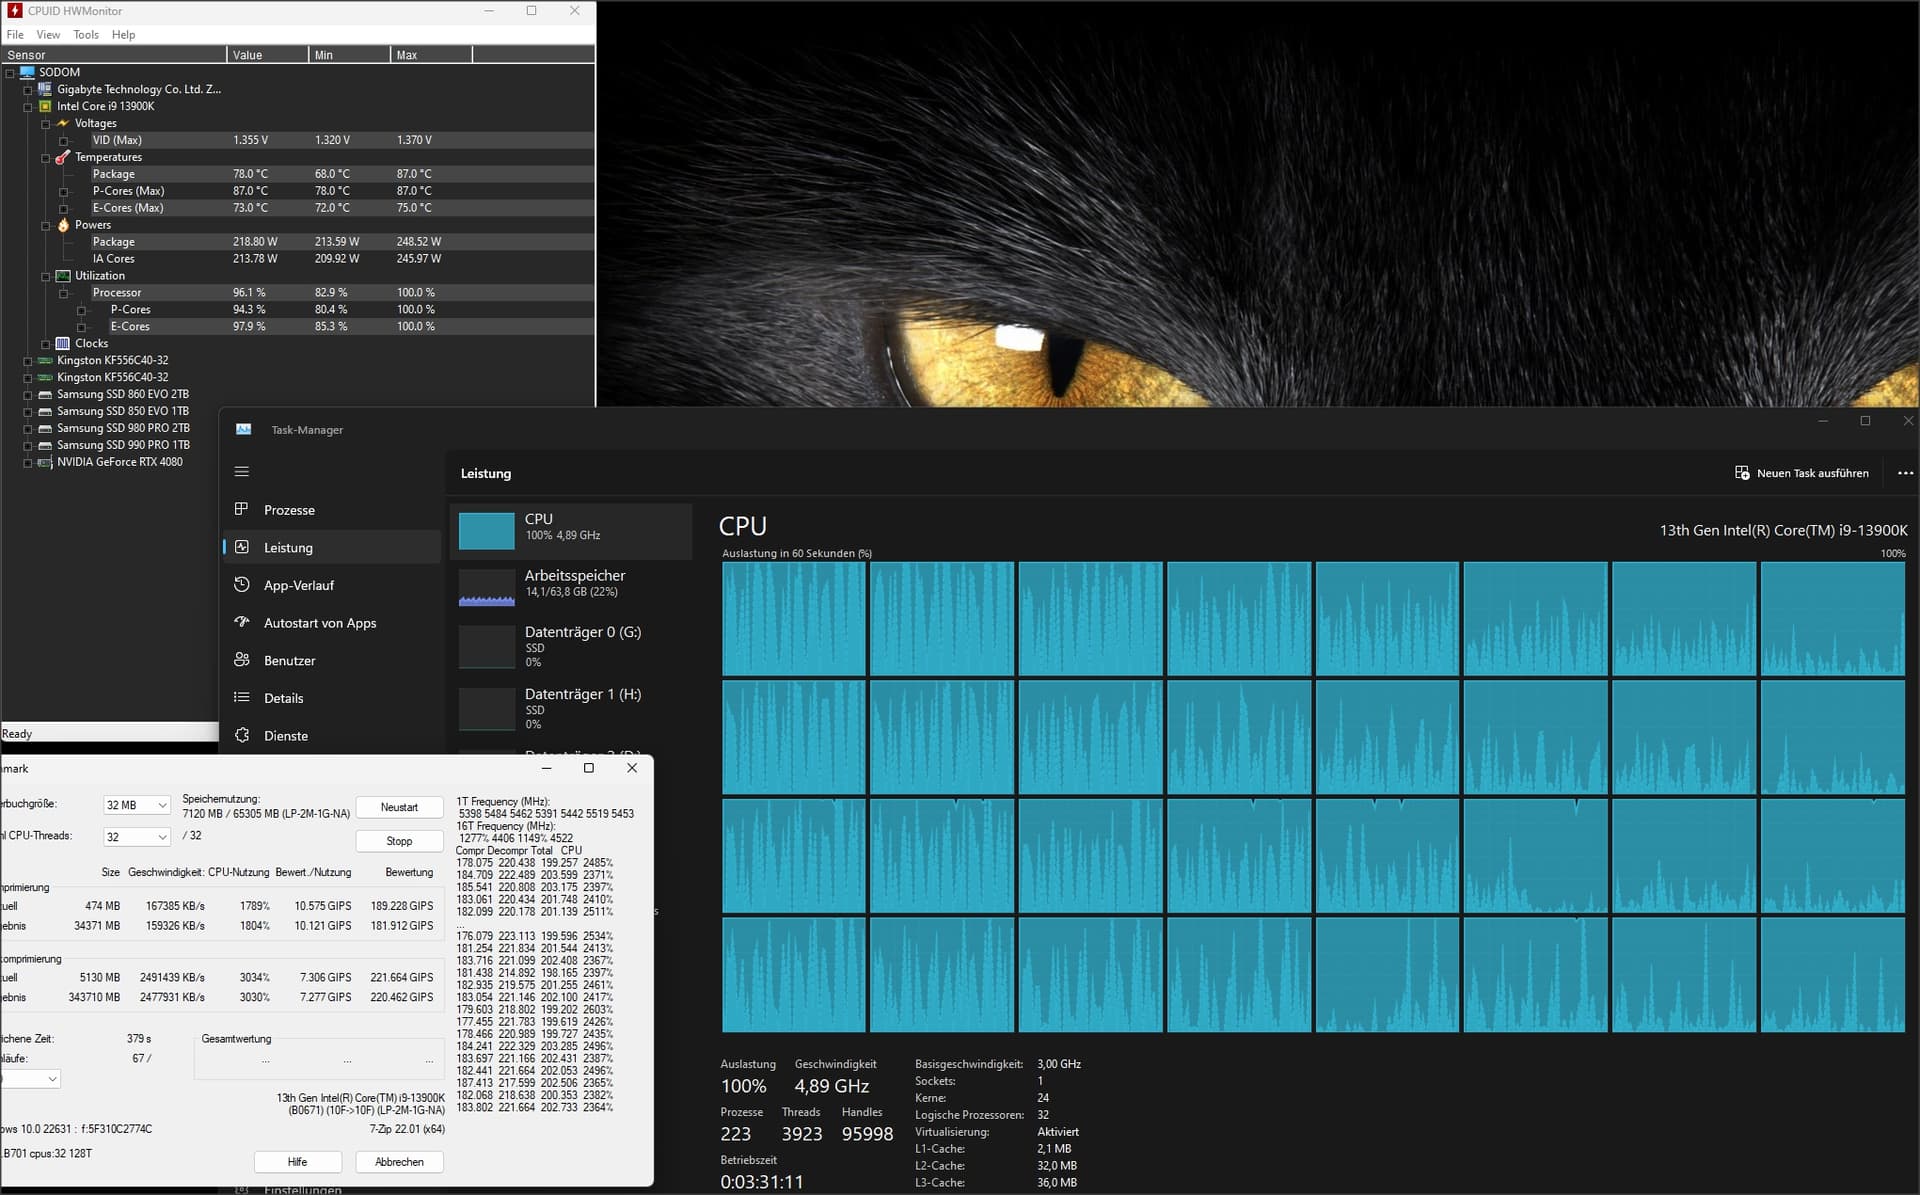
The easiest way to do is are e.g. tools like 7-zip ( often installed from the users ) which includes a simple cpu benchmark, but there are other free cpu-stress-tools. Its similar to Can not finish a single flight before MSFS crashes - #16 by MichaMMA
To compare: I can let run these bench a long time and temps are in range around 8x deg with watercooling. Important to know is, that these CPU bench’es are realy un-common cpu-load-situations and should not happen in real ( I think 7zip also use avx ). So, if your system can survive such tests, there should not be a problem in games.
example of quick bench:
I agree, 98 degrees is too much and thermal throttling will occur. CPU cooling should be checked for improper thermal paste and/or sink seating issue. I’d also try a much more aggressive CPU fan curve to stay ahead and would also enforce proper max wattage in the BIOS.
Does not work well with Chrome when starting MSFS
It was somewhere in Microsoft Edge recommendations and forums.
Thank you for your input. I appreciate the concern ![]() To be clear I have no problems with the way my CPU runs. MSFS is running stable with MAX values both in PC mode and in VR. I have found my solution by running the Charts app and not the Web version.
To be clear I have no problems with the way my CPU runs. MSFS is running stable with MAX values both in PC mode and in VR. I have found my solution by running the Charts app and not the Web version.
My CPU is a i9-14900KS. The 14900 KS is known to run stable at very high temperatures. According to Intel it can run at 100c’s without risking the CPU.
Quote:
“I would like to let you know that your processor supports up to 100°C and any temperatures below it are normal and expected. Bear in mind that some games are CPU-demanding and may cause the CPU to increase usage and temperature.”
I have however restricted the max power consumption in Bios. Also running Balanced Power mode.
CPU has no problem now with the occasional peak to above 95 C.
The KS is the Special Edition unlocked version, and can sustain high temps even better than the “normal” K. I made this post to inform that using the web based Charts will give high peaks in CPU use and temperatures. I’m using Chrome, and I suspect that and the fact that I have 45 Web pages open at the same time has something to do with it.
I think JOBGKJ7579 has a point, and that Chrome is the culprit.
Chrome is the bandit ![]()
Just tested Edge, and the peak CPU temp is 20-25 C lower when performing the same tasks.
Open Simbrief, create FP, open in Charts, open ILS chart, overlay on map, zoom in and move around the map.