Hi Kevin,
Did you have any luck in finding Grabber523 thread explaining the details?
Also… does anybody have a view on Low Latency Mode in NVCP?
Thanks…
Hi Kevin,
Did you have any luck in finding Grabber523 thread explaining the details?
Also… does anybody have a view on Low Latency Mode in NVCP?
Thanks…
If you hunt for @Grabber523 in the search bar at the top of this forum, it will show loads of threads where he discusses the same issue. I’ve attached links to main points. Its up to you if you want a very long read in the threads.
Hi all,
So a bit of an update… Remotely via TeamViewer I modified the FPS to 30 and increased render scaling from 100 to 200. My father then said everything ran silky smooth but then after 10 minutes of taxiing and justr before take off he got a BSOD and reboot:
From application logs:
Log Name: Application
Source: Windows Error Reporting
Date: 10/02/2022 14:33:37
Event ID: 1001
Task Category: None
Level: Information
Keywords: Classic
User: N/A
Computer: DESKTOP-LG4P1RA
Description:
Fault bucket , type 0
Event Name: BlueScreen
Response: Not available
Cab Id: 0
Problem signature:
P1: 124
P2: 0
P3: ffff9681a5437028
P4: be000000
P5: 800400
P6: 10_0_19044
P7: 0_0
P8: 768_1
P9:
P10:
Attached files:
\?\C:\WINDOWS\Minidump\021022-4140-01.dmp
\?\C:\WINDOWS\TEMP\WER-5984-0.sysdata.xml
\?\C:\WINDOWS\MEMORY.DMP
\?\C:\ProgramData\Microsoft\Windows\WER\Temp\WER20F5.tmp.WERInternalMetadata.xml
\?\C:\ProgramData\Microsoft\Windows\WER\Temp\WER2106.tmp.xml
\?\C:\ProgramData\Microsoft\Windows\WER\Temp\WER2143.tmp.csv
\?\C:\ProgramData\Microsoft\Windows\WER\Temp\WER2144.tmp.txt
These files may be available here:
\?\C:\ProgramData\Microsoft\Windows\WER\ReportArchive\Kernel_124_fc286c48eb24dd7c3d303c14fe57de28f71df6a_00000000_cab_f6c3bb64-c90f-44bd-8747-a407c526227b
Analysis symbol:
Rechecking for solution: 0
Report Id: 153d8fe7-741a-44a6-be3c-416f12469805
Report Status: 2049
Hashed bucket:
Cab Guid: 0
Event Xml:
1001
0
4
0
0
0x80000000000000
4942
Application
DESKTOP-LG4P1RA
0
BlueScreen
Not available
0
124
0
ffff9681a5437028
be000000
800400
10_0_19044
0_0
768_1
\?\C:\WINDOWS\Minidump\021022-4140-01.dmp
\?\C:\WINDOWS\TEMP\WER-5984-0.sysdata.xml
\?\C:\WINDOWS\MEMORY.DMP
\?\C:\ProgramData\Microsoft\Windows\WER\Temp\WER20F5.tmp.WERInternalMetadata.xml
\?\C:\ProgramData\Microsoft\Windows\WER\Temp\WER2106.tmp.xml
\?\C:\ProgramData\Microsoft\Windows\WER\Temp\WER2143.tmp.csv
\?\C:\ProgramData\Microsoft\Windows\WER\Temp\WER2144.tmp.txt
\?\C:\ProgramData\Microsoft\Windows\WER\ReportArchive\Kernel_124_fc286c48eb24dd7c3d303c14fe57de28f71df6a_00000000_cab_f6c3bb64-c90f-44bd-8747-a407c526227b
0
153d8fe7-741a-44a6-be3c-416f12469805
2049
0
WHEA_UNCORRECTABLE_ERROR (124)
A fatal hardware error has occurred. Parameter 1 identifies the type of error
source that reported the error. Parameter 2 holds the address of the
nt!_WHEA_ERROR_RECORD structure that describes the error condition. Try !errrec Address of the nt!_WHEA_ERROR_RECORD structure to get more details.
Arguments:
Arg1: 0000000000000000, Machine Check Exception
Arg2: ffff9681a5437028, Address of the nt!_WHEA_ERROR_RECORD structure.
Arg3: 00000000be000000, High order 32-bits of the MCi_STATUS value.
Arg4: 0000000000800400, Low order 32-bits of the MCi_STATUS value.
In System Logs:
CUSTOMER_CRASH_COUNT: 1
PROCESS_NAME: FlightSimulator.exe
STACK_TEXT:
ffffa90104614908 fffff80232eb422a : 0000000000000124 0000000000000000 ffff9681a5437028 00000000be000000 : nt!KeBugCheckEx
ffffa90104614910 fffff8022fa915b0 : 0000000000000000 ffff9681a5437028 ffff96819c71db20 ffff9681a5437028 : nt!HalBugCheckSystem+0xca
ffffa90104614950 fffff80232fb616e : 0000000000000000 ffffa901046149f9 ffff9681a5437028 ffff96819c71db20 : PSHED!PshedBugCheckSystem+0x10
ffffa90104614980 fffff80232eb5b51 : ffff9681a54a2ac0 ffff9681a54a2ac0 ffff96819c71db70 ffff96819c71db20 : nt!WheaReportHwError+0x46e
ffffa90104614a60 fffff80232eb5ec3 : 0000000000000002 ffff96819c71db70 ffff96819c71db20 0000000000000002 : nt!HalpMcaReportError+0xb1
ffffa90104614bd0 fffff80232eb5da0 : ffff96819c71bb20 10fb80ff00000001 0000000000000000 3c1d7602f9800575 : nt!HalpMceHandlerCore+0xef
ffffa90104614c20 fffff80232eb5ff1 : 0000000000000010 0000000000000001 0000000000000000 48ffffa847e90035 : nt!HalpMceHandler+0xe0
ffffa90104614c60 fffff80232eb525b : 0000000000000000 0000000000000000 ffffa90104614ef0 b24a05c7ffffa81a : nt!HalpMceHandlerWithRendezvous+0xc9
ffffa90104614c90 fffff80232eb7aa5 : ffff96819c71bb20 20e2c148320fc000 0ee8ba0f48c20b48 0f20eac148d08b48 : nt!HalpHandleMachineCheck+0x5f
ffffa90104614cc0 fffff80232f0d459 : b8707280000008fe a20fc93380000008 c160244489c18b44 410e750fe1830ce9 : nt!HalHandleMcheck+0x35
ffffa90104614cf0 fffff80232e064fa : 0000008e8788e0d2 37728000001efe81 b8307316e5ba0f41 a20fc9338000001e : nt!KiHandleMcheck+0x9
ffffa90104614d20 fffff80232e061b7 : ffffa90100000000 fffff80232e060ec 000000002c31764f 0000000000000000 : nt!KxMcheckAbort+0x7a
ffffa90104614e60 fffff80232c3a650 : 0000000000000000 0000000000000000 0000000000000000 0000000000000000 : nt!KiMcheckAbort+0x277
ffff950f7f9f1340 0000000000000000 : 0000000000000000 0000000000000000 0000000000000000 0000000000000000 : nt!KeFlushMultipleRangeTb+0x160
MODULE_NAME: GenuineIntel
IMAGE_NAME: GenuineIntel.sys
STACK_COMMAND: .cxr; .ecxr ; kb
FAILURE_BUCKET_ID: 0x124_0_GenuineIntel_PROCESSOR__UNKNOWN_IMAGE_GenuineIntel.sys
OS_VERSION: 10.0.19041.1
BUILDLAB_STR: vb_release
So it looks like I may have a HW issue at play with the CPU here also… I will have to interrogate the temperatures during game play next time I am over but with FurMark GPU stress test, I see CPU temp around 84-91 degrees. This test ran for ~25 mins and no crash.
Not sure about the crash log but it seems your CPU temps are quite high?
With it being a new system with new technology and everything have you checked that the motherboard drivers are up to date? I mean there are usually things like quite frequent updates to hardware drivers when it’s new.
Also make sure that you are not overclocking anything by default. Maybe XMP is turned on but the RAM doesn’t like the increased XMP frequency? Things like that. I would keep an eye on CPU temps - is there adequate cooling? I’m no expert on HW issues though, hopefully someone on here can shed more light on it. They can be very hard to narrow down.
I just googled “Machine Check Exception” and the ref I find says " “Machine Check Exception blue screen – This error is always followed by a Blue Screen of Death. The most likely cause is a hardware problem or a corrupted driver.”
ref:
If it was me I’d be checking for drivers first though especially for the motherboard.
Also check that all your Intel drivers are up to date (from Intel for the latest ones) and that your NVidia drivers are up to date with the latest game ready driver 511.65 (I’m using it with no issues). Make sure your direct X shader cache is cleared if you do update it though.
On a plus side I guess you figured out your optimal FS graphical tuning before the hardware/drivers gave way, glad to hear it was running smooth, that’s how it should be. Hope you get to the bottom of this, but it sounds like it’s not FS related any more.
Thank you… I’ve got HWInfo on it now but not setup RTSS yet to see in game stats without having the windows app open but… On the runway at JFK just sitting there I am seeing CPU temp of 80 degrees!
Just check on Toms Hardware guide and it says-
With a load typically under 80C
Some CPUs run hotter eg in gaming laptops
Anything abiove 95C critical and may begin throttling down.
Now keep in mind JFK is quite a wost case scenery wise, but your (liquid?) cooling certainly needs to be there and working. I just did a HWMonitor on ground at JFK and my ‘package’ temperature (CPU?) is around 78C. I really don’t know what’s normal nor am I an expert on such things. I have a prebuid from Dell/Alienware and so far it seems fine. It can make a lot of noise sometimes with the cooling fans though.
Thanks… This PC doesn’t have any liquid cooling, traditional fans. I will need to see how temperatures fluctuate in game.
If you point me to the software you are sing we can do like for like temp comparisions at JFK. I supposedly have liquid cooling on the 5950X. Different spec machines, but may be worth a temp comparison as I am (thanfully) very stable.
It was HWInfo… I don’t have RTSS installed so can’t see a nice banner in flight but of course you can have the window on the screen in parallel. Incidentally during some of the loading phases I saw CPU hit between 90-102 degrees which is definitely very high.
Our processors will have different thermal characteristics but yes worth a try to compare.
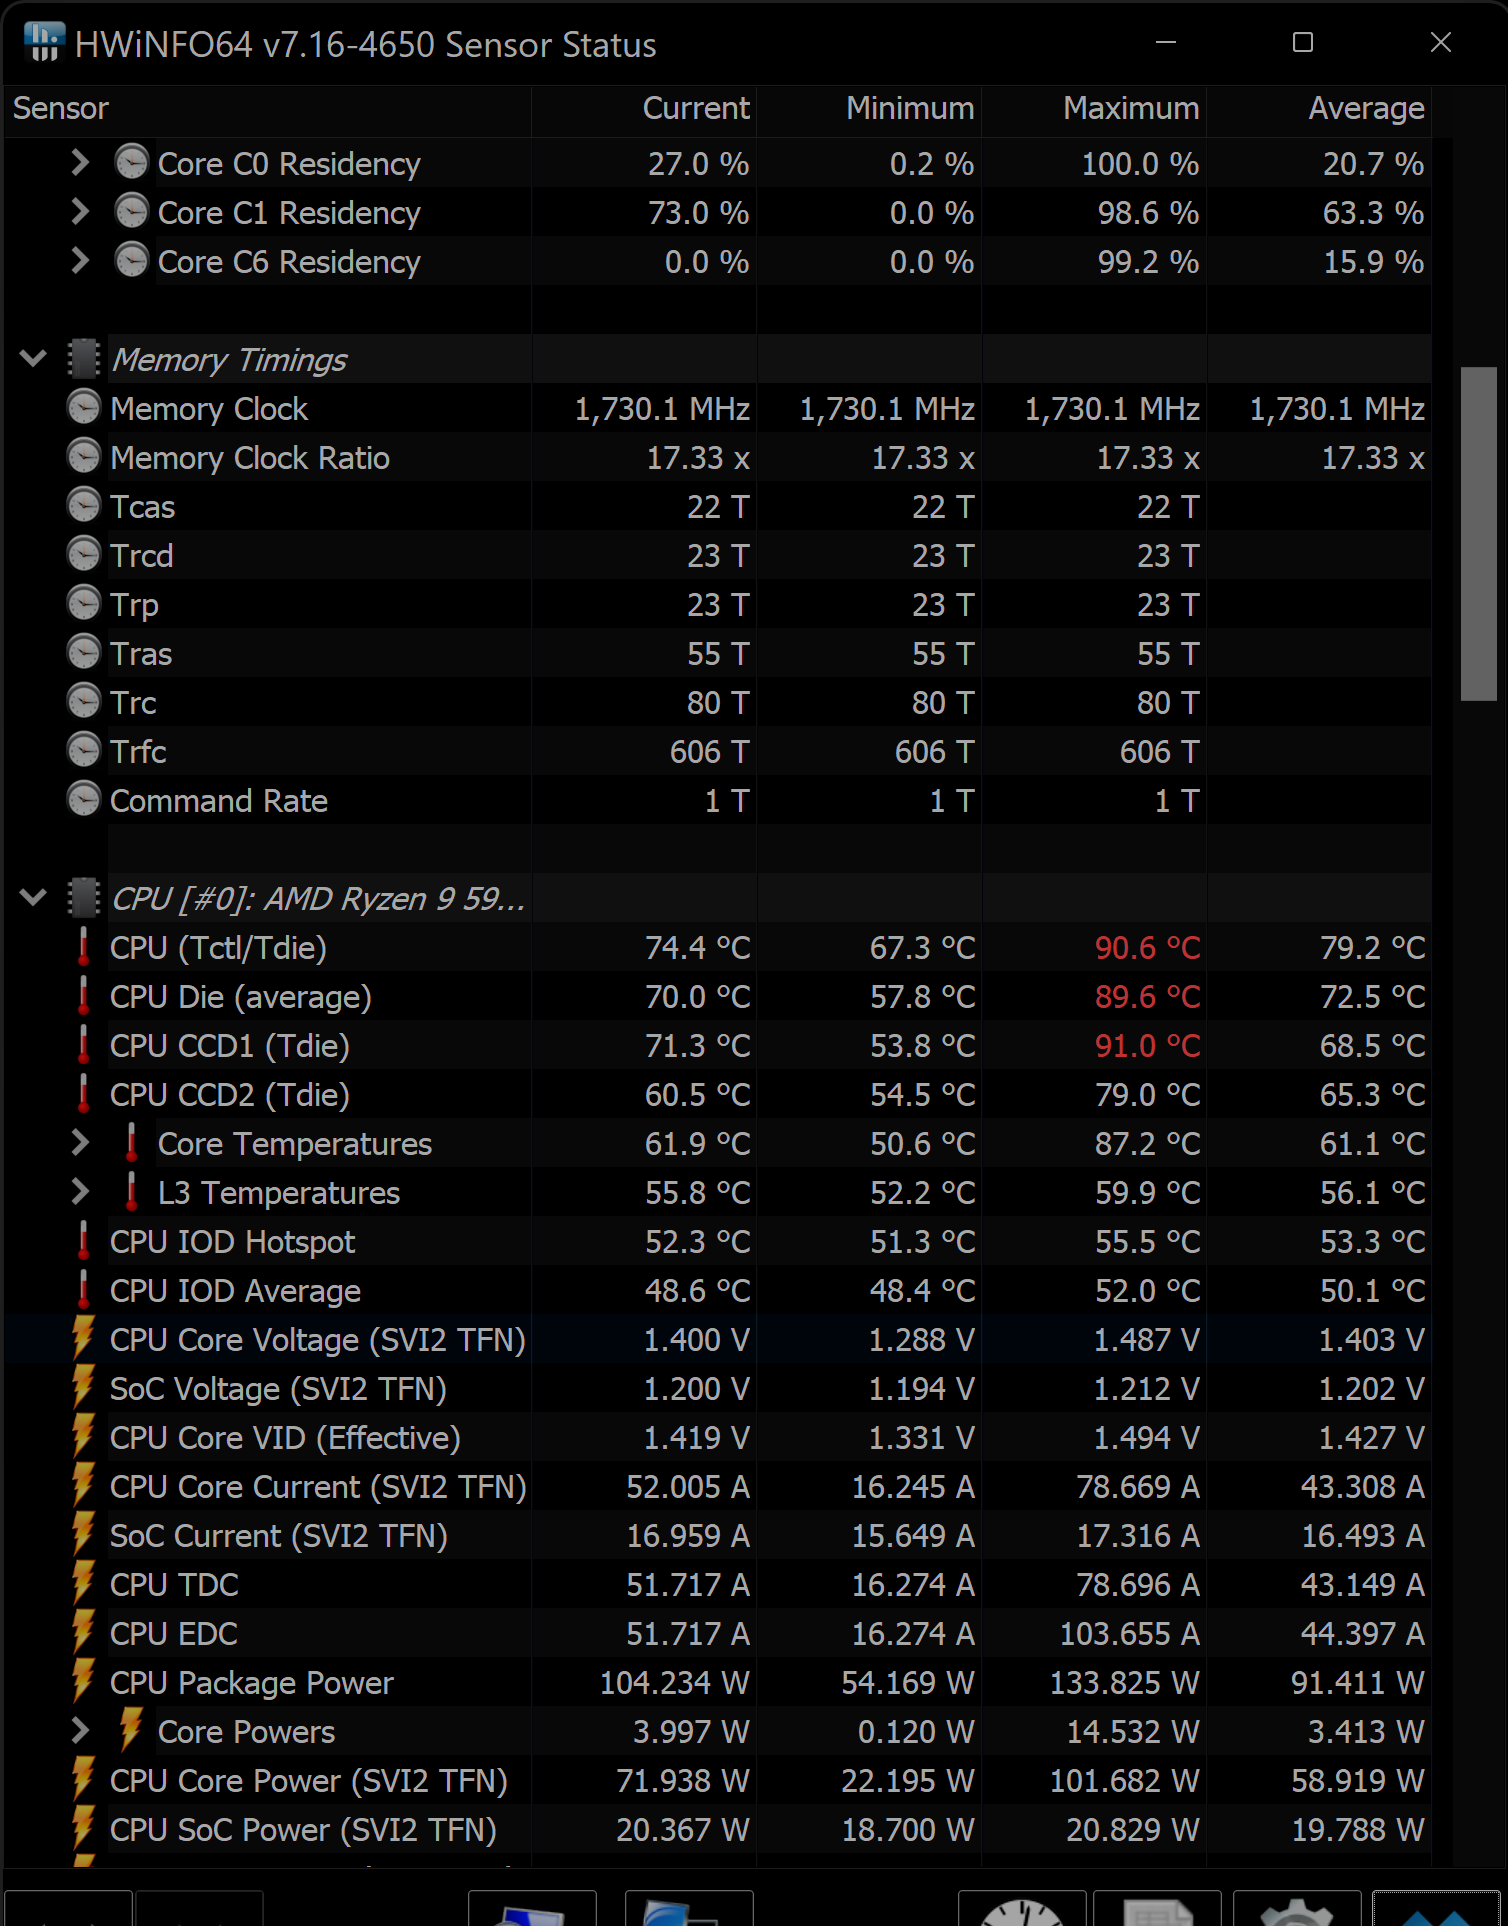
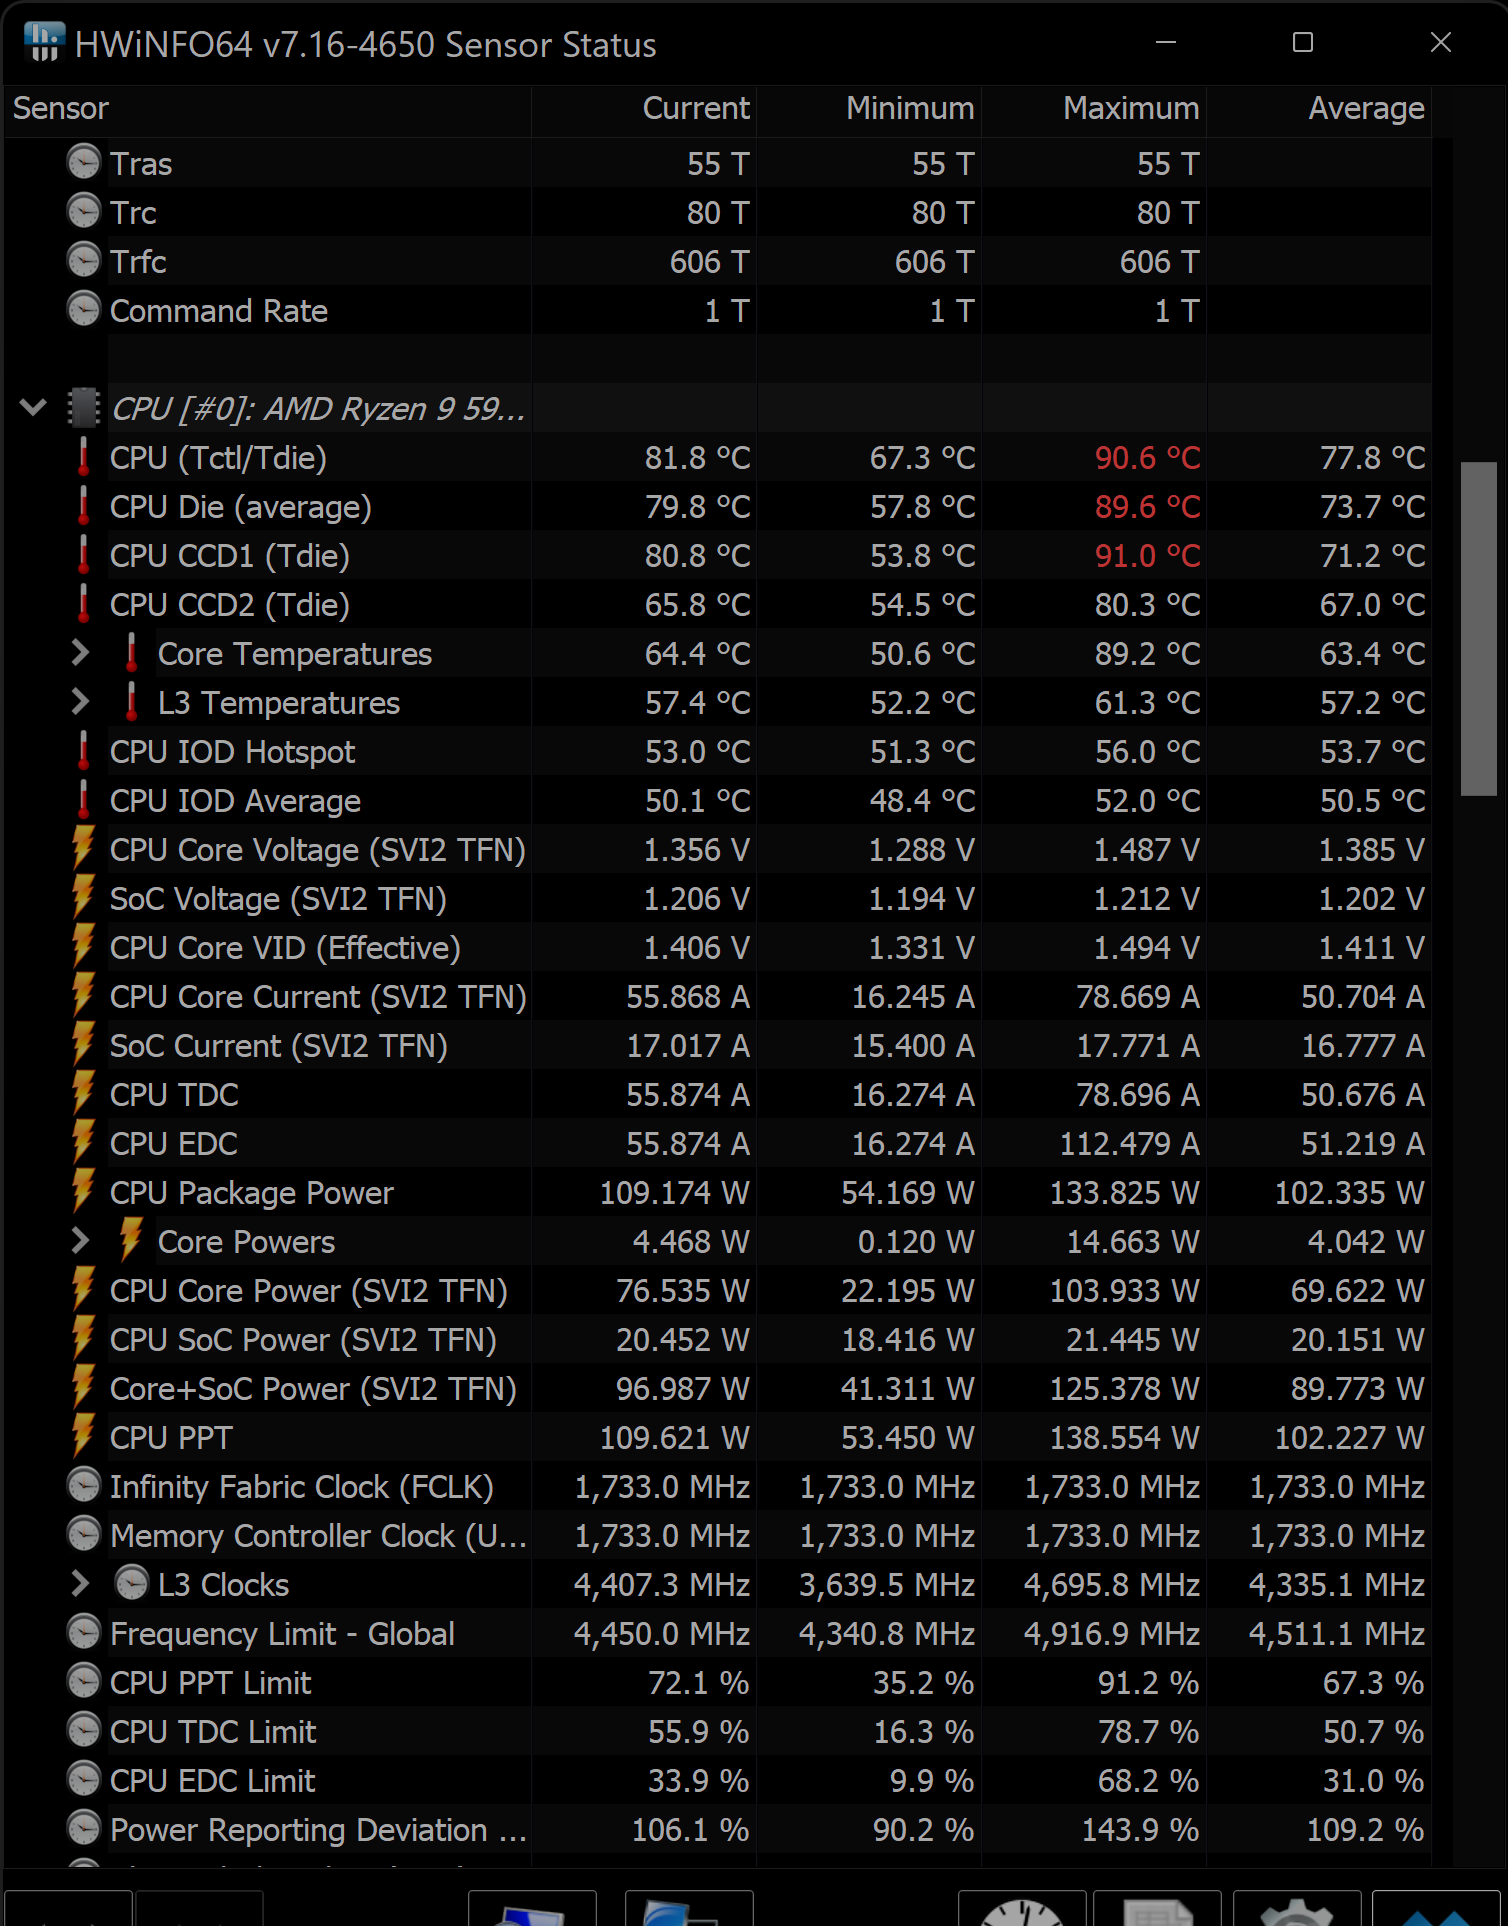
This is me parked static at 31L JFK ready for takeoff. The red highs were from the loading screens and the PC fans were kicking in during that time.
As you can see the CPU temp returns back down to 70C(ish) afterwards.
Interestingly (still static at JFK 31L, when I move the Terrain LOD slider from 200 to 300 it adds a few CPU degrees which backs up that CPU does indeed have to work harder at higher LODs.
I’m just throwing this in for your consideration regarding temperatures. I was using HWMonitor and got a screen shot of THREE of my cores hitting 100c (only when in MSFS, of course). I began to do research and found that some websites say that HWMonitor’s numbers are artificially high. I’m no hardware guy, so I wasn’t sure. I downloaded Core Temp and HWInfo64 and both of those showed temps “only” in the low 90c’s when HWMonitor was in the high 90c’s. I still thought that was too high, so I wrote a ticket with CyberPower. I chatted with a tech who said numbers in the 90’s are not too hot for today’s CPUs and not to worry about it because they’ll throttle down if necessary (I do not overclock). Now you can take that for what it’s worth.
BUT here’s the kicker. He did suggest that I should apply thermal paste to the CPU. I asked if that would void the warranty, and he said no, unless I damage something in the process. It seems pretty easy according to the YT videos I see, so I’m going to try. Also, he said that applying thermal paste to the CPU was considered part of normal customer maintenance. So you might want to think about it. Since I chatted with the tech, I’ve read that Cyberpower PCs ship with a woefully minimal amount of thermal paste, so that might be your problem too (even if you don’t have a Cyberpower PC).
Best of luck.
It’s definitely a consideration. Would the PC not just thermally throttle to low clock speed rather than complete crash/BSOD though? I’ve seen others post about thermal paste issues on here. Usually to do with graphics cards, but same story though.
It’s another reason I ended up going with Dell/Alienware. Even the Nvidia card is their own branded one so I assume they have some kind of assembley QA going on that avoids /minimises service tickets. I really just wanted the warranty if I had any issues. Fortunately I’ve had no issues so far.
Lack of thermal paste seems to be a massive flaw on PC builders part. I mean why economise on something so obvious? To save money?!! Lack of understanding? Seems crazy.
An amusing recollection - I only ever once did thermal paste application to my CPU/heatsink interface once and that was circa year 2000 doing a CPU (a Celeron to be overclocked) upgrade to run FS2000 on funnily enough!
We are now at least able to replicate the crashes very easily…
If we turn render scaling up to 200 then it BSOD within minutes; same at 195,190, 185 but at 180 it is stable.
Now just got to nail what is causing the BSOD. At this stage, as we are now investigating the BSOD rather than juddering / stutters, I will move discussions around BSOD to my other topic: Lockups / Reboots - #13 by DeltaEcho56
See here:
Yes agree with this 200 is way to high for render scale. Aim for 125 or 150%(4K) as even 180 seems too high. The GPU could be overloading at 200.
In fairness though at 200, everything is silky smooth. It seemed to be a real sweet spot. It’s just the crashes are much more frequent. They have still happened at lower scales but less frequent.
My render scale is at 100 @ 4K. Locked at 30FPS, 60Hz and most but not all my other graphical settings at high/ultra. TLOD 200, OLOD 200. Gives me GPU at about 68% utilisation and smooth performance. At 200 render scale your GPU may start hitting thermal limit & throttling back. I think I saw in my settings that the max was 83degC or something before throttling starts on mine. 200 is a very high rendering size. I still think you could do with a 4k monitor or UHDTV but 1440p should be workable too. At 150% render scale.
Same for me as BragRainDrop. I tried the render scaling tip a couple of times but in the end it just doesn’t really work for me. Keeping it at 100 is best for me.
I run most settings on ultra, have Gsync enabled and vsync locked at 30 (I’m still experimenting with vsync and had it off for a while, but yesterday I hit very dense clouds over the UK and got a lot of render latency, switched on vsync again and all was fine and smooth).
Thanks all once again… So to clear things up the resolution is 3440×1440 and not 1440p (that was an error on my part).
I will keep the render scaling down and perhaps load up some of the other settings in a bid to make things smooth / less jerky. The increased render scale did a great job of that but at the cost of stability.