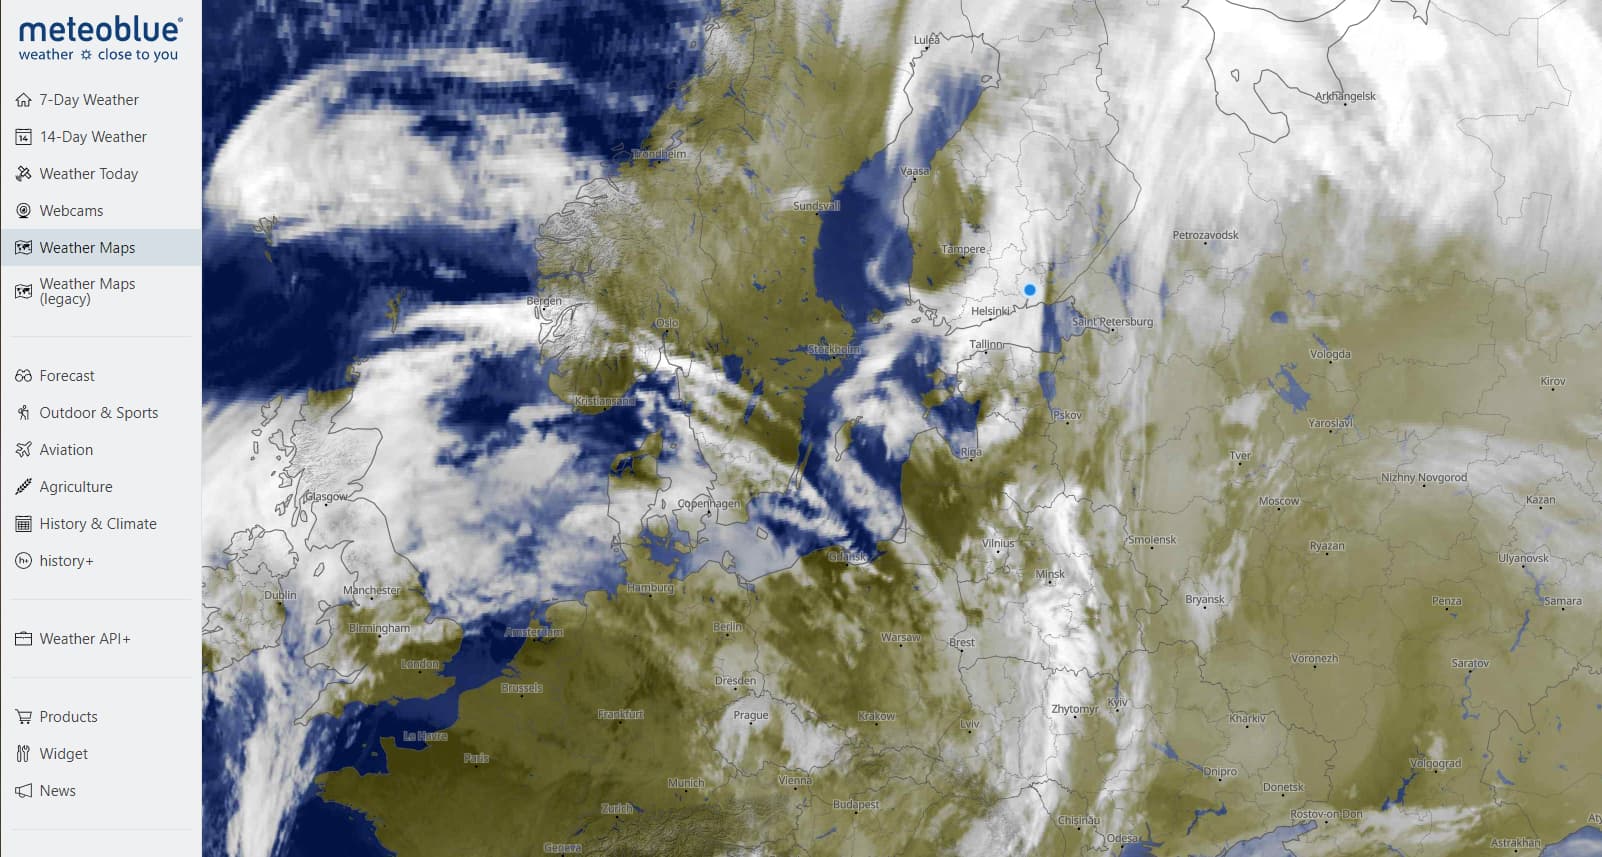
I just collaborated with @perrry to look at the clouds over southern Finland in the sim currently. The test location was near latitude 60.8N and longitude 26.66E. The satellite image from Meteoblue shows cloud cover over the area, but the detail is not sufficient to see the different cloud layers clearly:
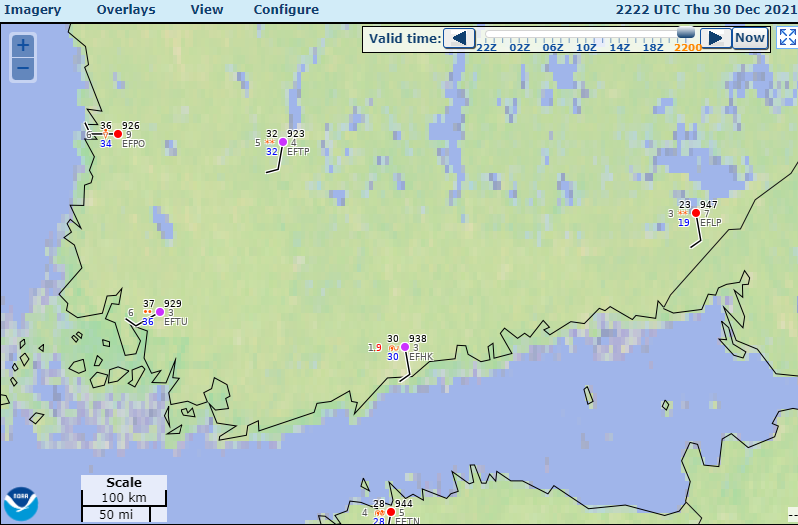
The nearby METARs are all reporting overcast skies with low ceilings:
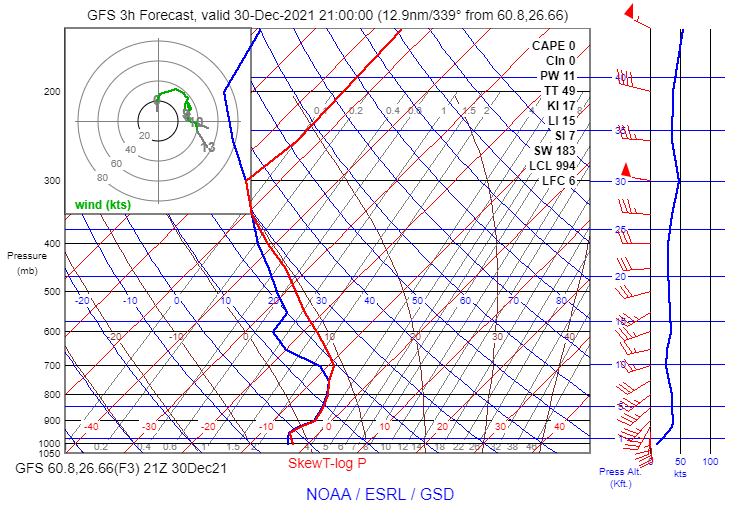
The 21Z GFS model forecast sounding shows a stable saturated layer extending upward toward 7,400 ft. MSL or so:
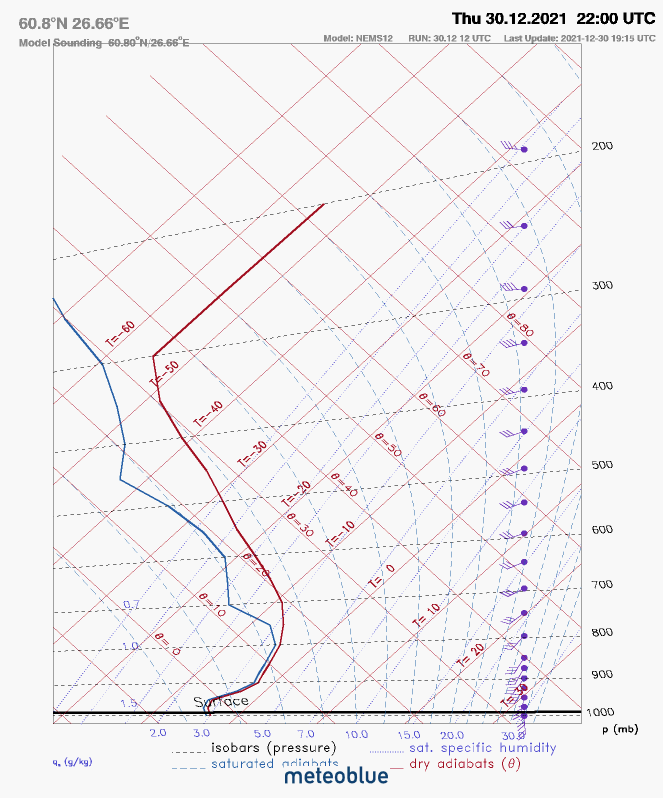
This is quite similar to the NEMS 12 sounding at 22Z available from Meteoblue:
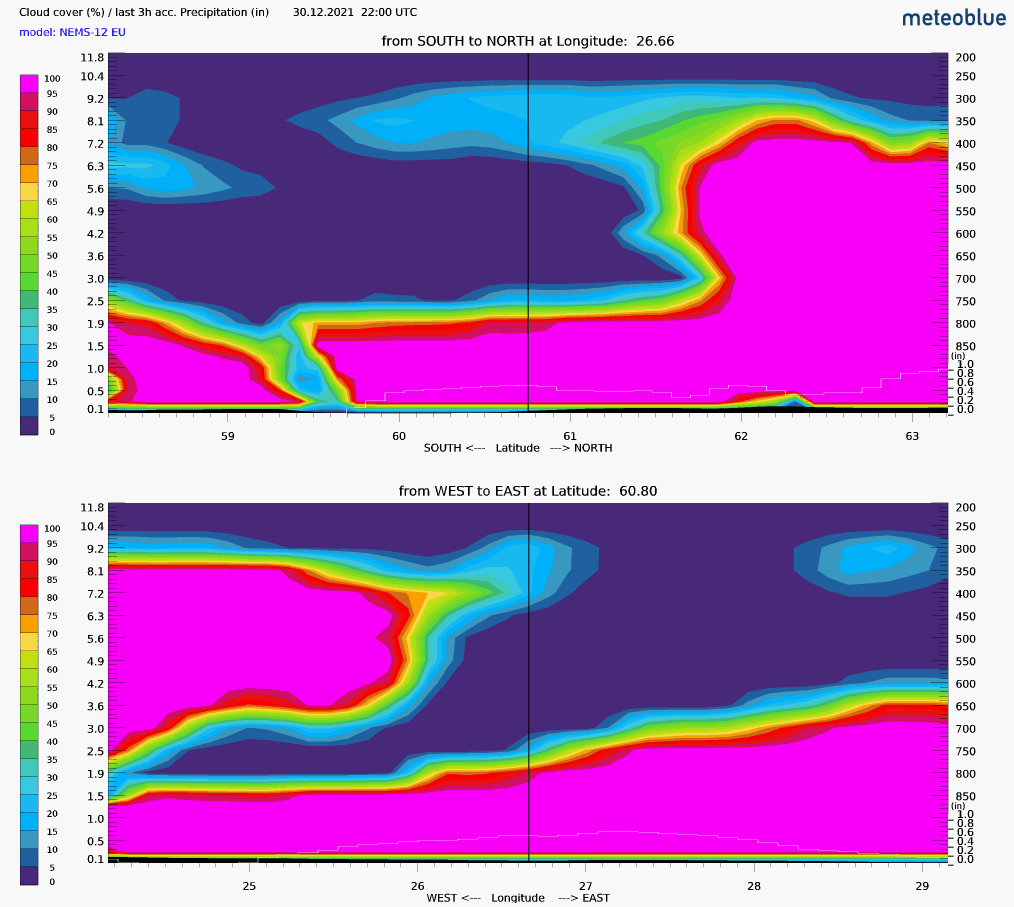
The NEMS 12 cloud cross-section from Meteoblue shows overcast cloud cover in the area, with a thickness similar to the saturated layer shown on the soundings:
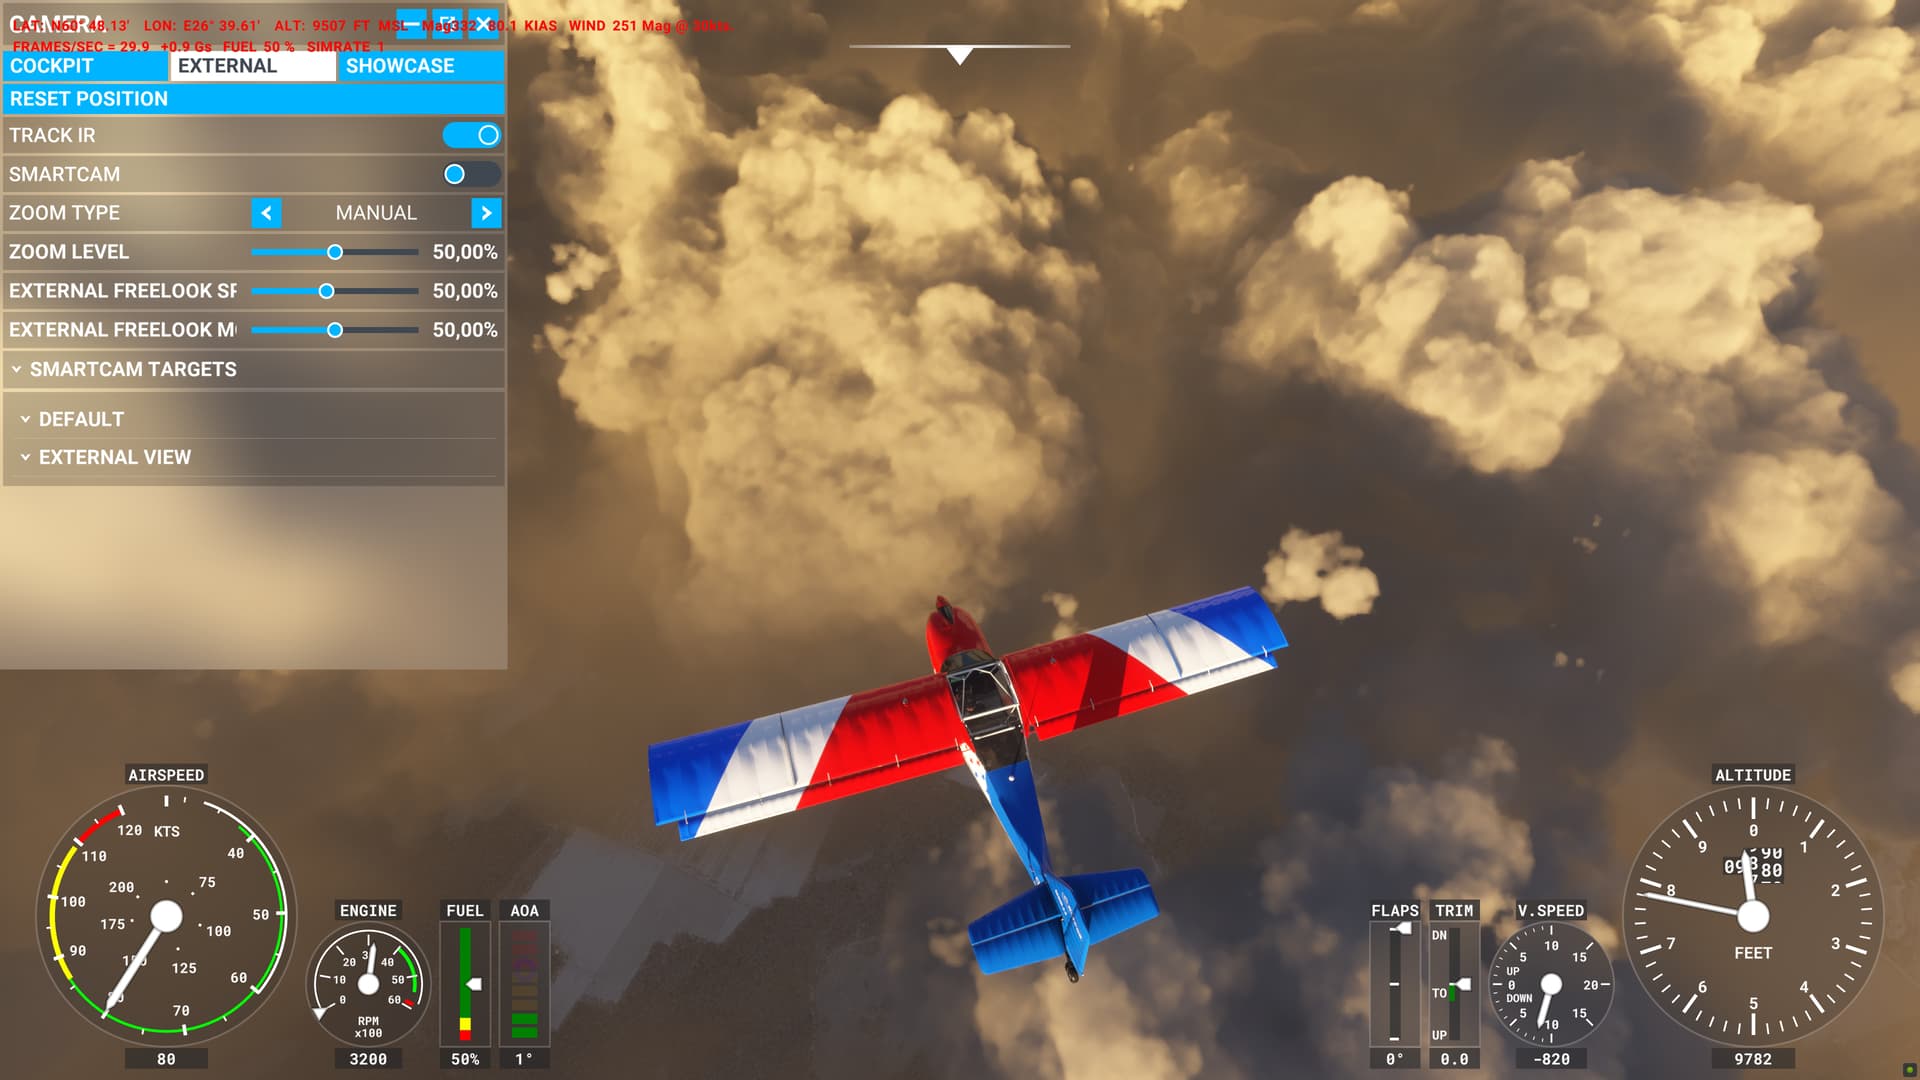
In the sim, Perrry observed the following conditions (using the latest Beta version):
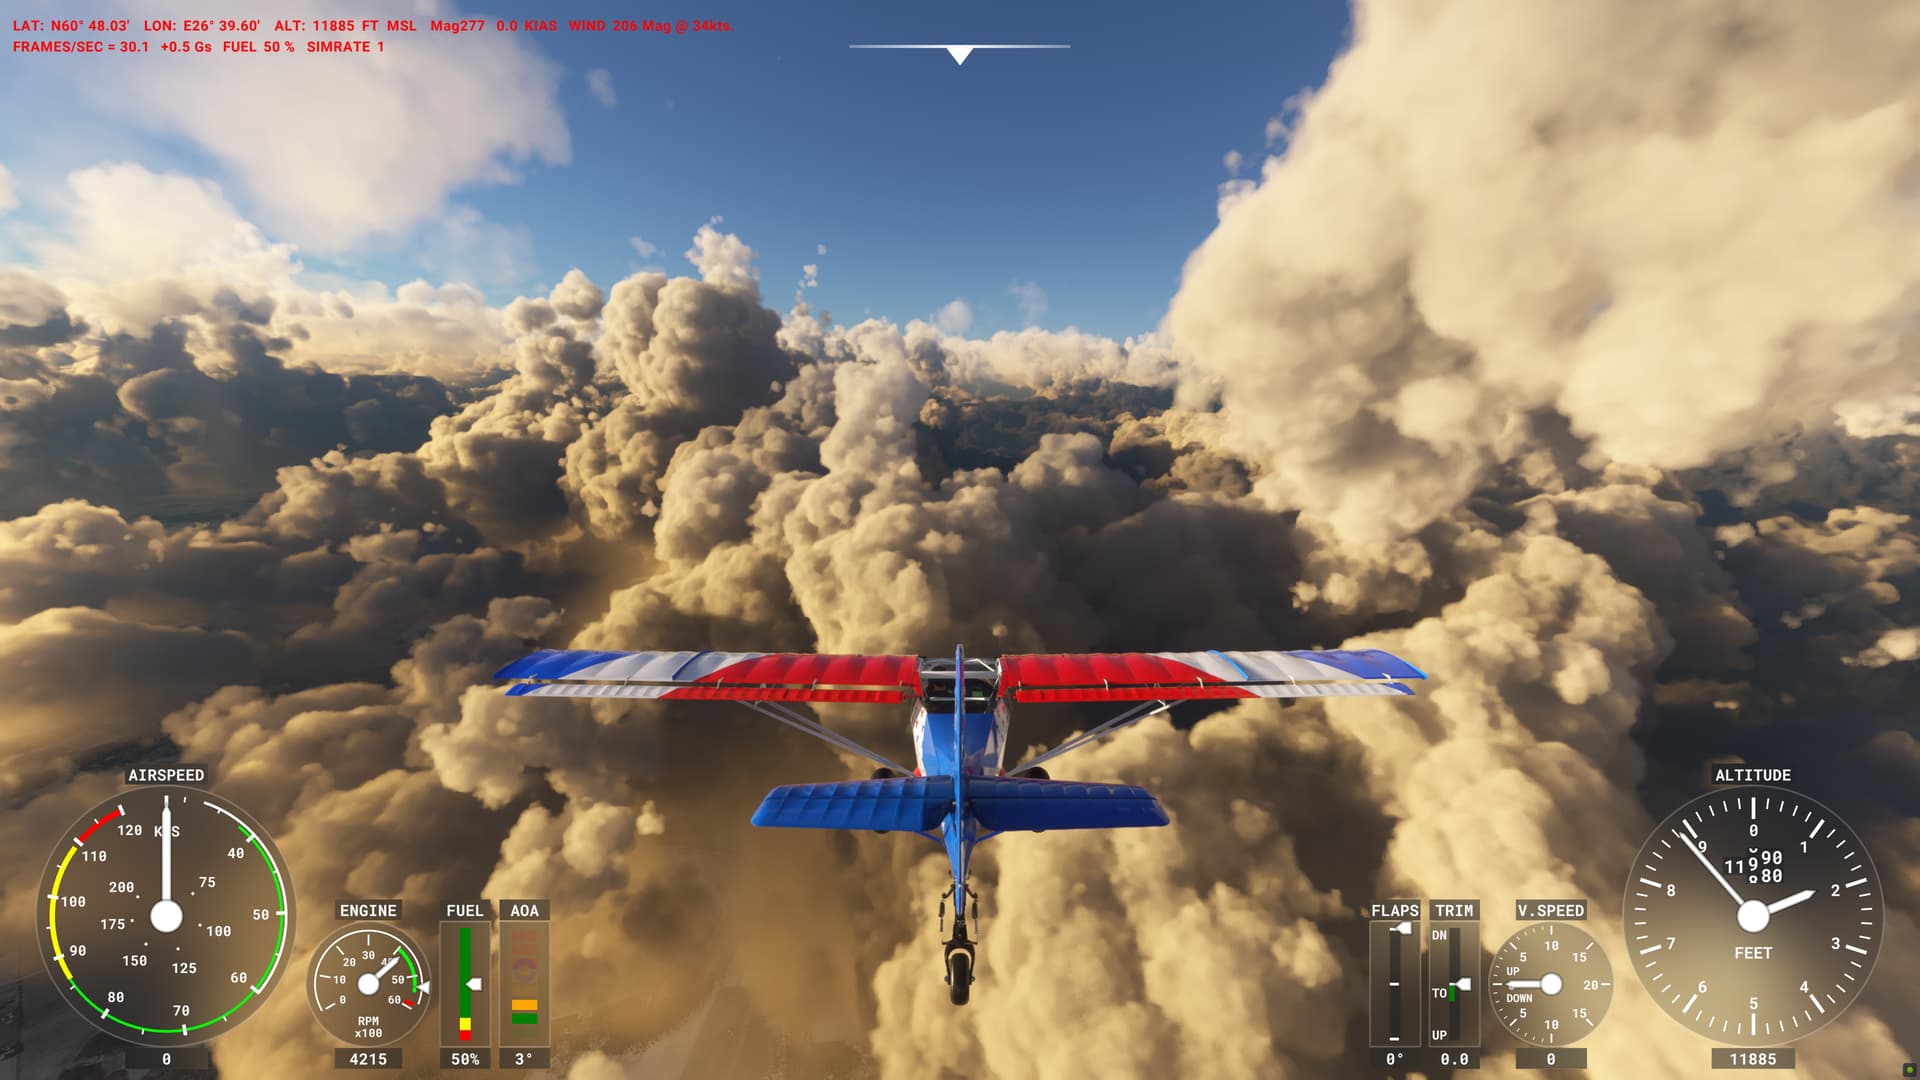
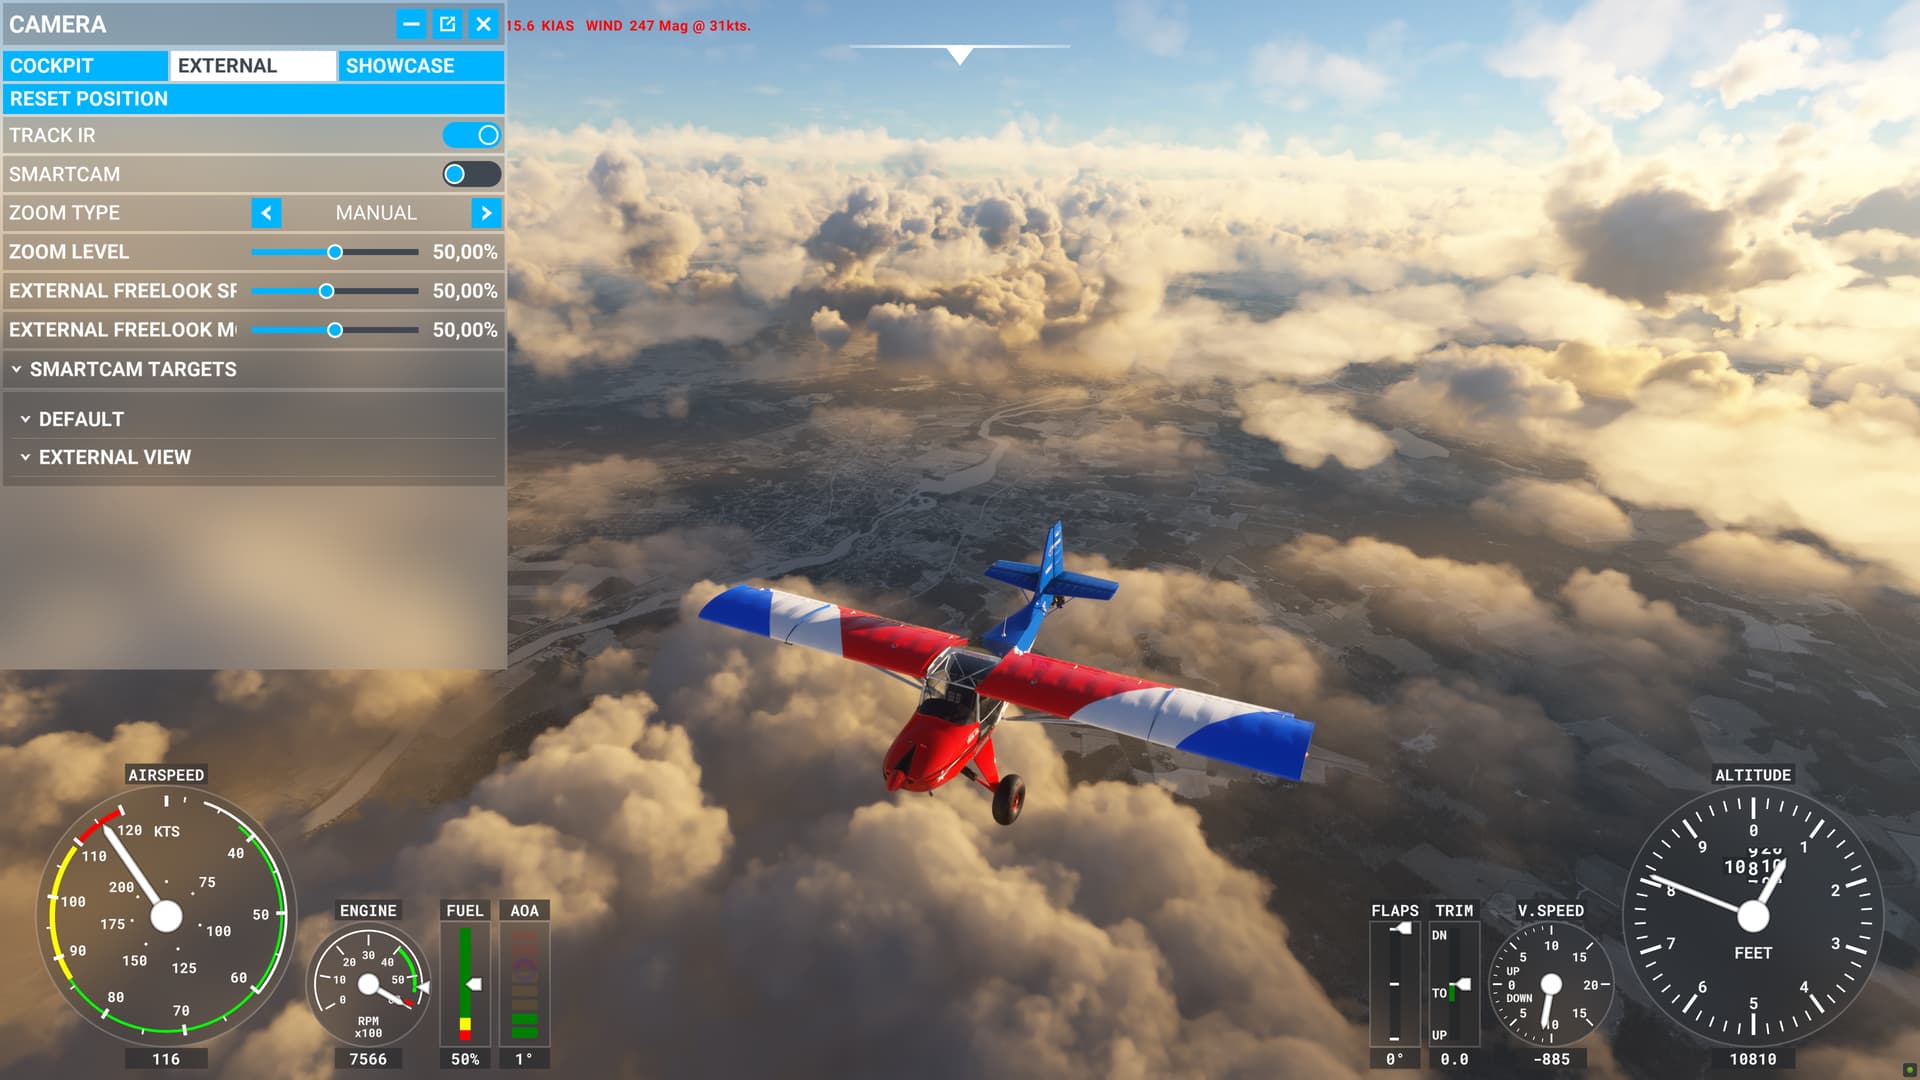
These clouds look very convective – inconsistent with the stable temperature profile in the soundings. Other screenshots show that the coverage was apparently less than 100% (although there are thin clouds covering some of the patches where the ground is visible):
My tests in the original post showed that a thick cloud layer with less than 100% coverage will look convective due to the default pattern the sim is using for clouds. The only way to tone down the convective appearance is to reduce density significantly below 1. But if the density is reduced, the translucence of the clouds will be even worse (the ground will still be visible after climbing a few thousand feet into the cloud).
I’m not sure why the sim didn’t draw 100% overcast here. METAR blending is apparently not to blame, because all the nearby METARs were reporting overcast. The model data also indicated overcast coverage. The only glimmer of a clue I can find is the thin area of lower cloud coverage in the NEMS cloud cover cross section between 59N and 60N . It’s possible that the sim is blending several nearby model data points to smooth out any sharp contrasts in the data. If that’s true, the narrow region of low coverage would be averaged over a larger area, reducing the coverage parameter below 100%.
Overall, I think this is an excellent example of the limitations of the current cloud system. The default cloud pattern features a lot of convective “bubbling.” If coverage is less than 100%, the convective bubble-like (or cauliflower-like) formations will become visible in the gaps between clouds. To draw a thick cloud layer with truly stratiform characteristics, the coverage either needs to be 100%, or the density needs to be reduced a lot to smooth out the convective appearance. Lower density produces unrealistically good visibility inside the cloud, though.
Ultimately, due to examples like this, I suspect that a second default cloud pattern is necessary for low-level clouds. If the atmosphere is stable, there should be a stratiform cloud default that is far less noisy and bubbly.