Investigating How MSFS Draws Clouds for Weather

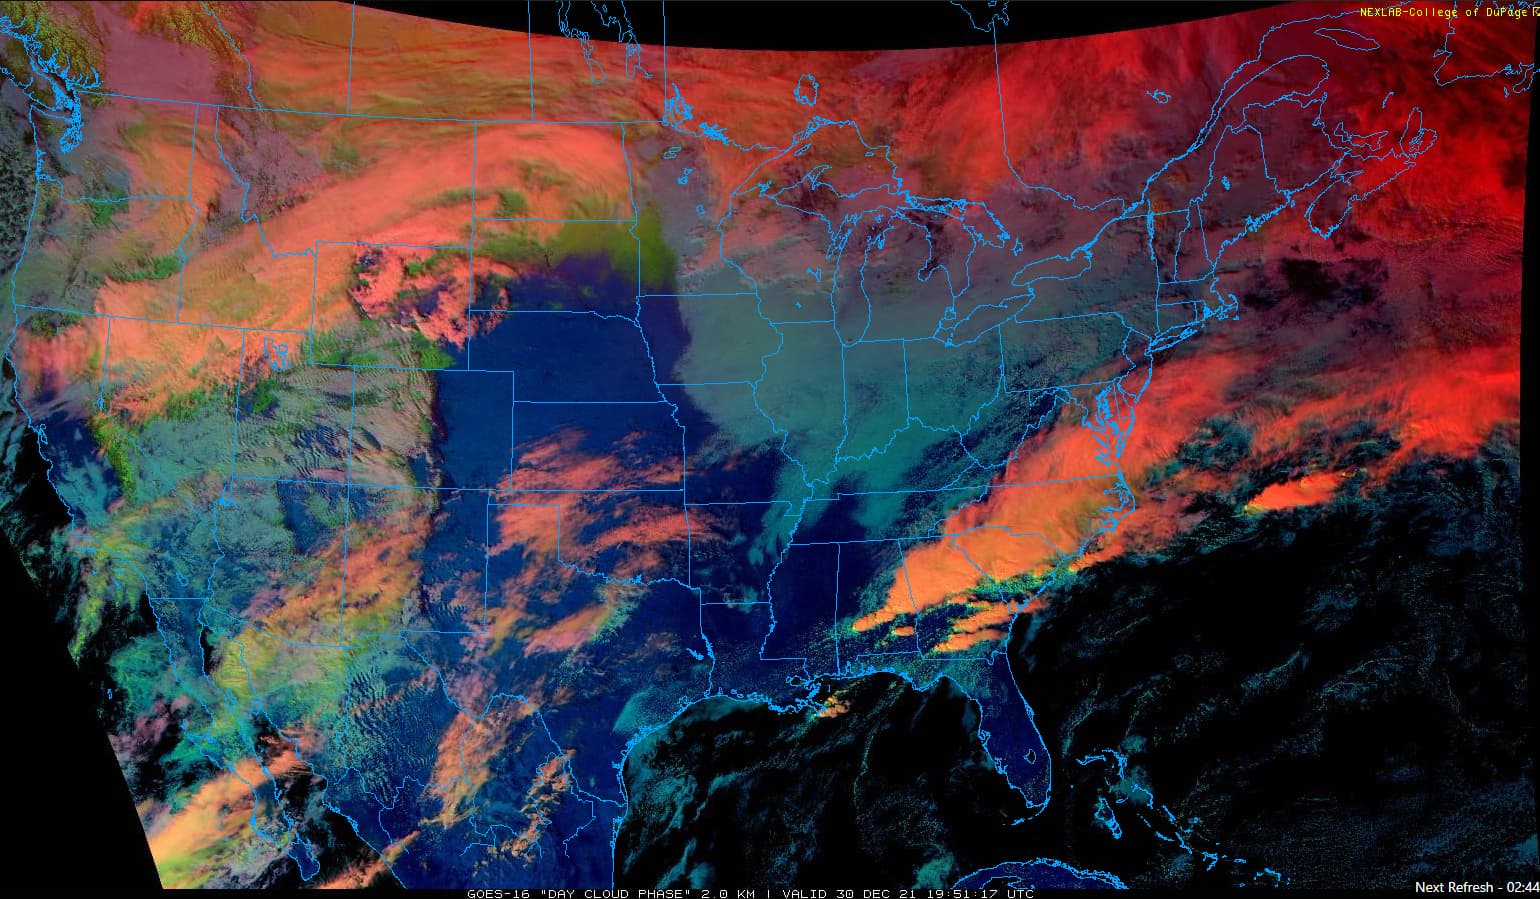
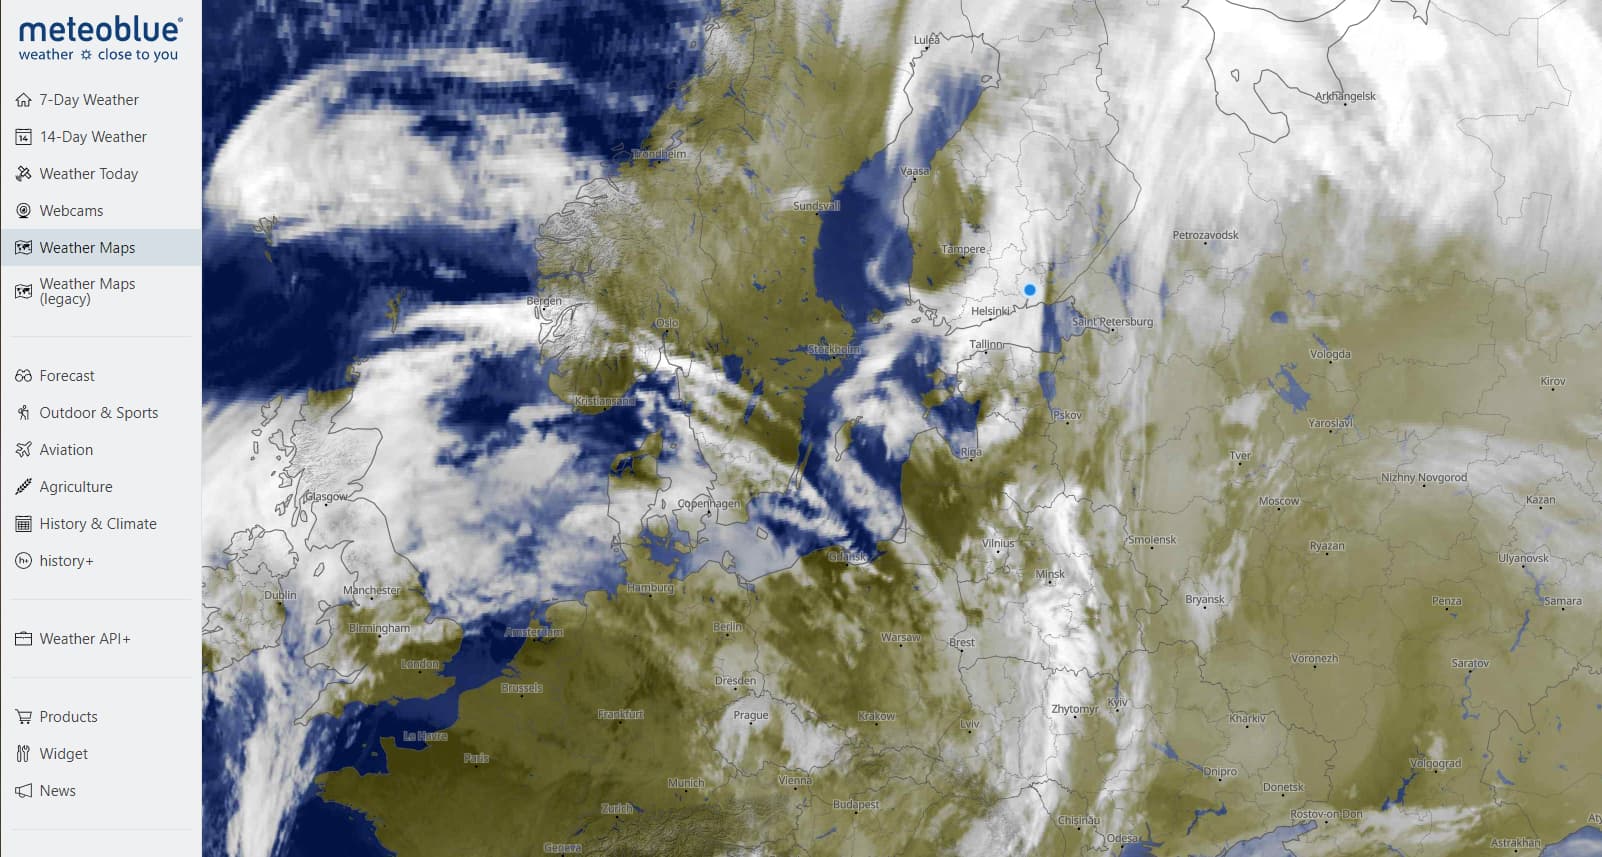
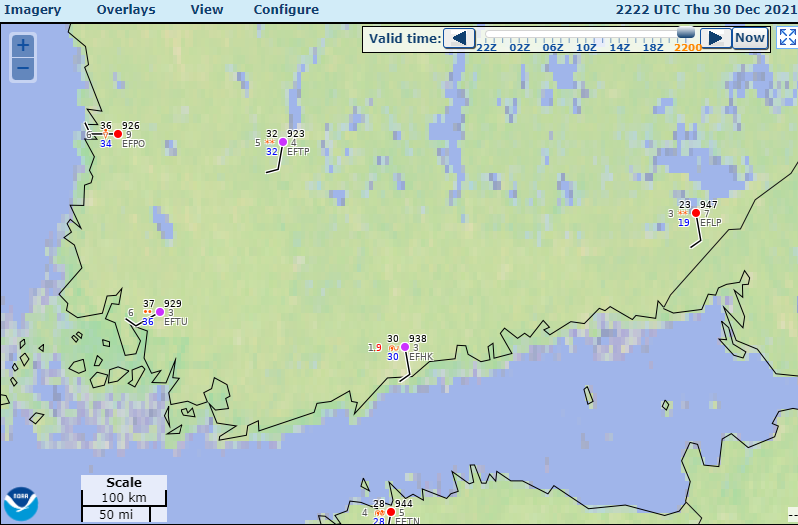
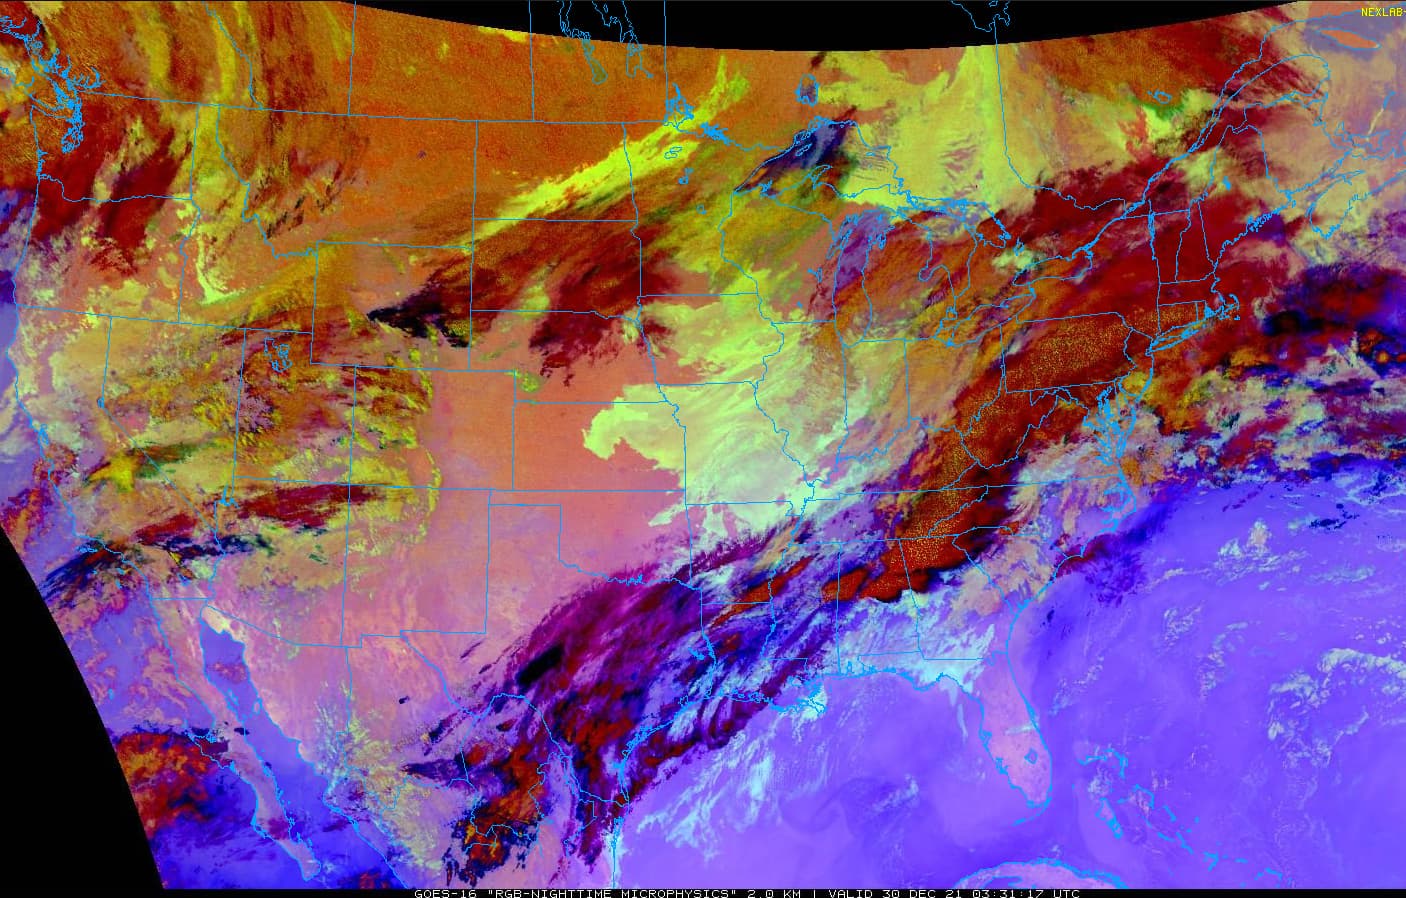
I tried two more test locations tonight: Saint Louis, Missouri (KSTL), and Memphis, Tennessee (KMEM). The nighttime microphysics satellite image shows a broad region of stratus over Saint Louis and the animated image showed stratus near Memphis also (but the edge of the stratus deck was nearby).

Beginning with Saint Louis, the recent METARs show a persistent low ceiling:

KSTL 300344Z VRB04KT 2 1/2SM BR OVC005 03/01 A2990 RMK AO2 T00330011
KSTL 300321Z 35005KT 3SM BR OVC005 03/01 A2991 RMK AO2 T00330011
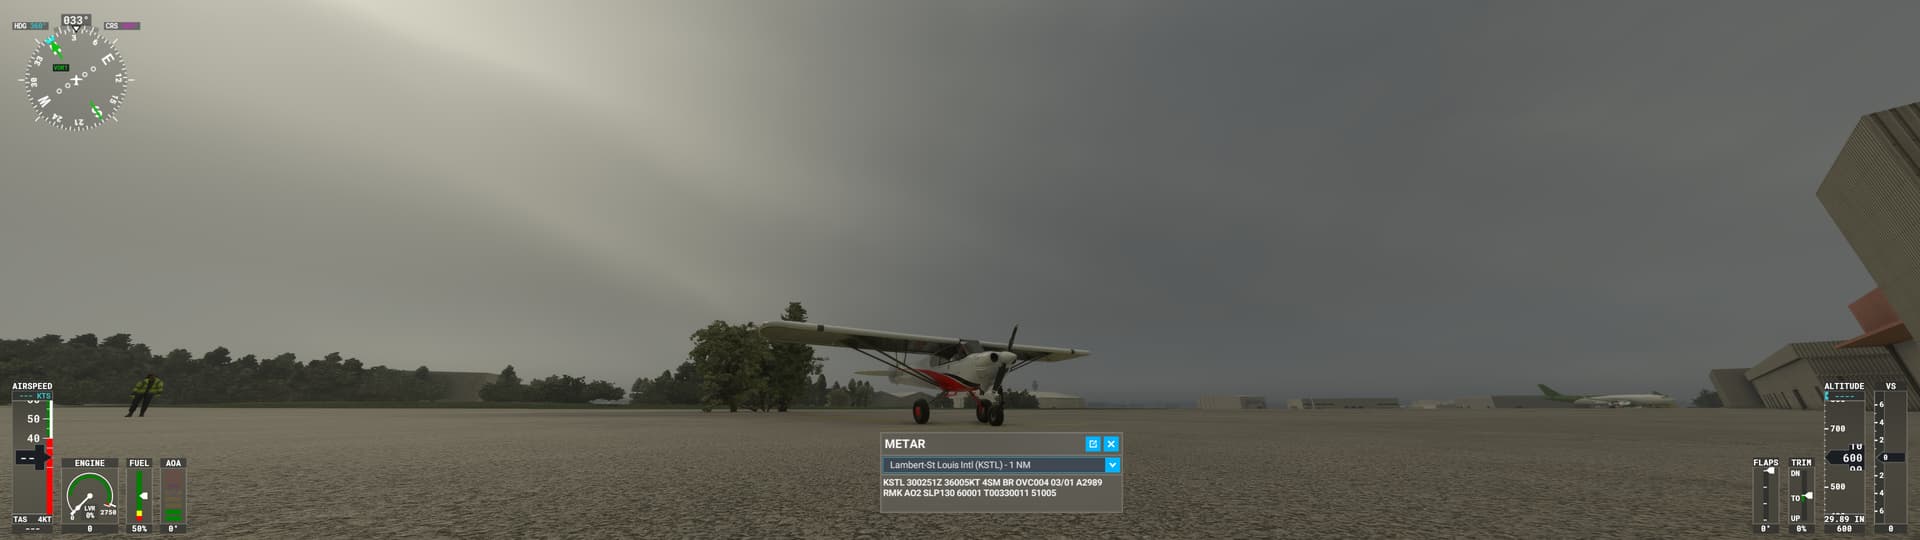
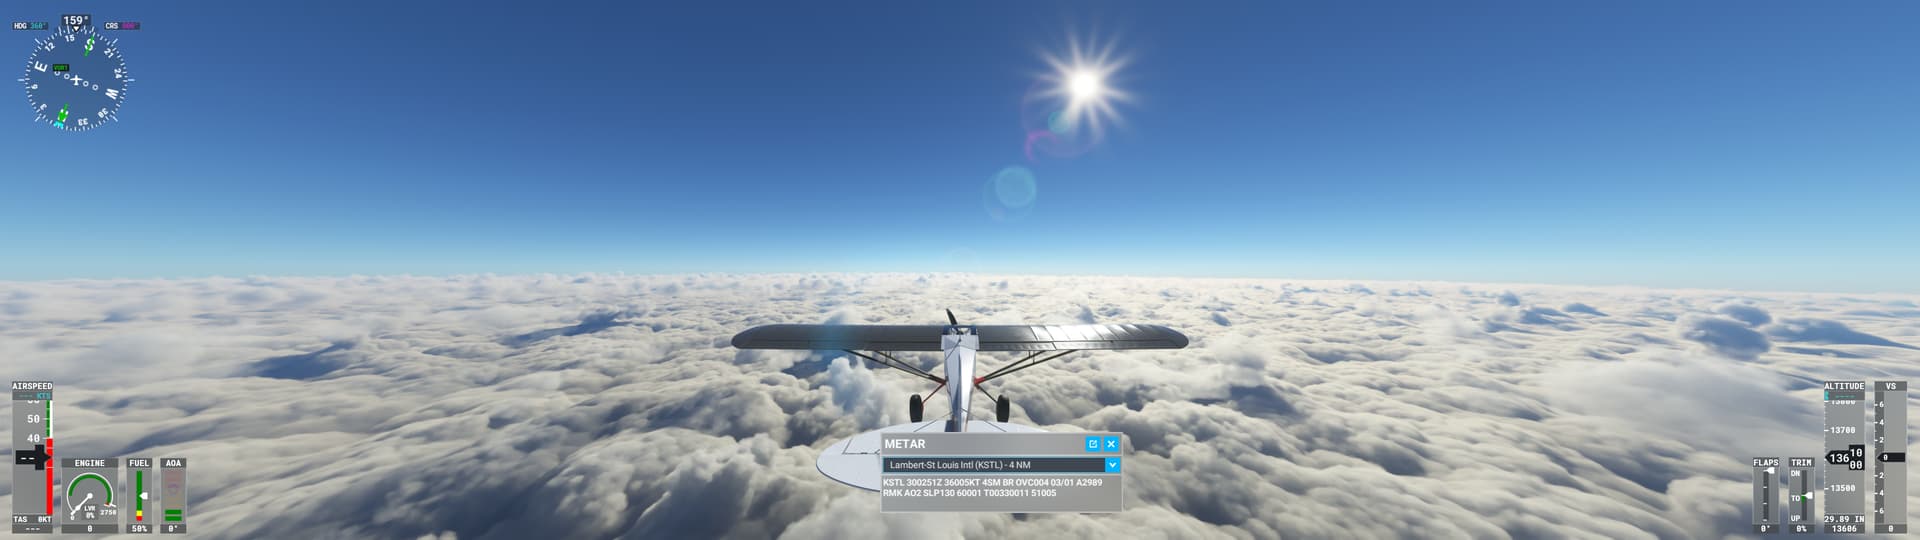
KSTL 300251Z 36005KT 4SM BR OVC004 03/01 A2989 RMK AO2 SLP130 60001 T00330011 51005
KSTL 300249Z 35006KT 4SM BR OVC004 03/01 A2989 RMK AO2
KSTL 300232Z 01004KT 4SM BR OVC005 03/01 A2989 RMK AO2 T00330011

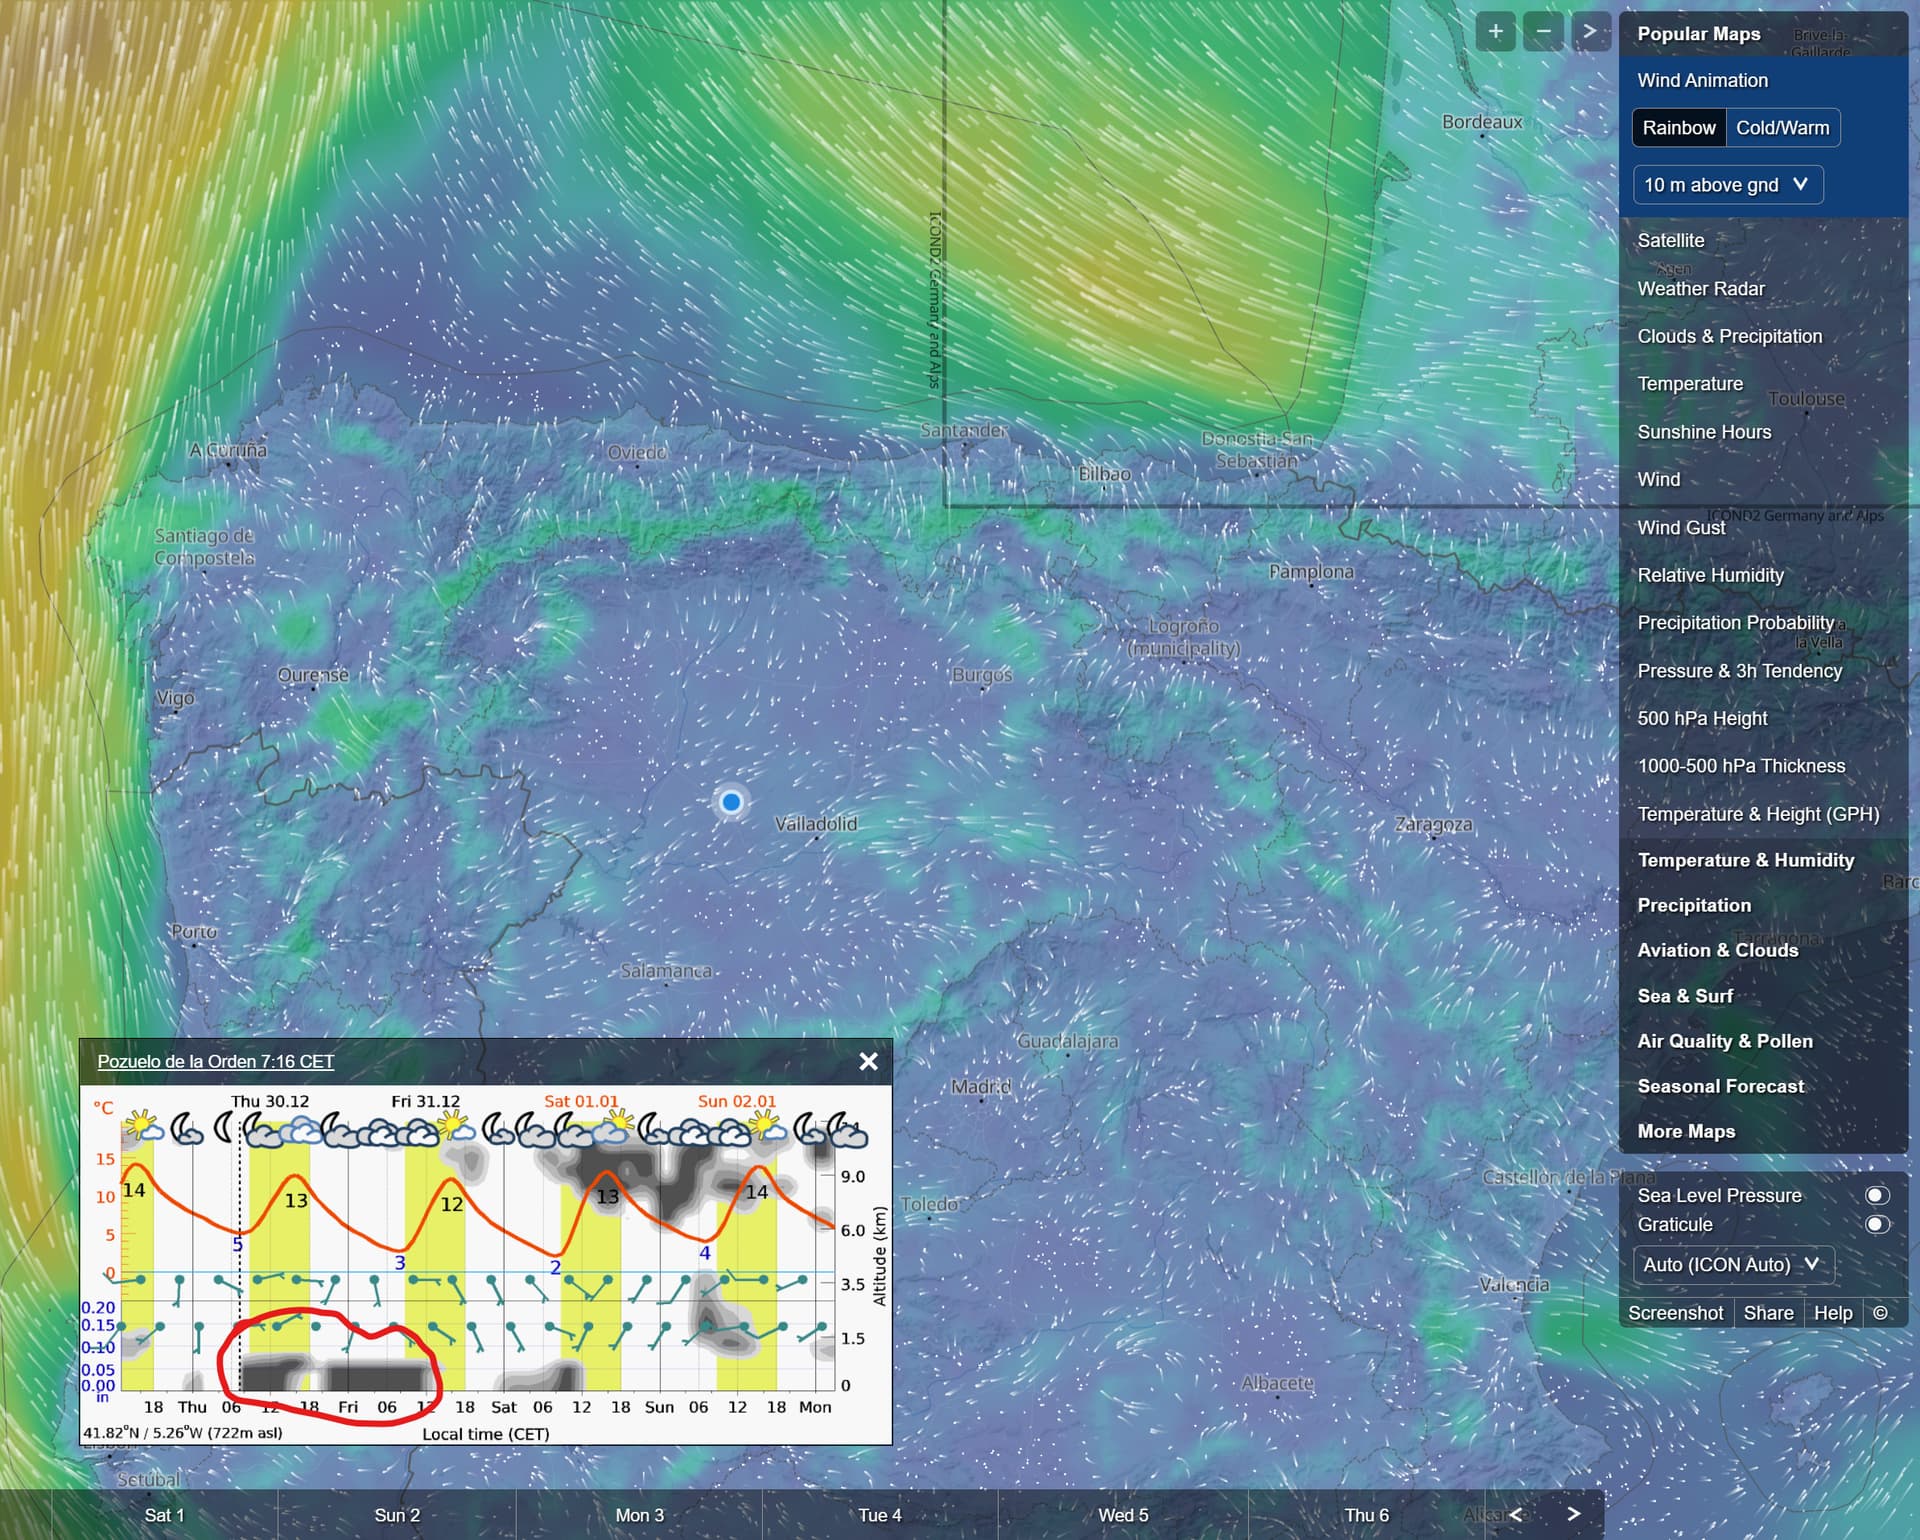
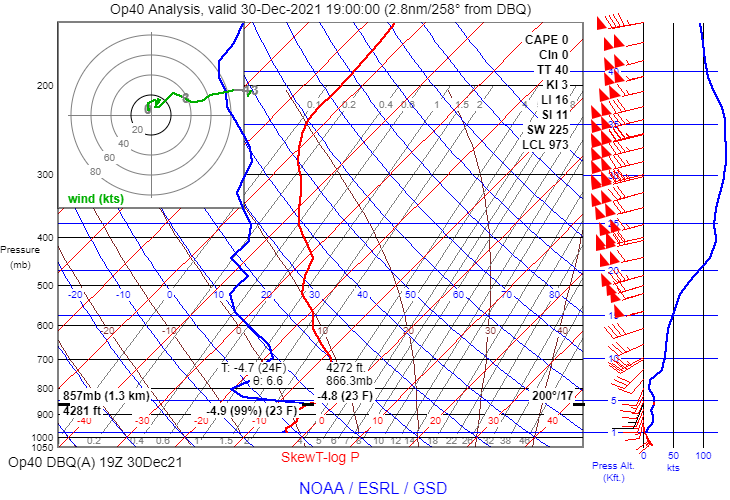
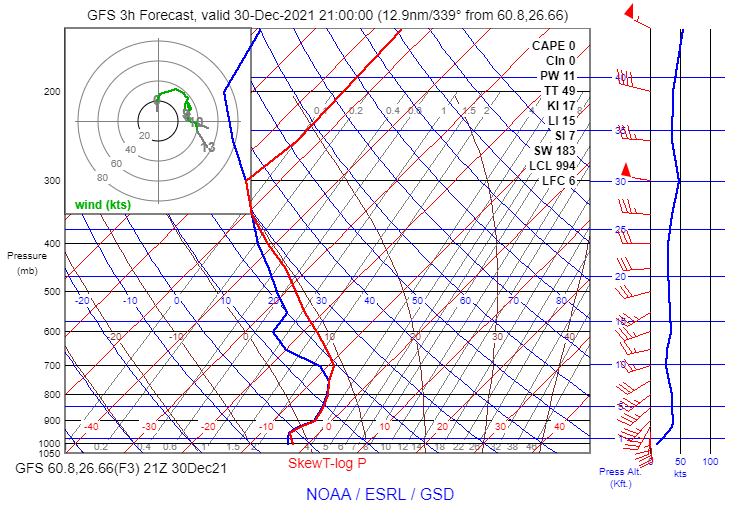
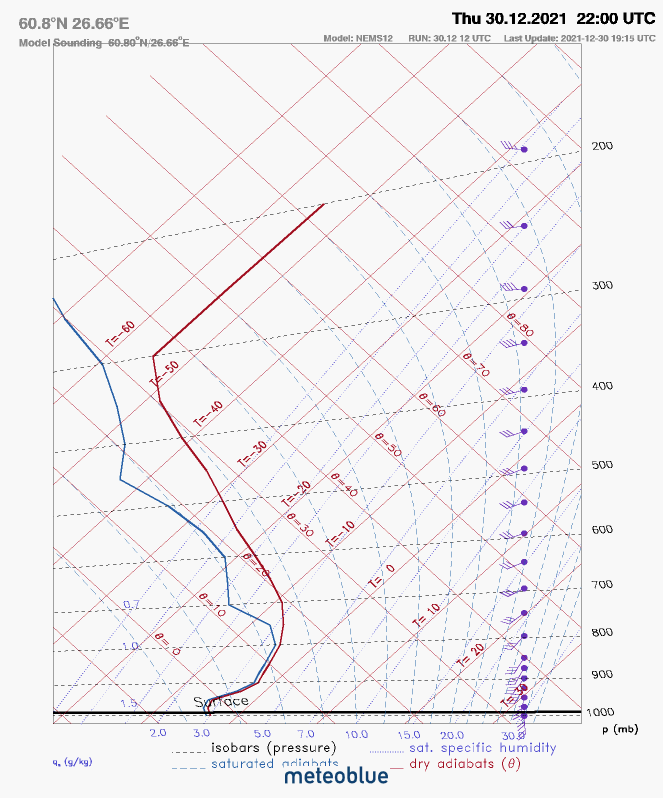
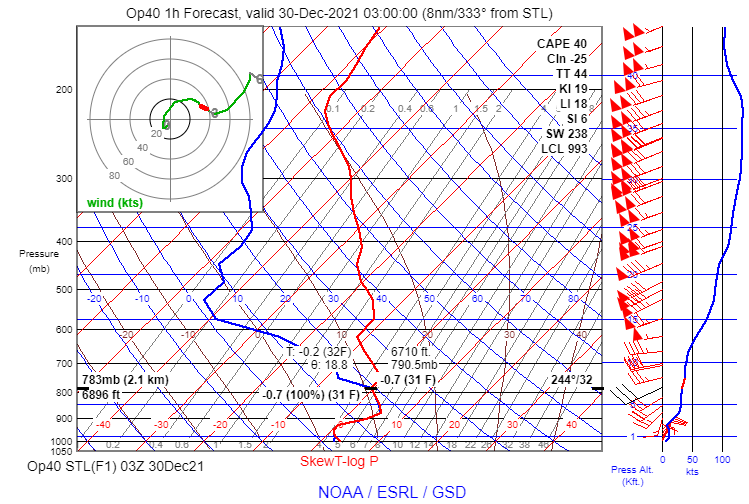
And a RAP model sounding for 03Z shows a very stable saturated layer from near the surface to almost 7,000 ft. MSL:

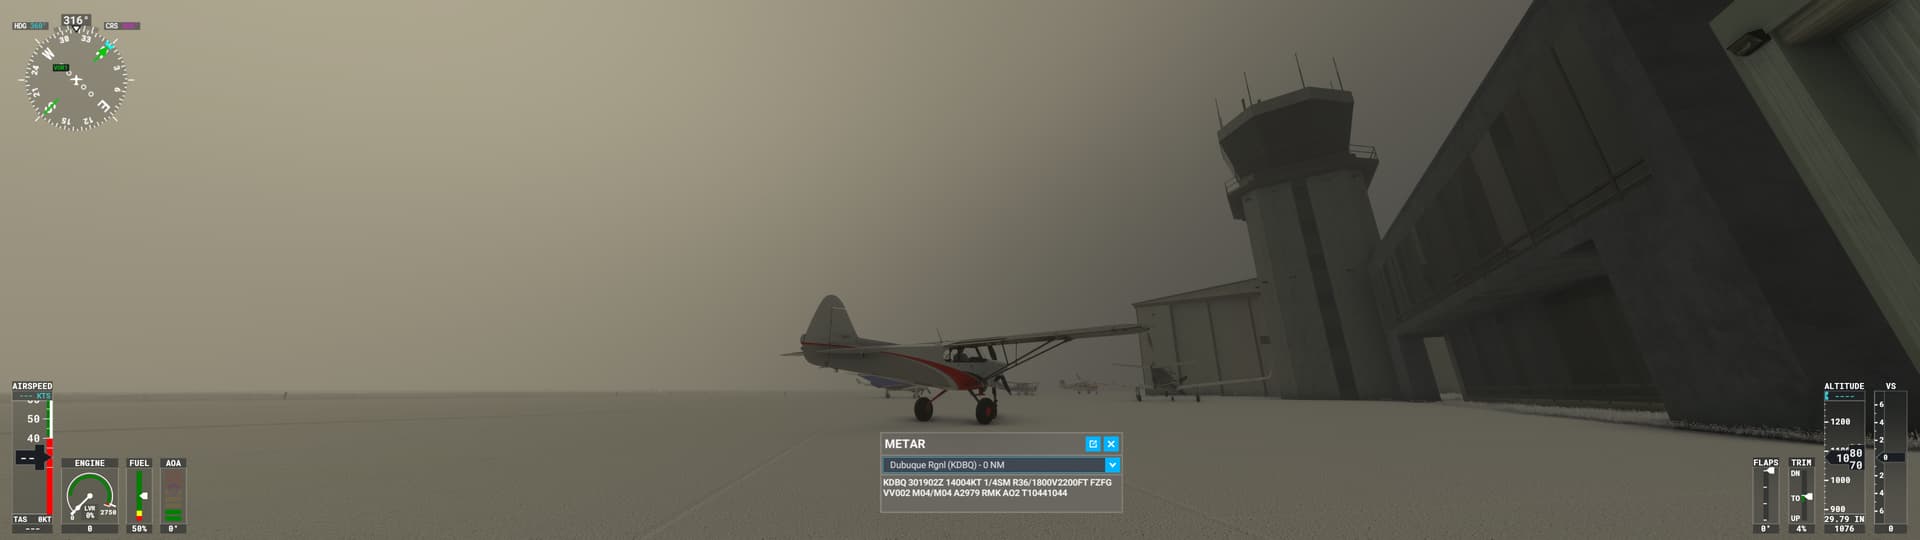
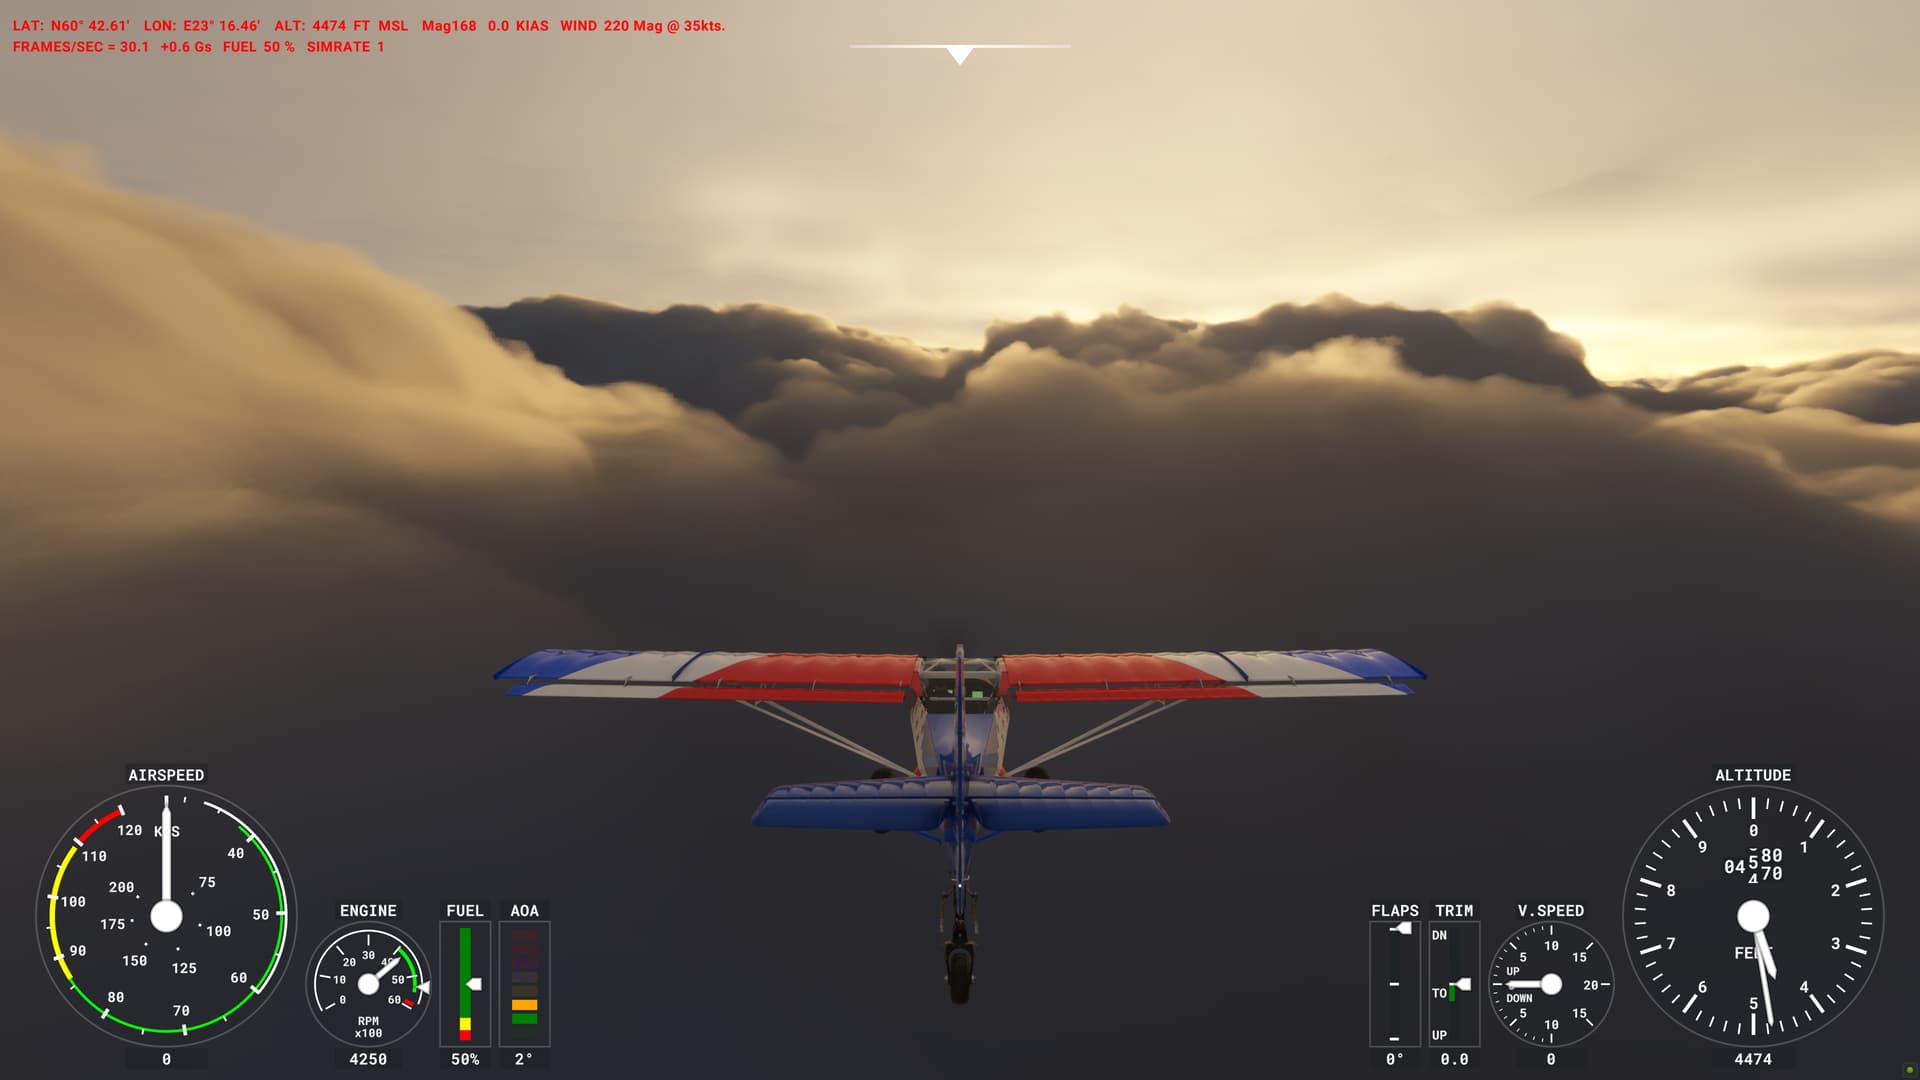
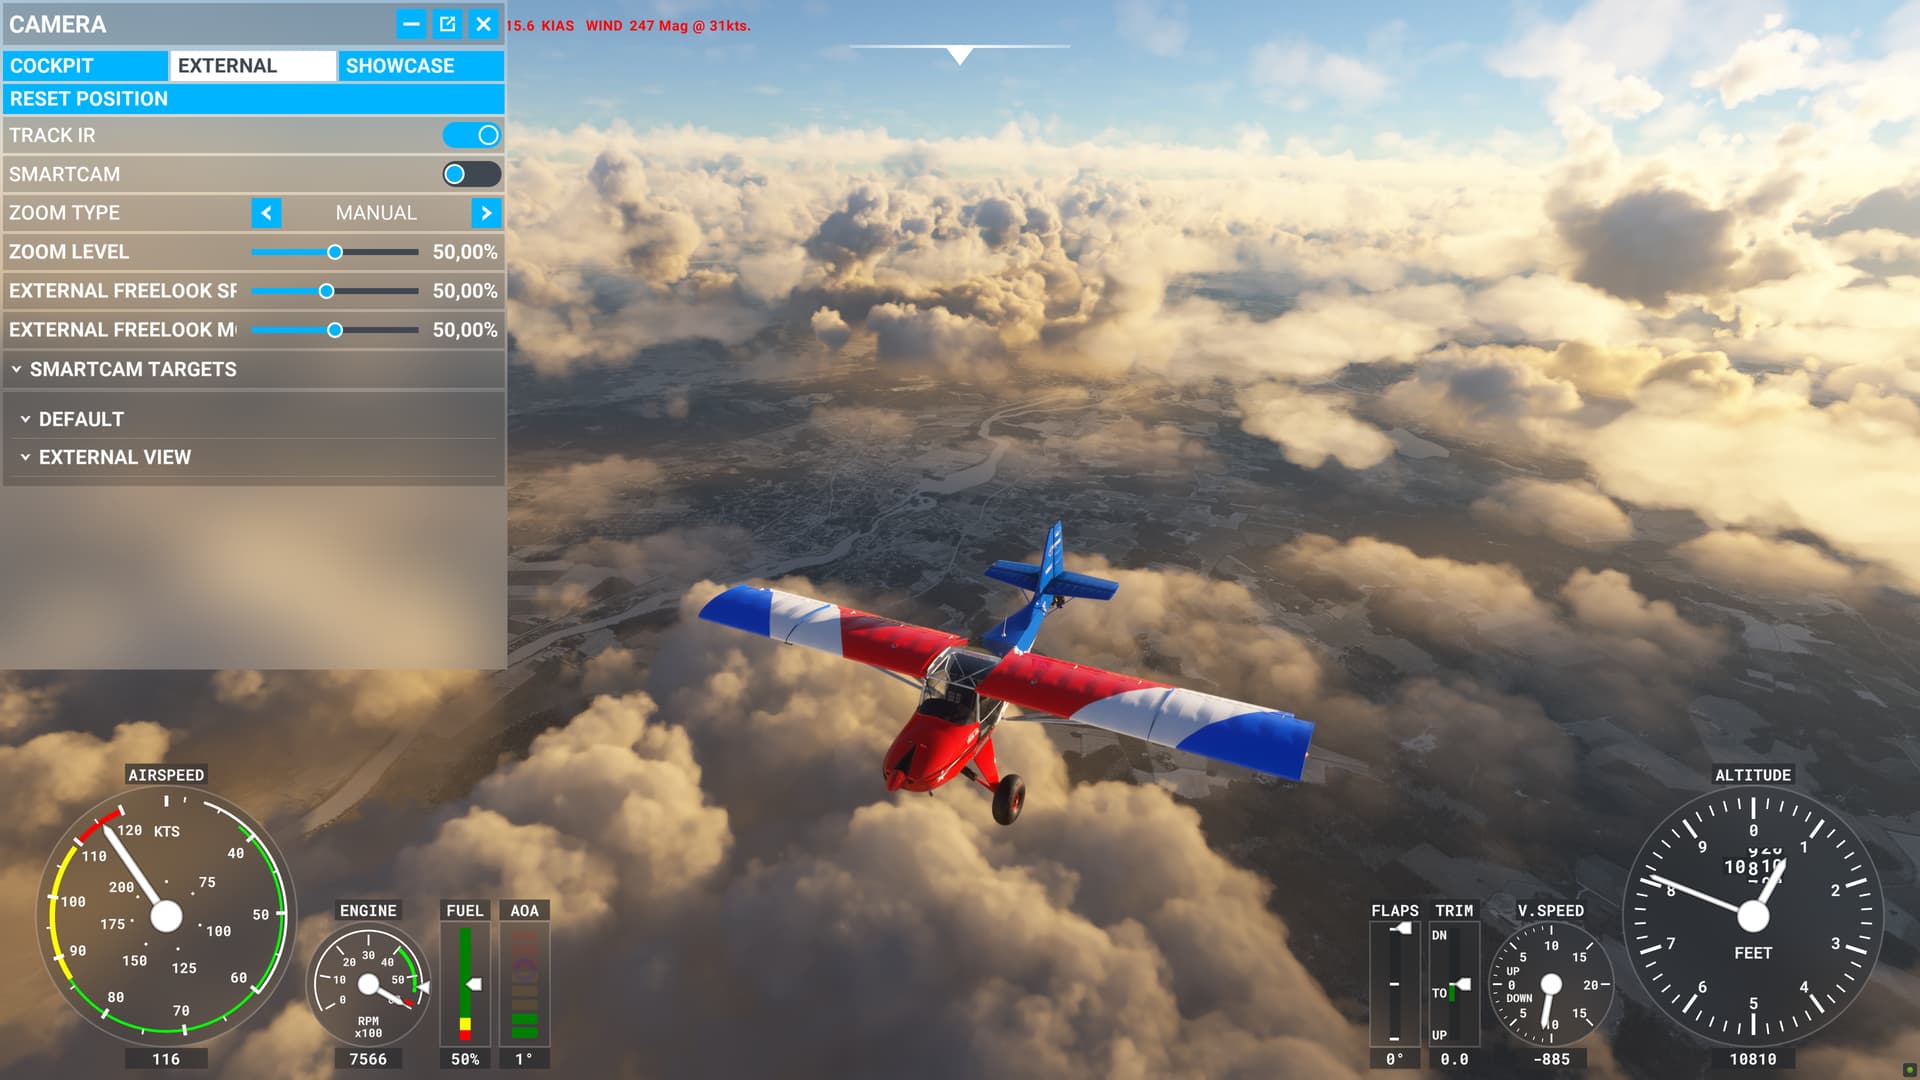
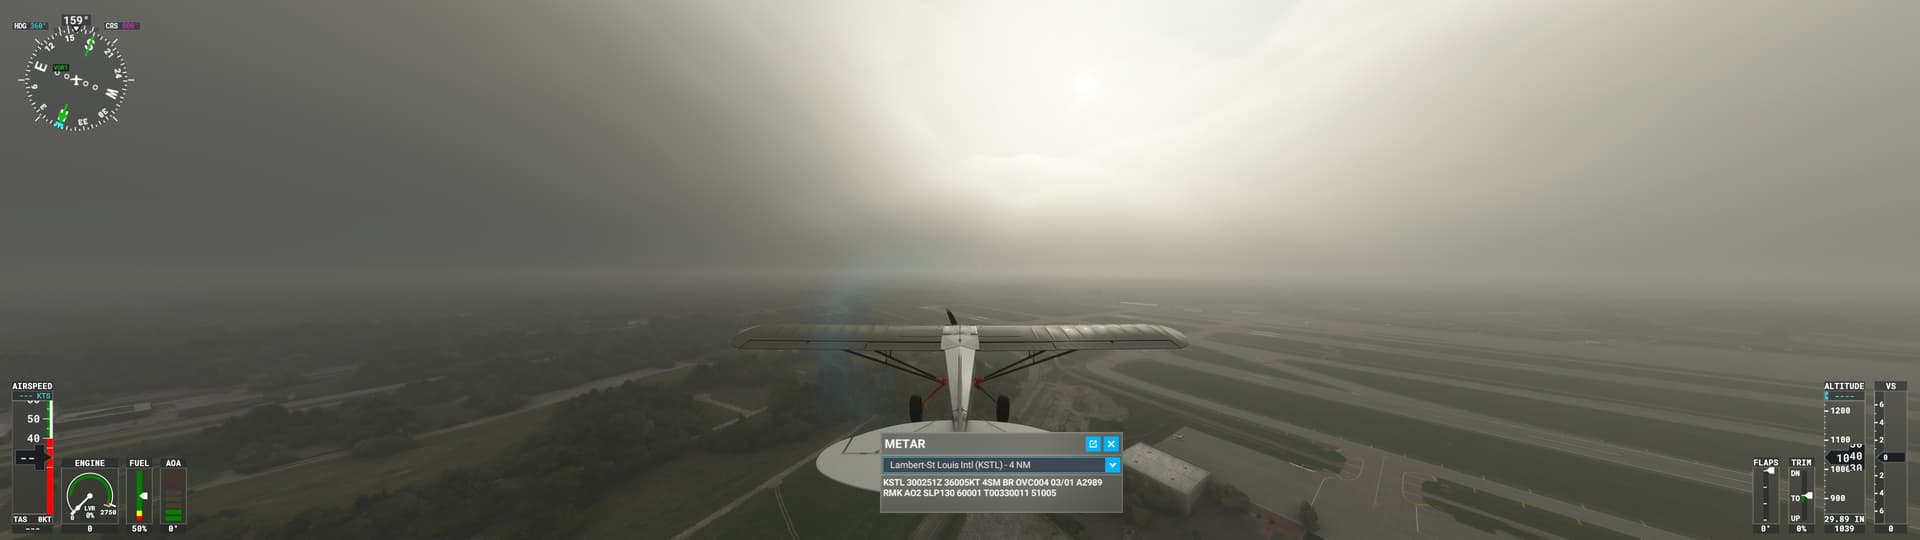
Beginning at ground level in the sim at KSTL, the overcast was very well depicted:

As I climbed into the cloud layer, the ground was still visible until approximately 2,400 ft. MSL. Here is the view at 1000 ft MSL (approximately where the cloud base should be):

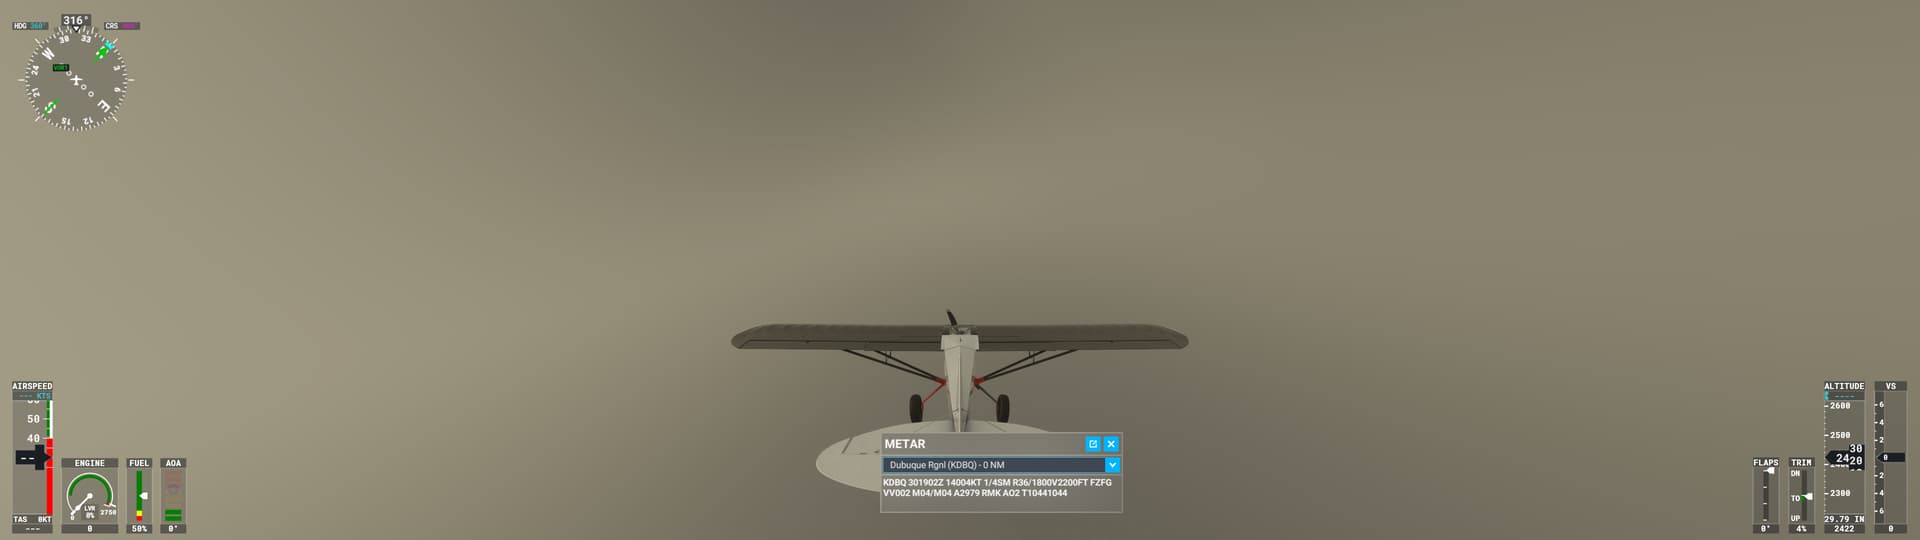
And here is the view at 2,400 ft MSL, just as the ground faded from view:

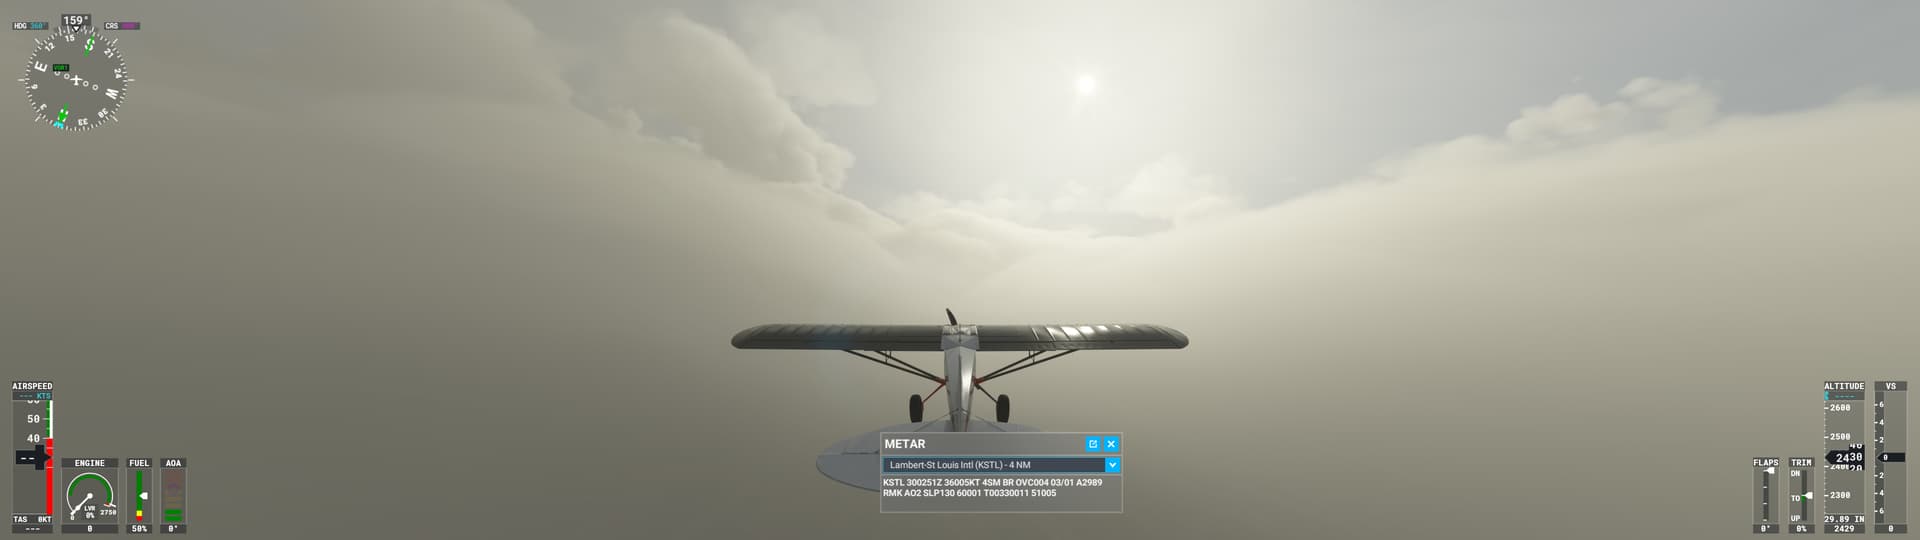
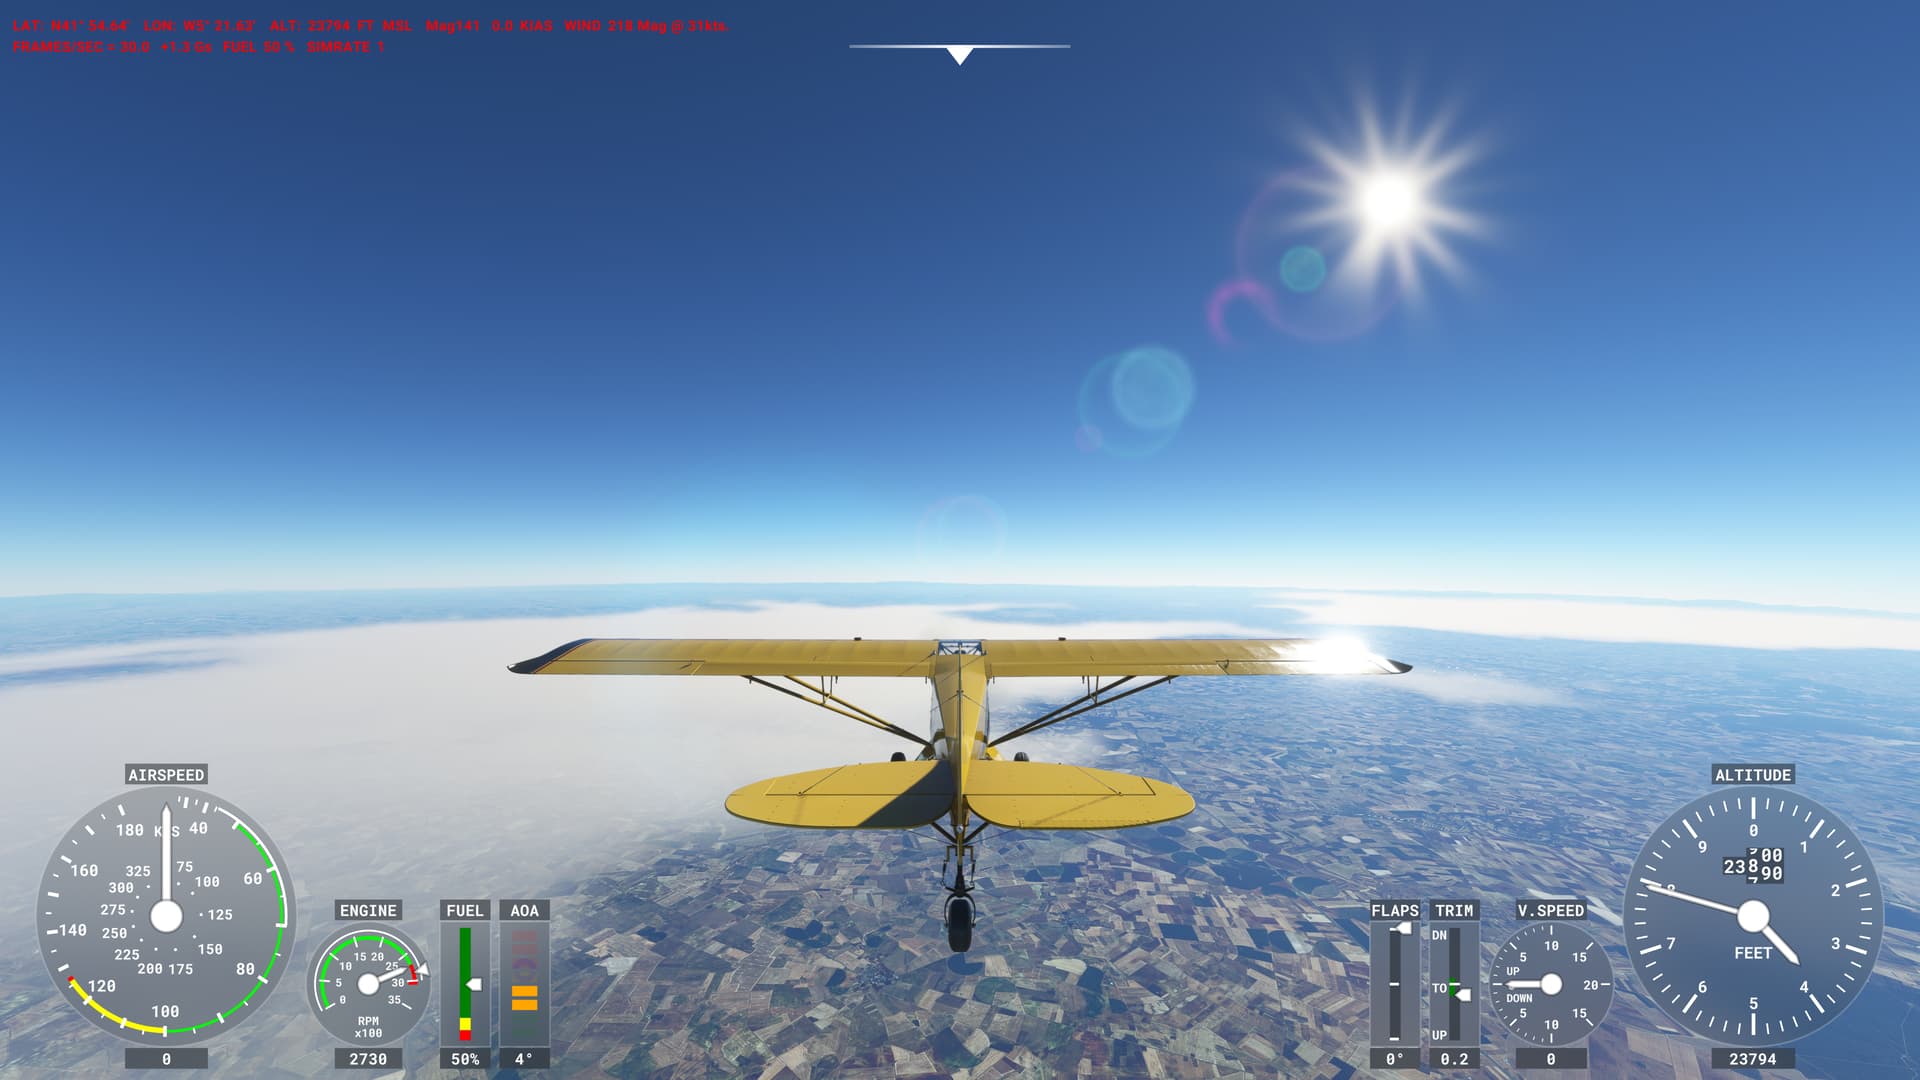
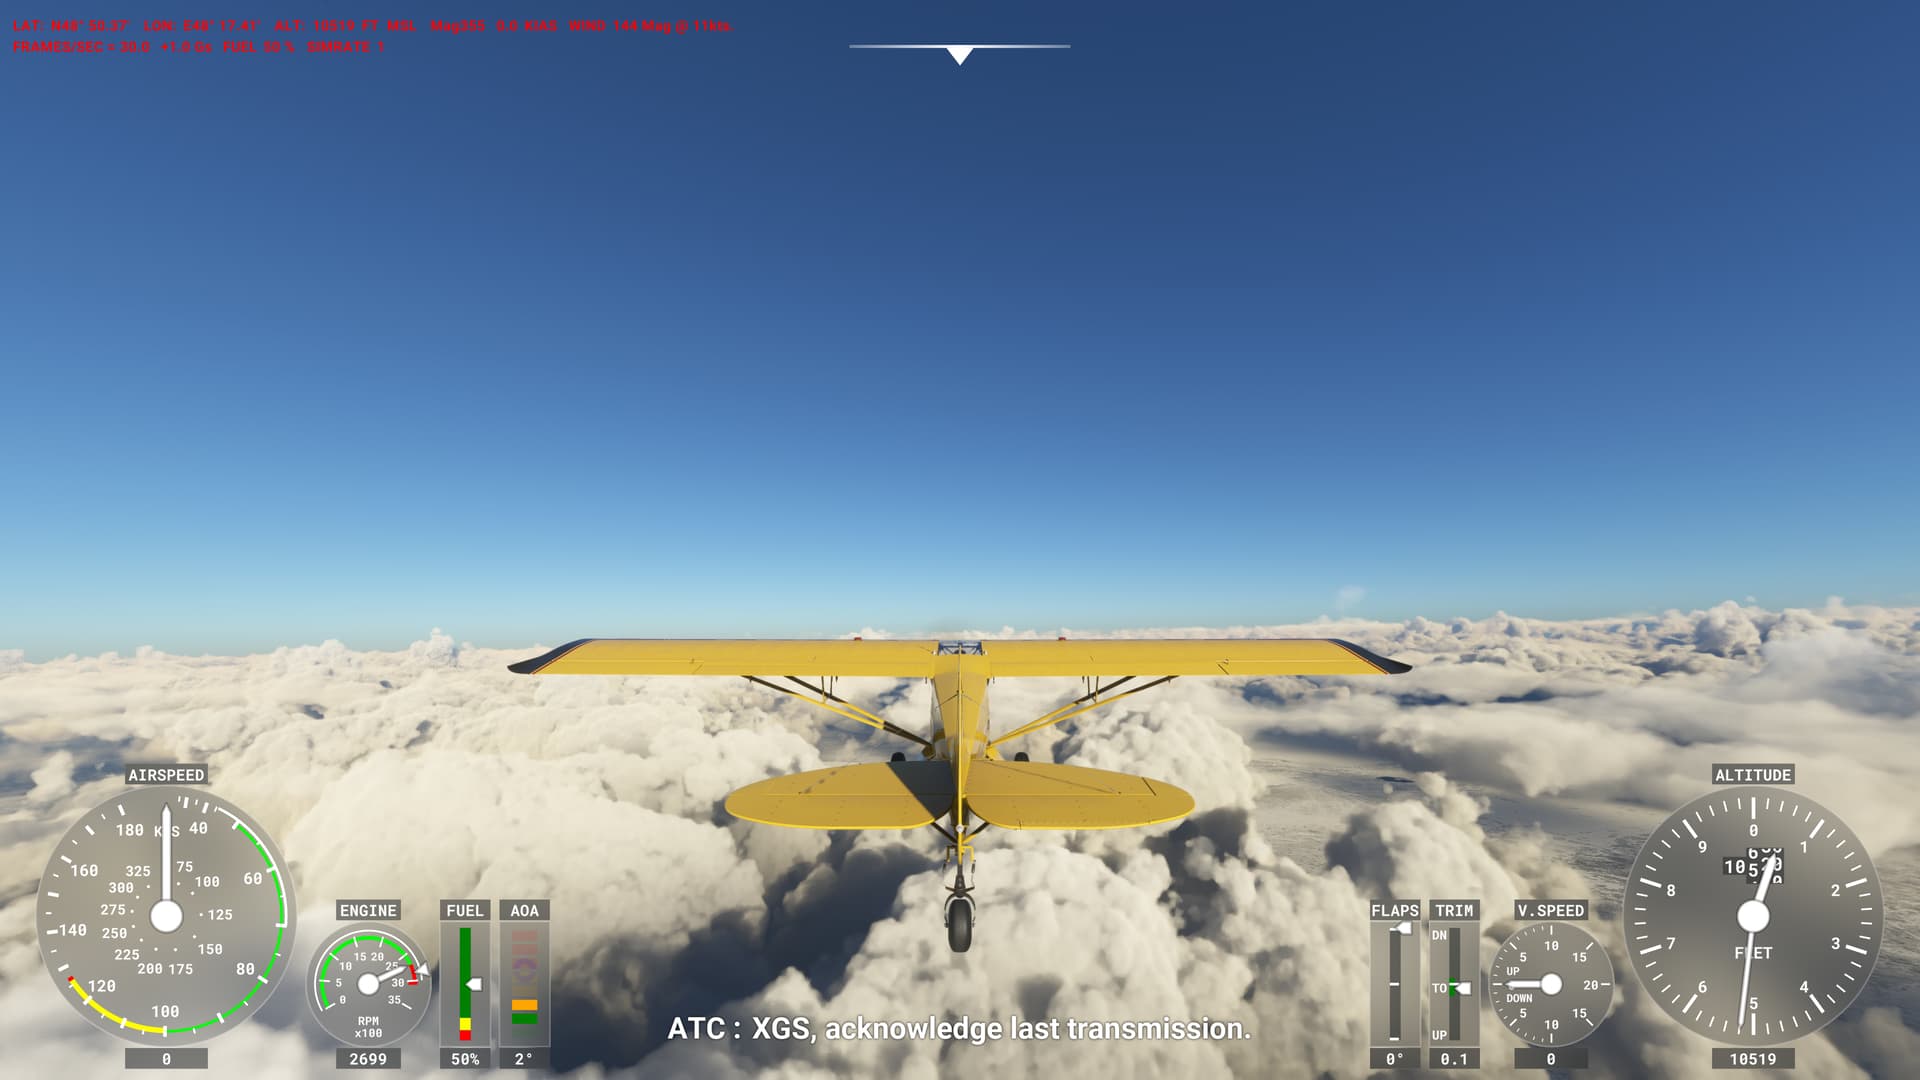
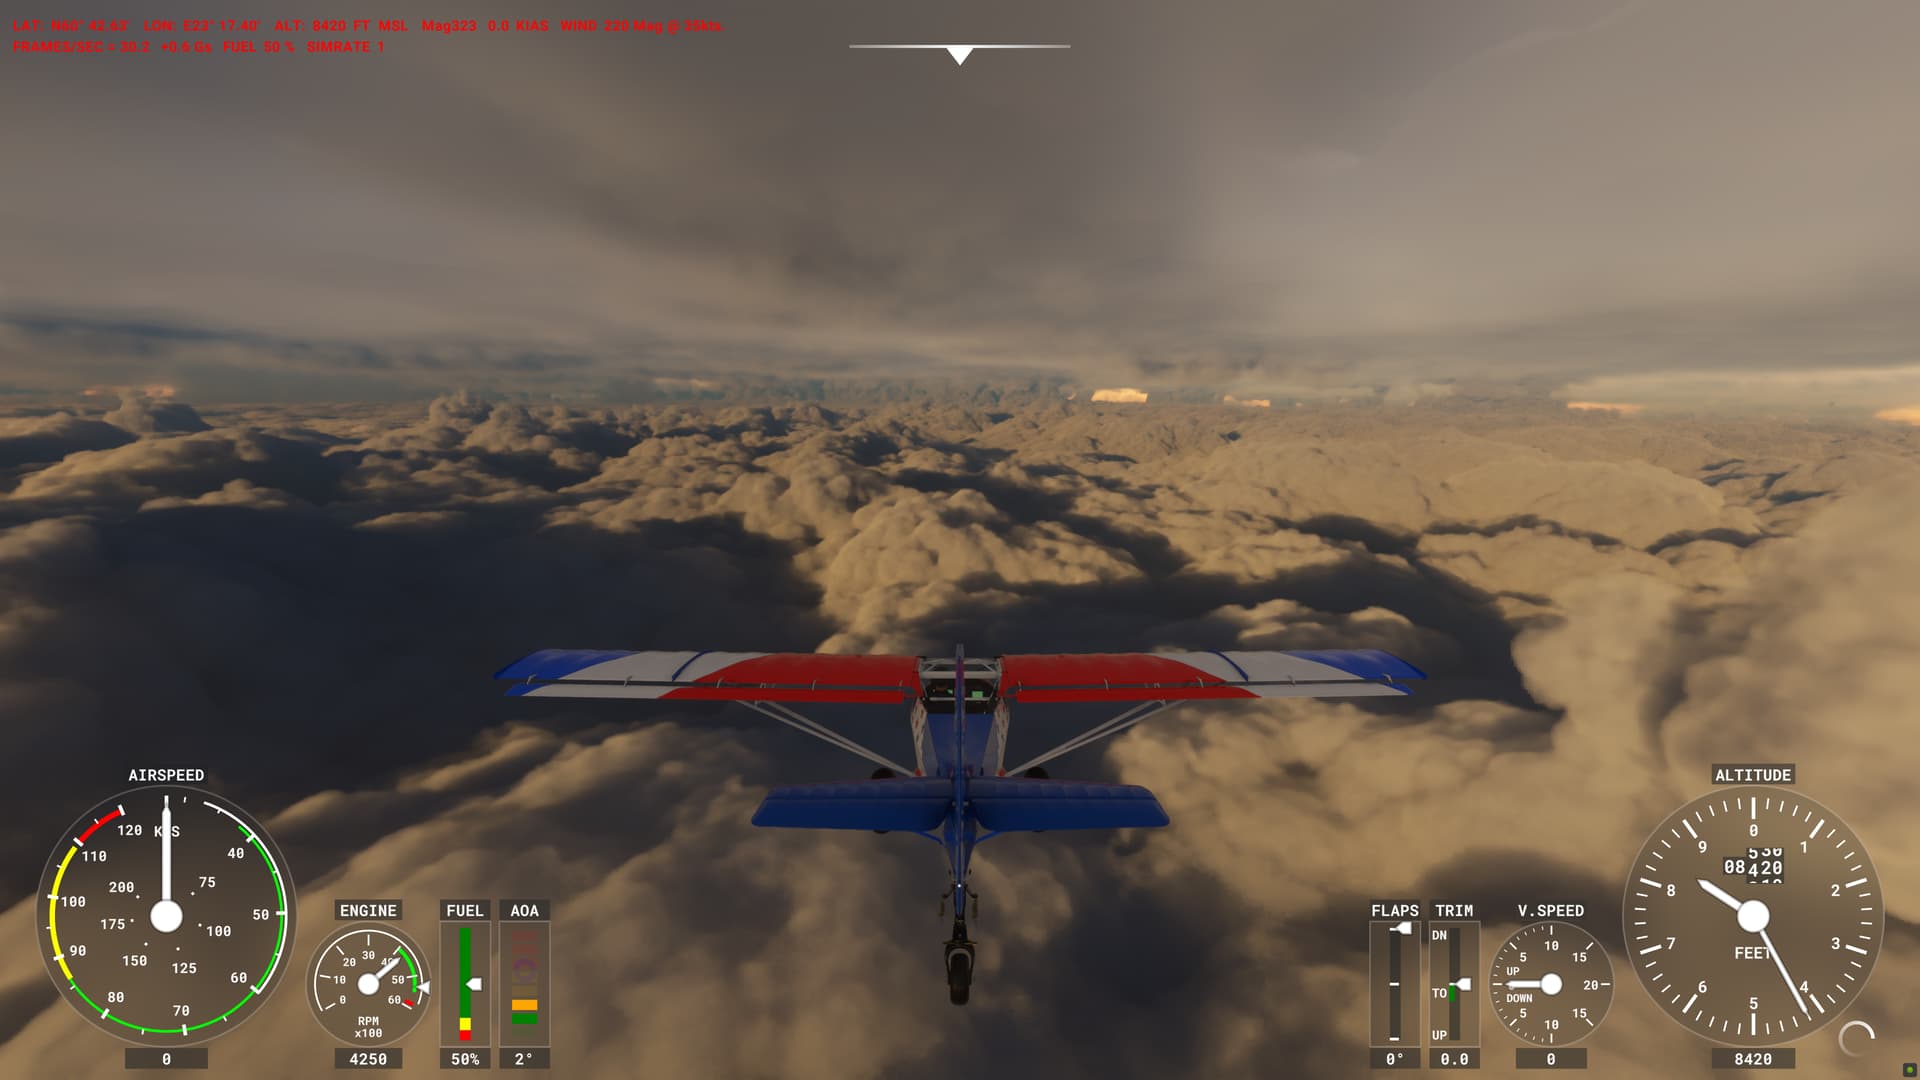
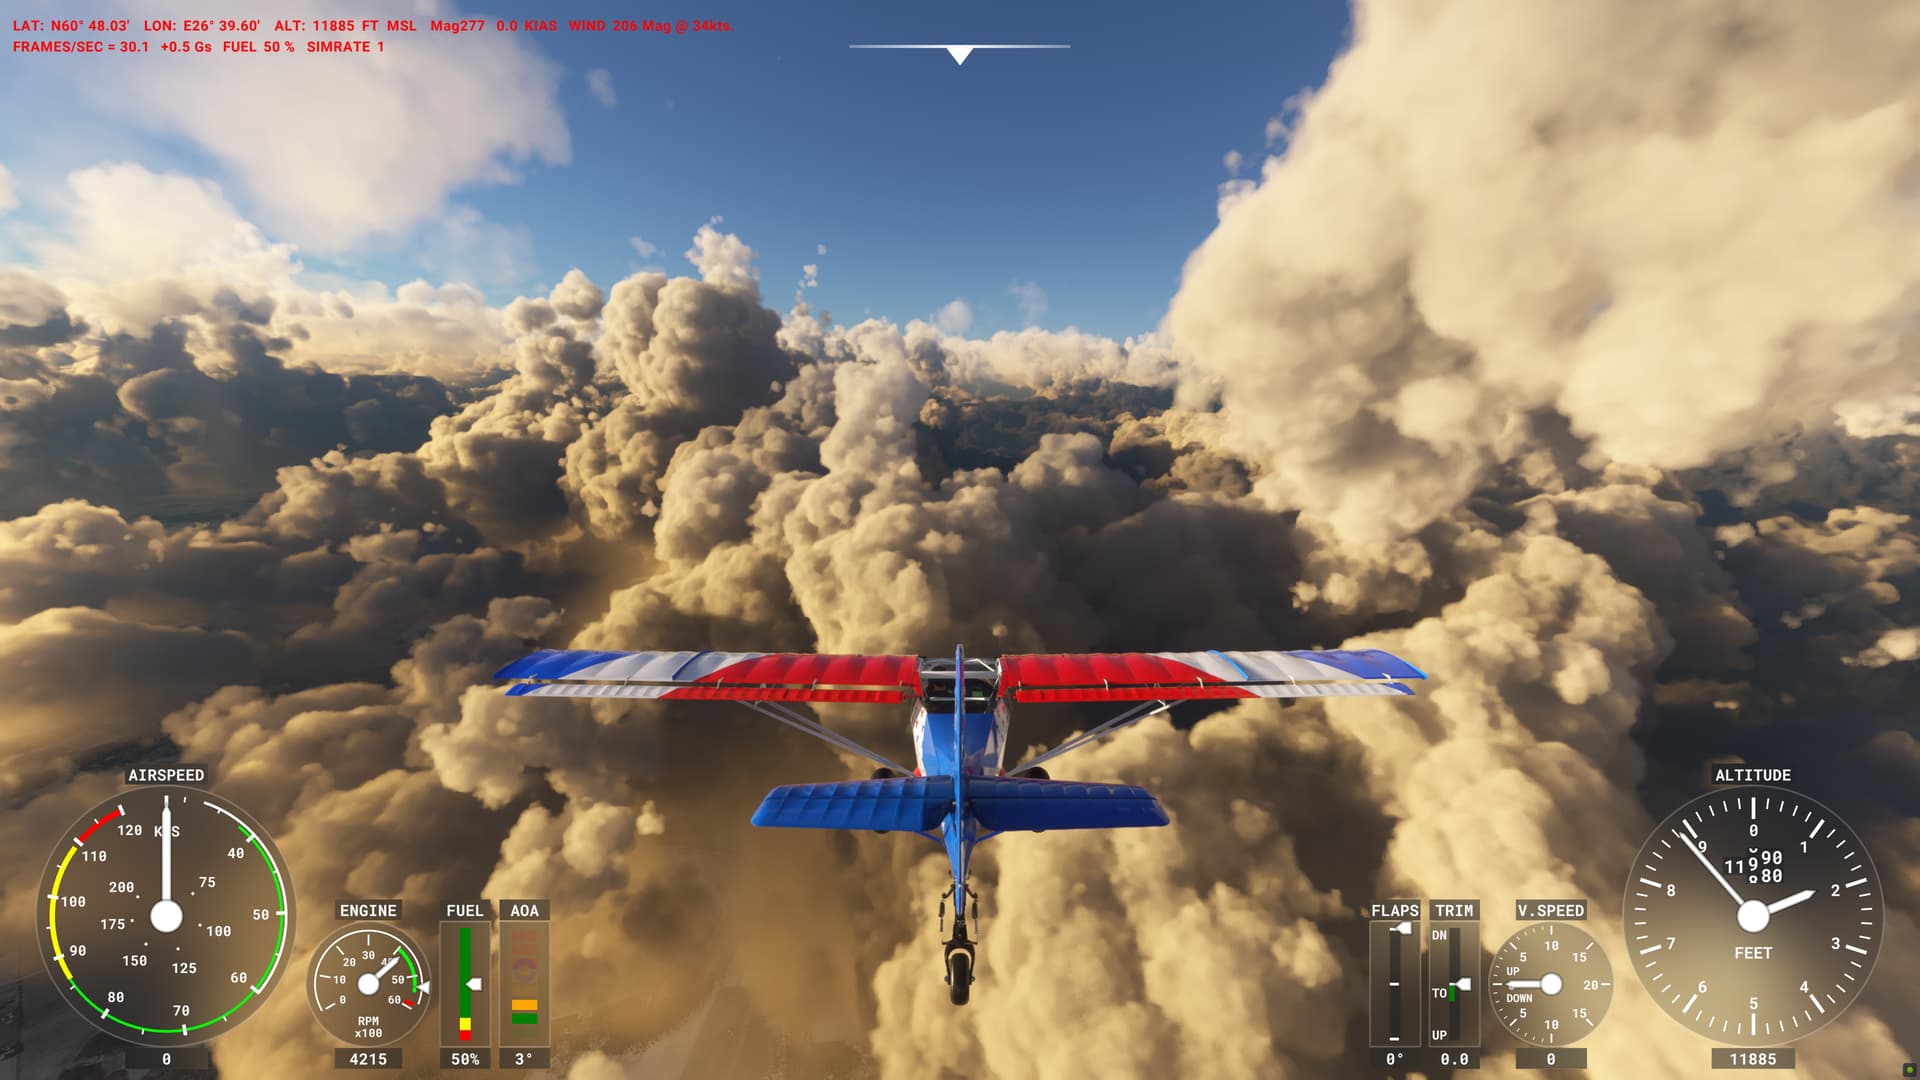
At this height, the tops of the clouds were already visible through the translucent cloudy air. I continued climbing and reached the top of the main cloud layer at around 4,000 ft. MSL:

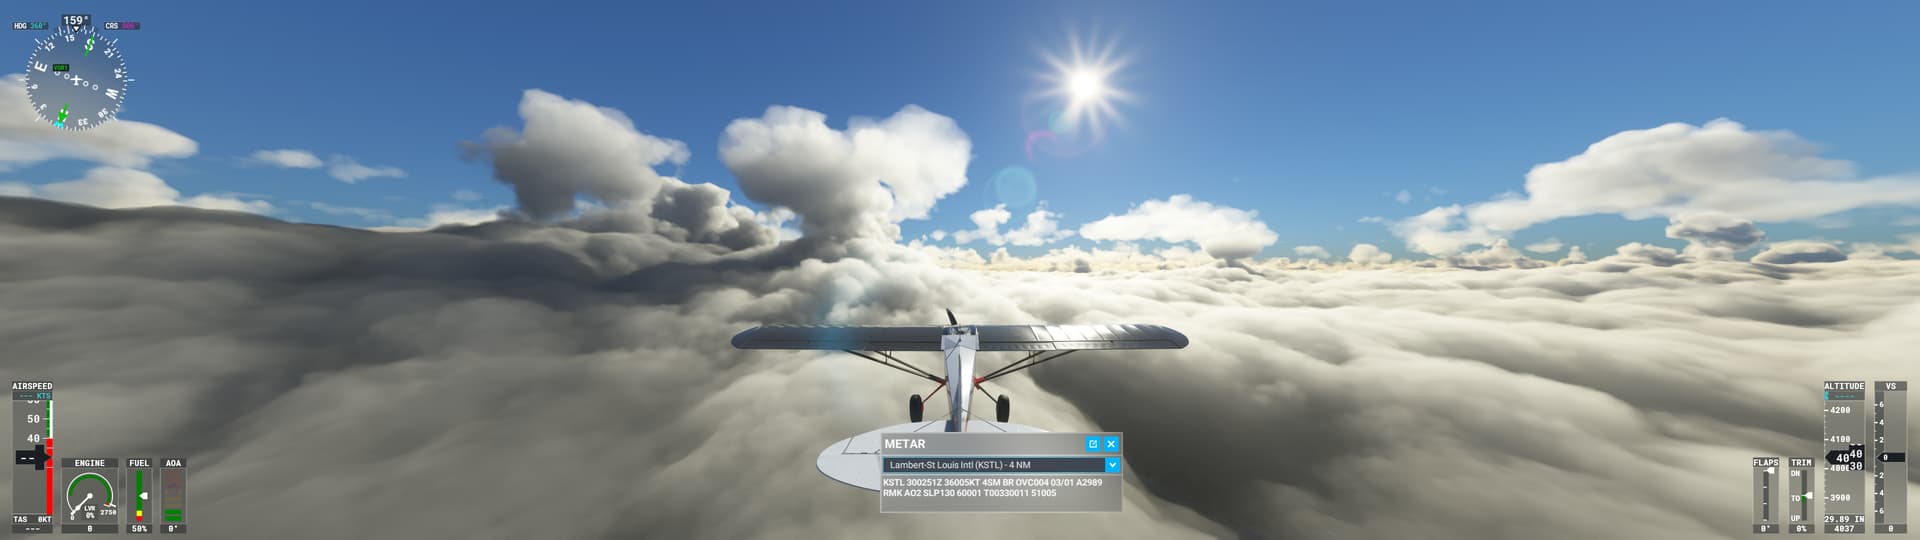
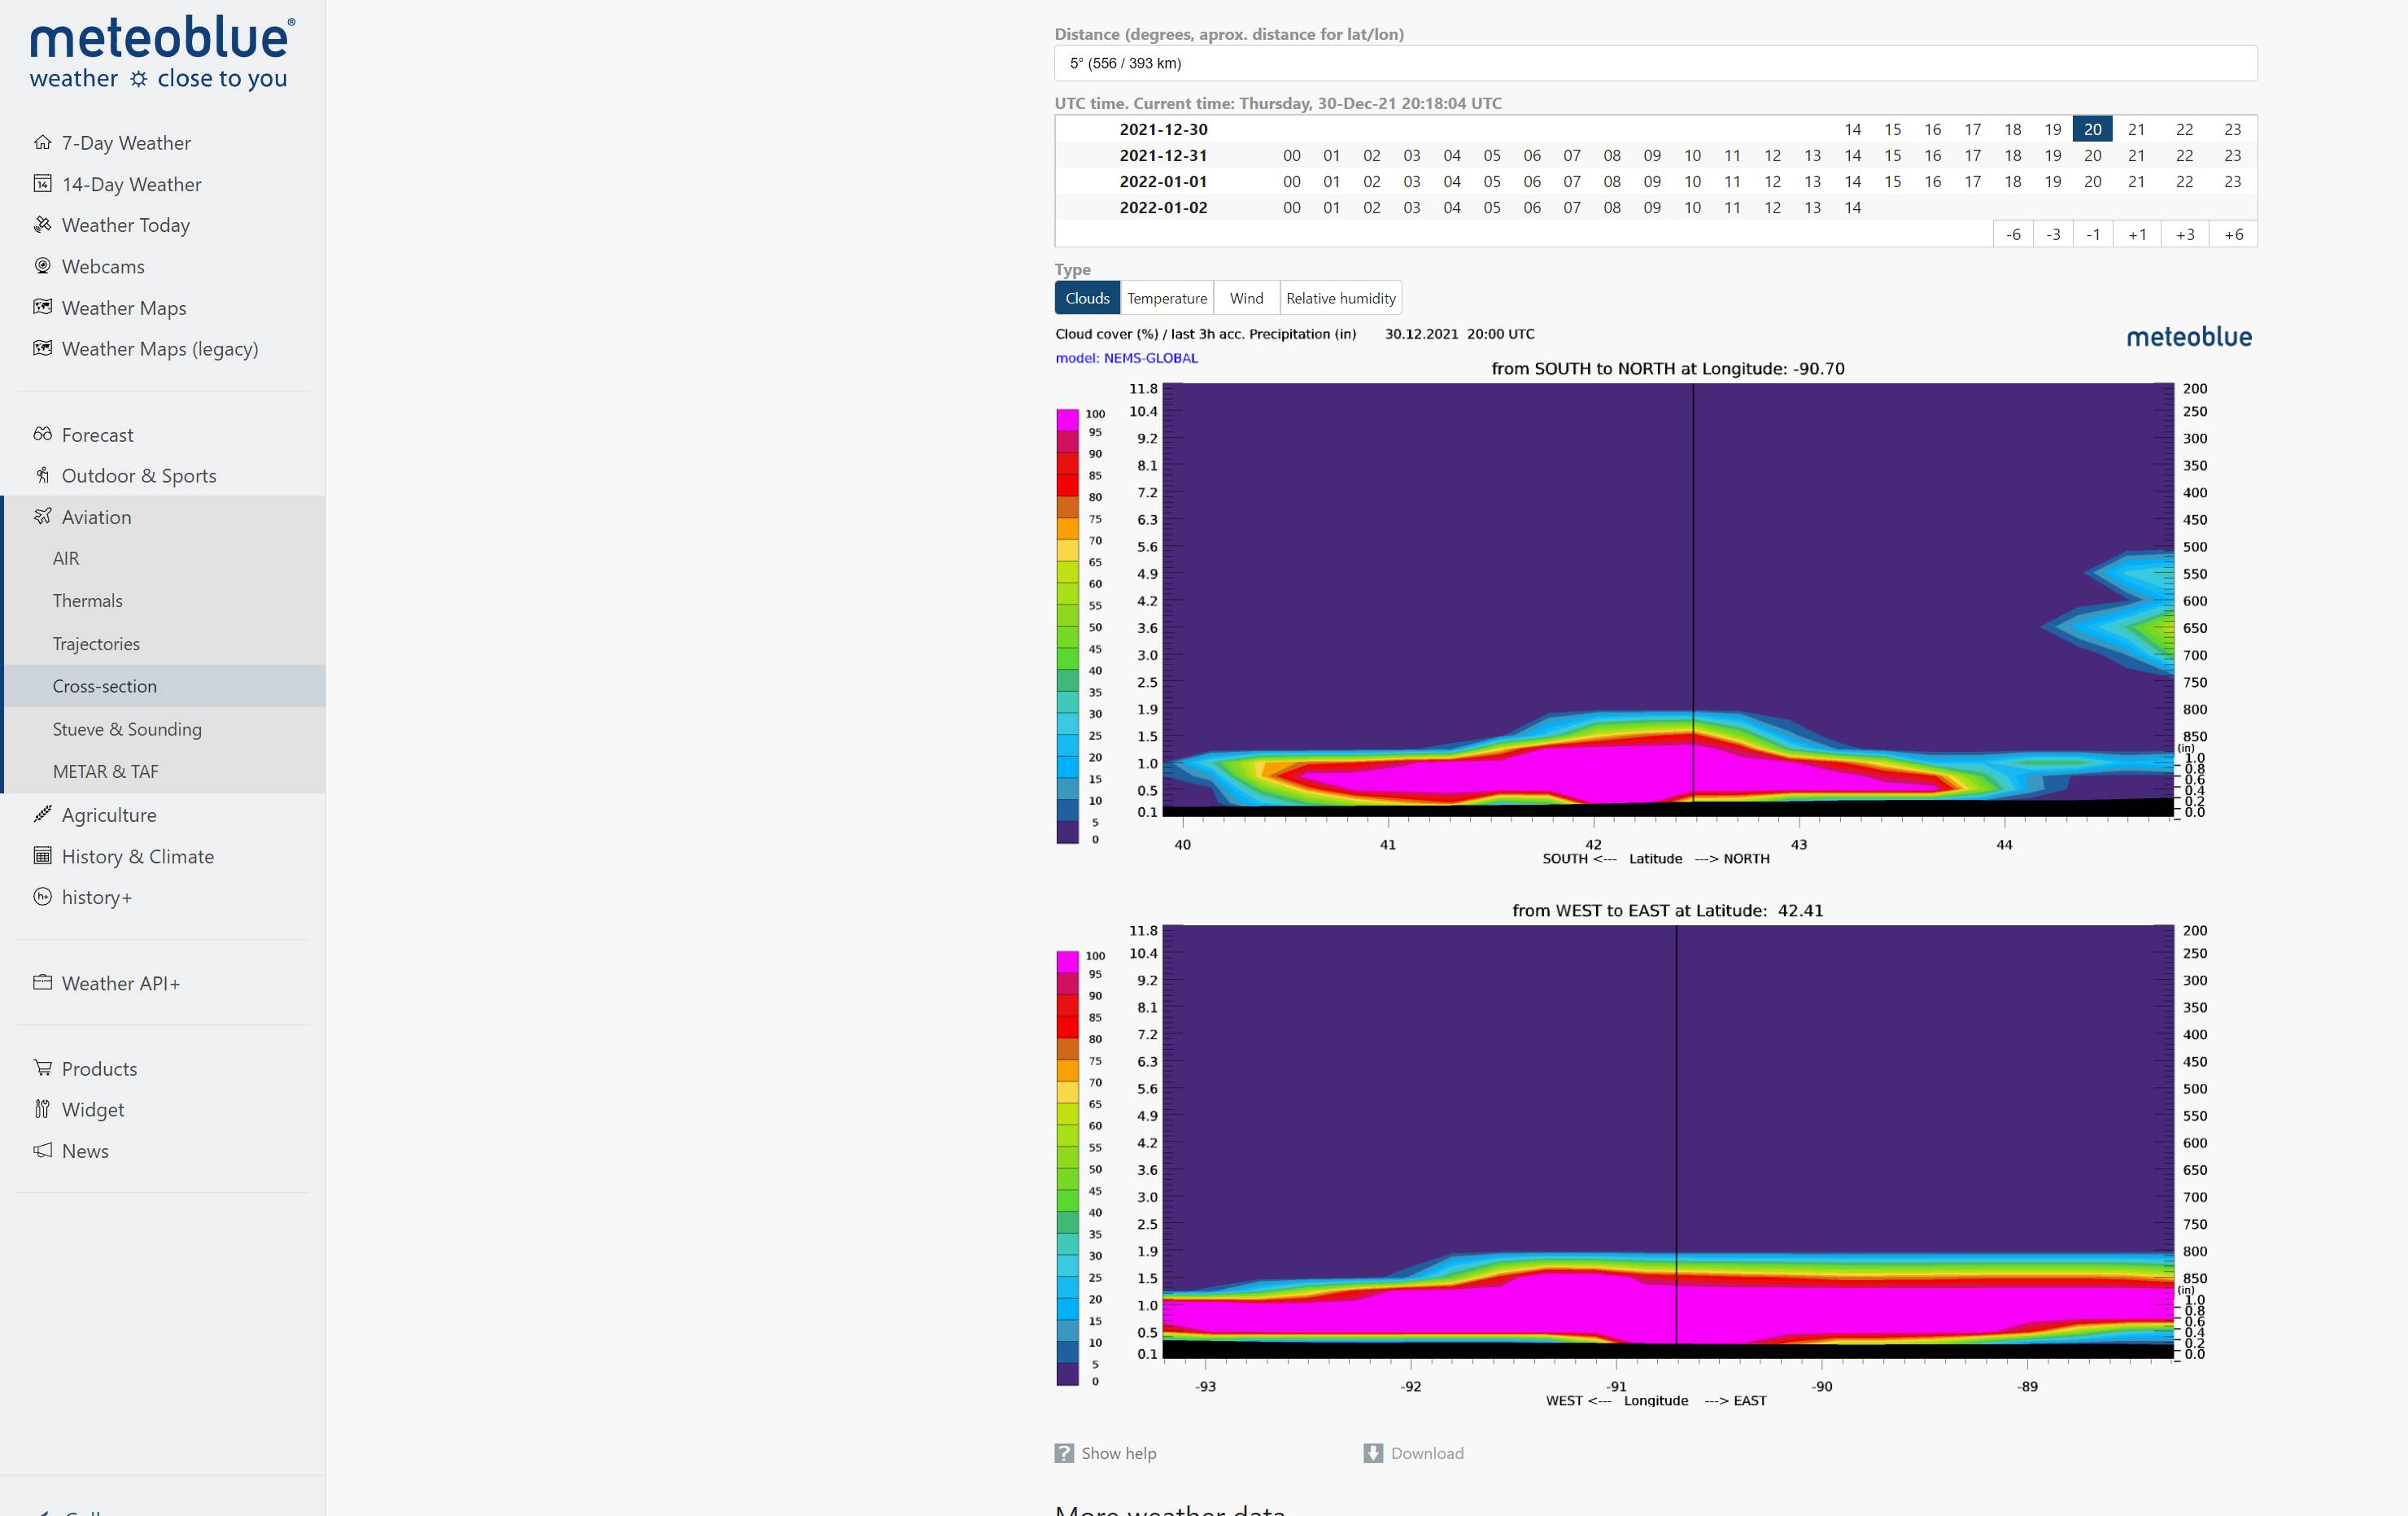
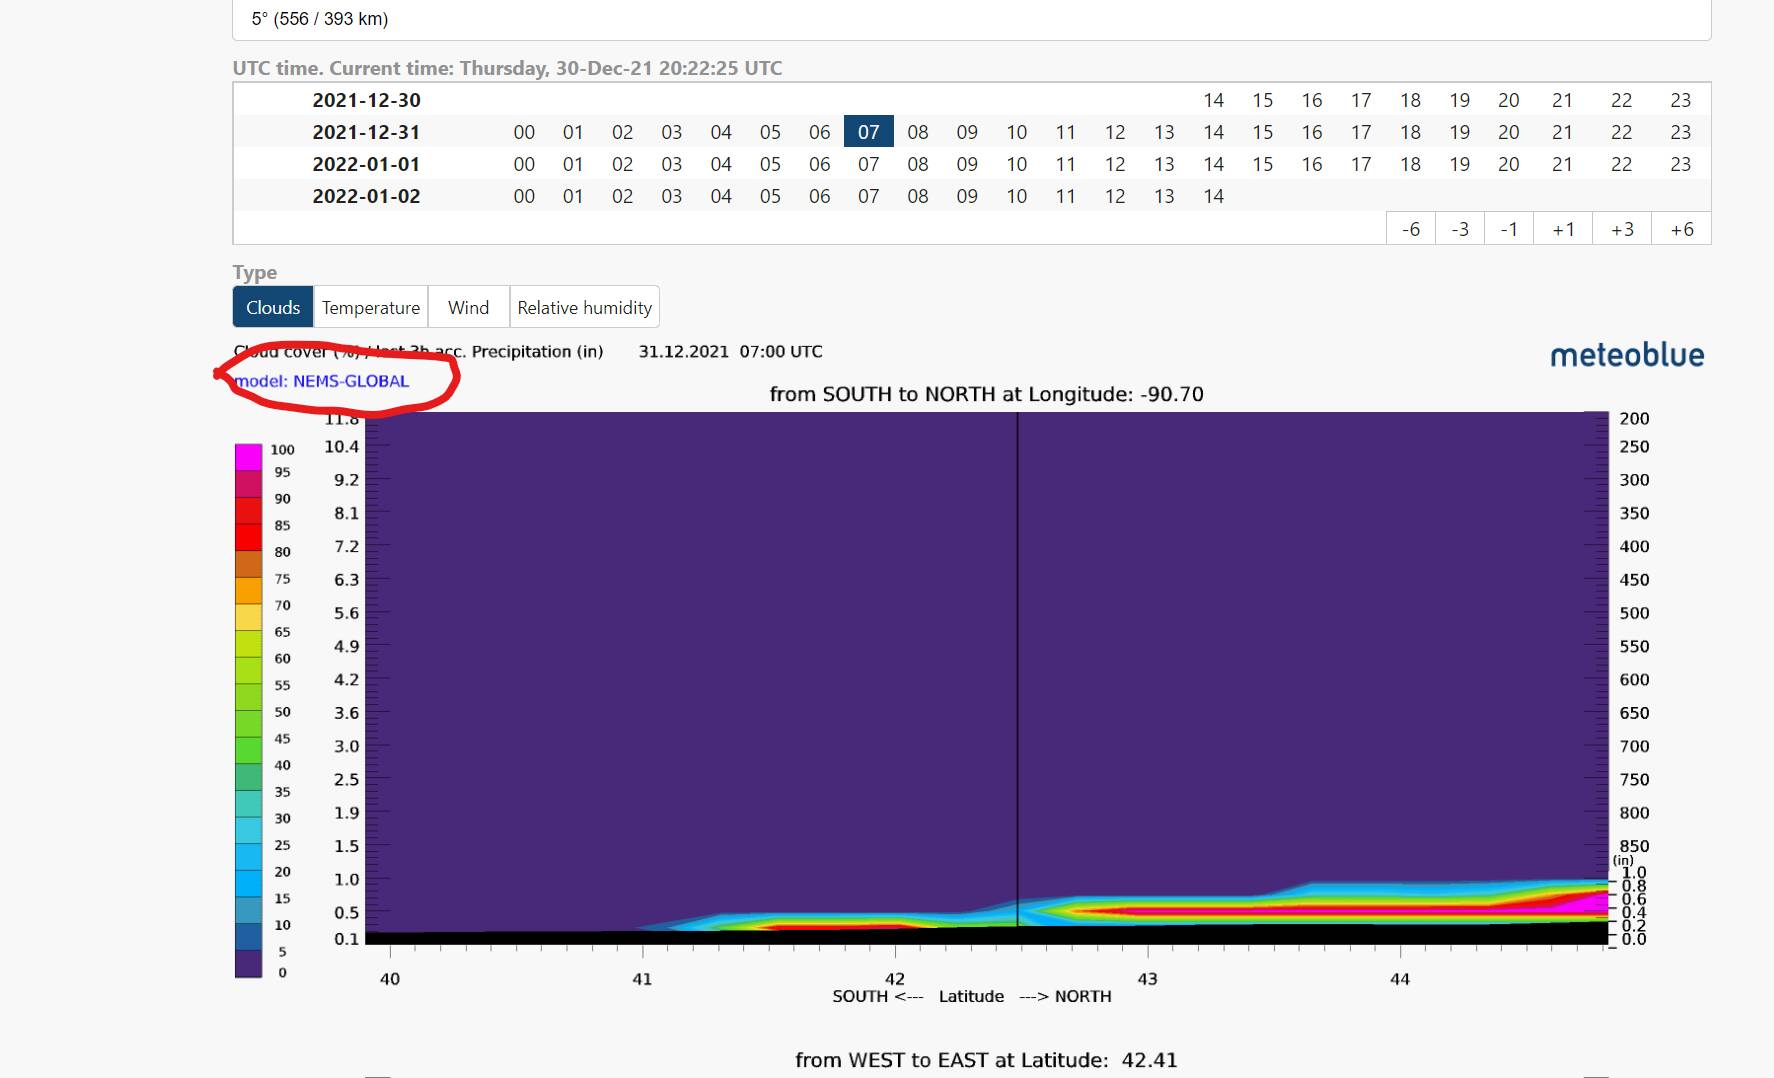
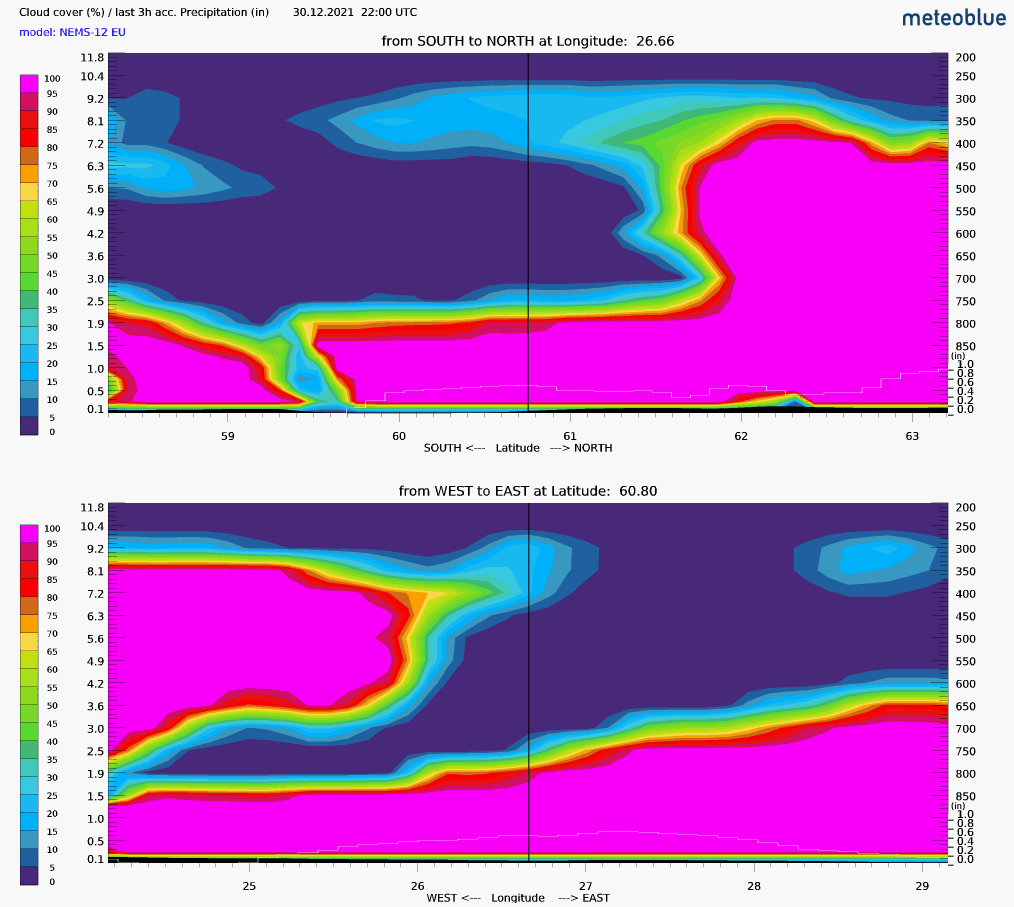
It looks like the sim drew a nearly overcast layer between approximately 1,000 and 4,000 ft. MSL, and a separate layer with far less coverage around 7,400 ft. MSL:

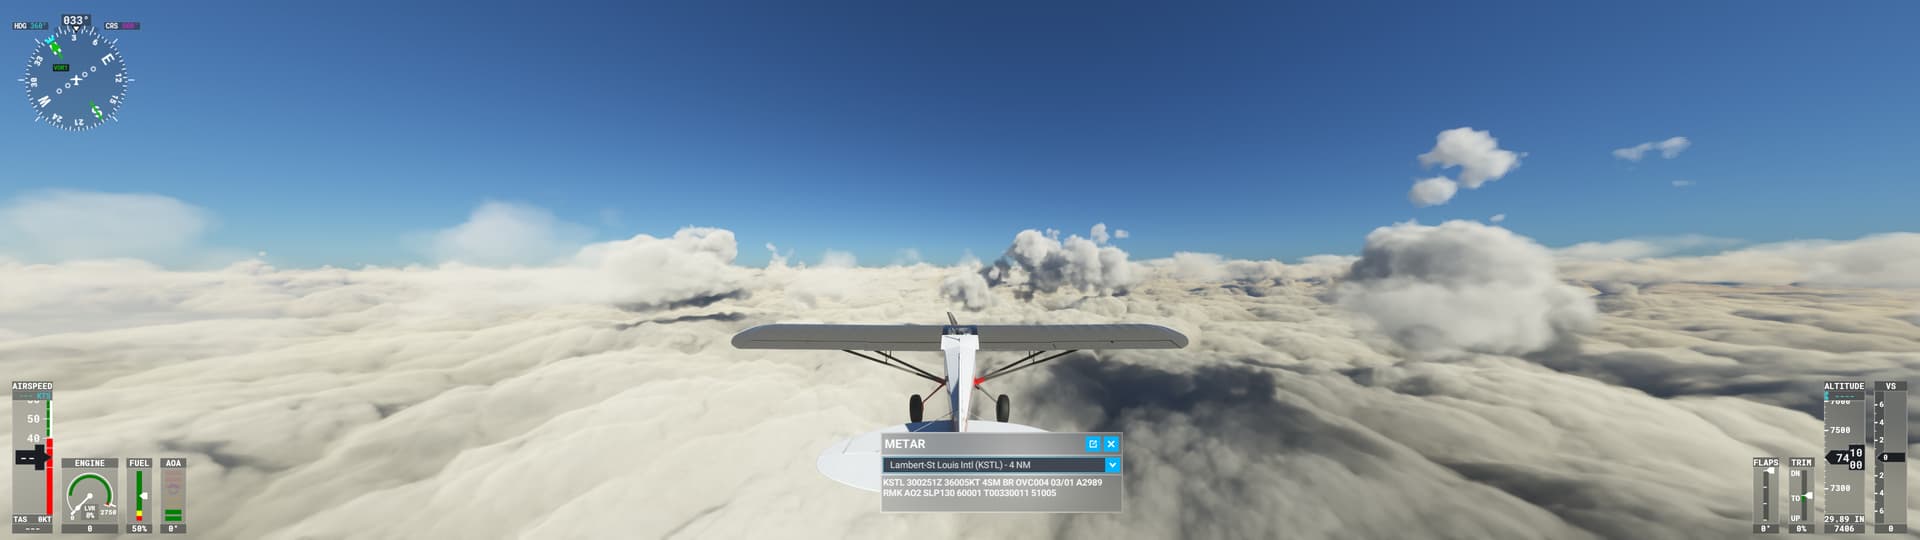
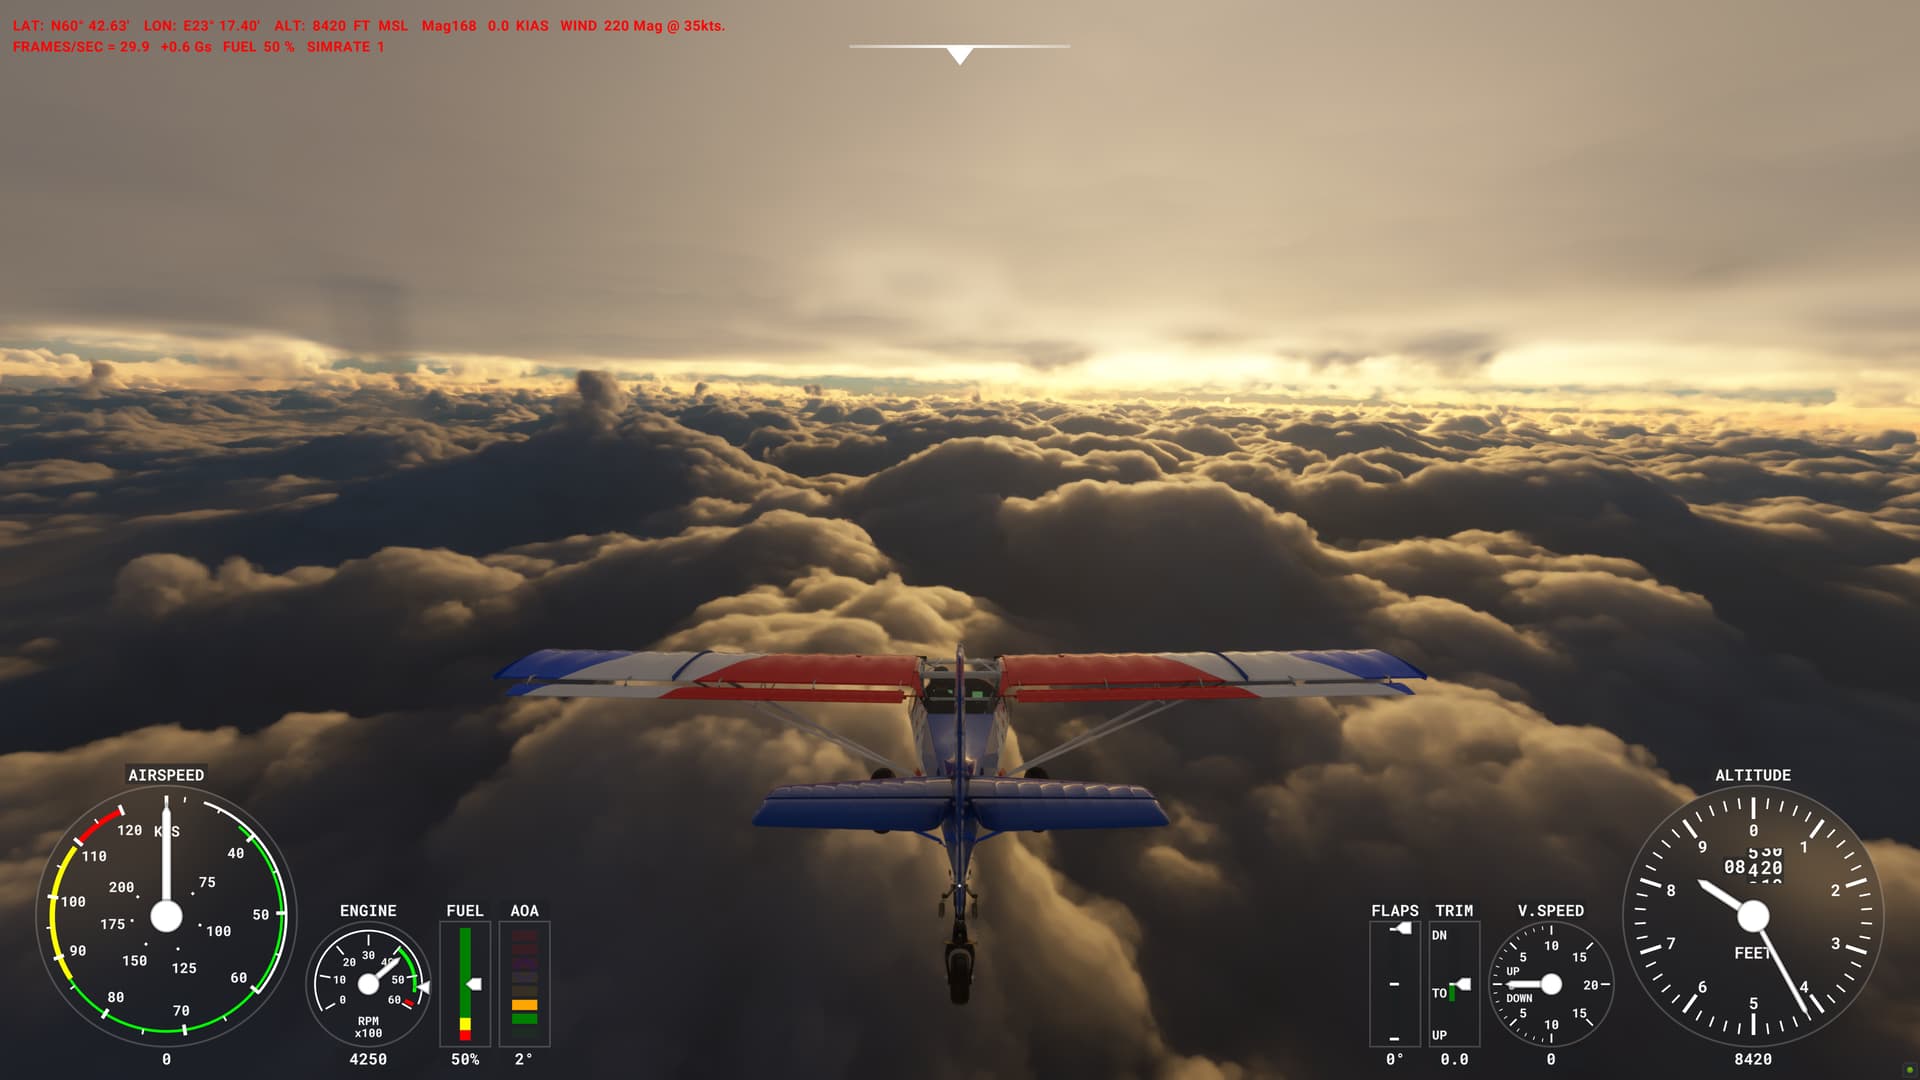
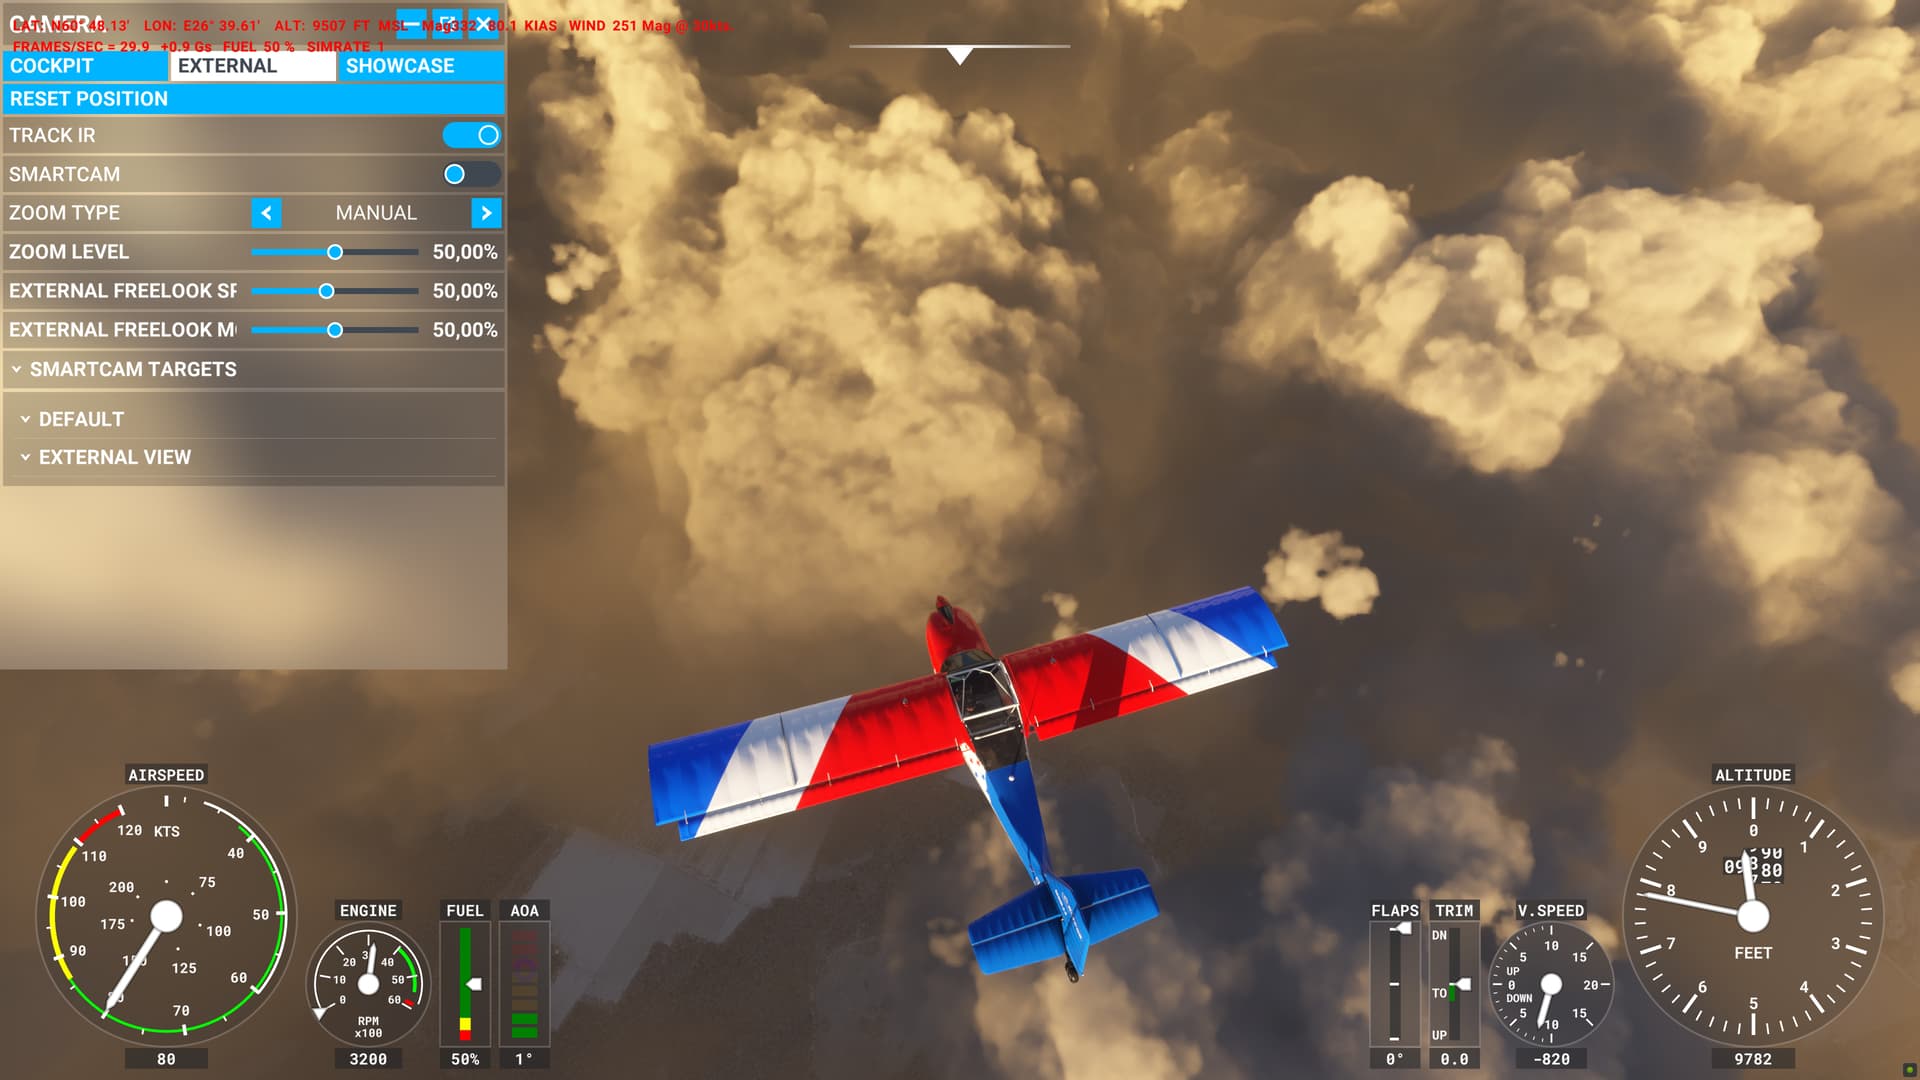
It’s possible that the Meteoblue NEMS model indicated a second layer, unlike the RAP model sounding above. It’s impossible to know for sure without looking at the data. But overall, this cloud layer was a reasonable representation. Climbing higher to get a broader view, the layer looks stratiform. This is a good representation.

I suspect the layer looks so good because coverage was near 100%. In my tests with the sim’s cloud parameters, the sim will draw a stratiform layer if coverage=100. This is true even if scatter=100. If the coverage were less than 100% in this case, would the sim have drawn building cumulus clouds?

Regardless of that, the density parameter is far too low here. It is doubtful that the ground would still be visible after climbing 1,400 ft. above the cloud base in real life. By the time I reached that altitude, I could already see the cloud tops 1,600 ft above me.

The images I showed in the original post indicated the same conclusion: density needs to be very high for shallow stratus clouds to look realistic. But high density also leads to volcanic ash-like appearance at the cloud top if the cloud is thick. It’s a difficult balance to strike with the current cloud parameters.

Moving on to Memphis, Tennessee:

The last few METARs indicate a persistent low ceiling, but broken clouds an hour ago:

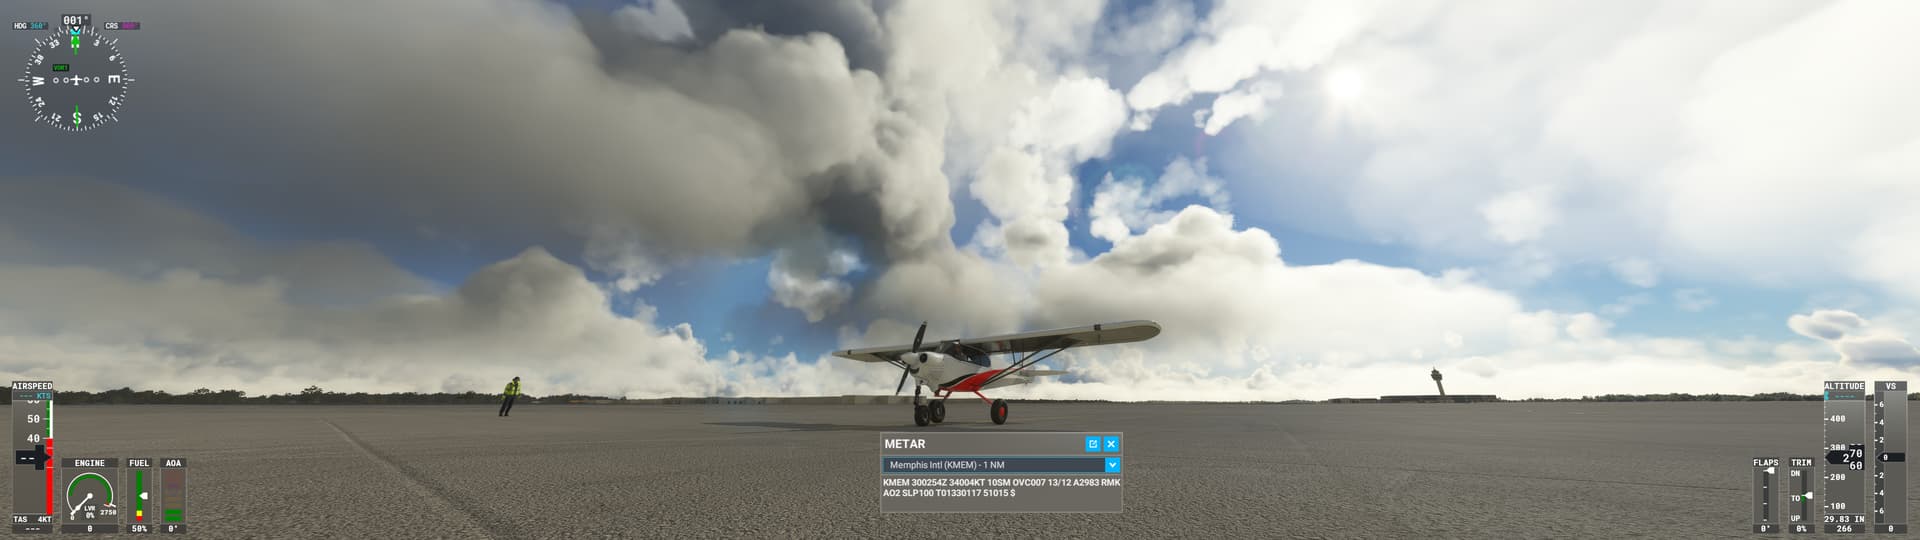
KMEM 300254Z 34004KT 10SM OVC007 13/12 A2983 RMK AO2 SLP100 T01330117 51015 $
KMEM 300154Z 32006KT 10SM BKN007 BKN120 13/11 A2982 RMK AO2 SLP098 T01280111 $
KMEM 300152Z 34006KT 10SM BKN007 BKN120 13/11 A2982 RMK AO2 $

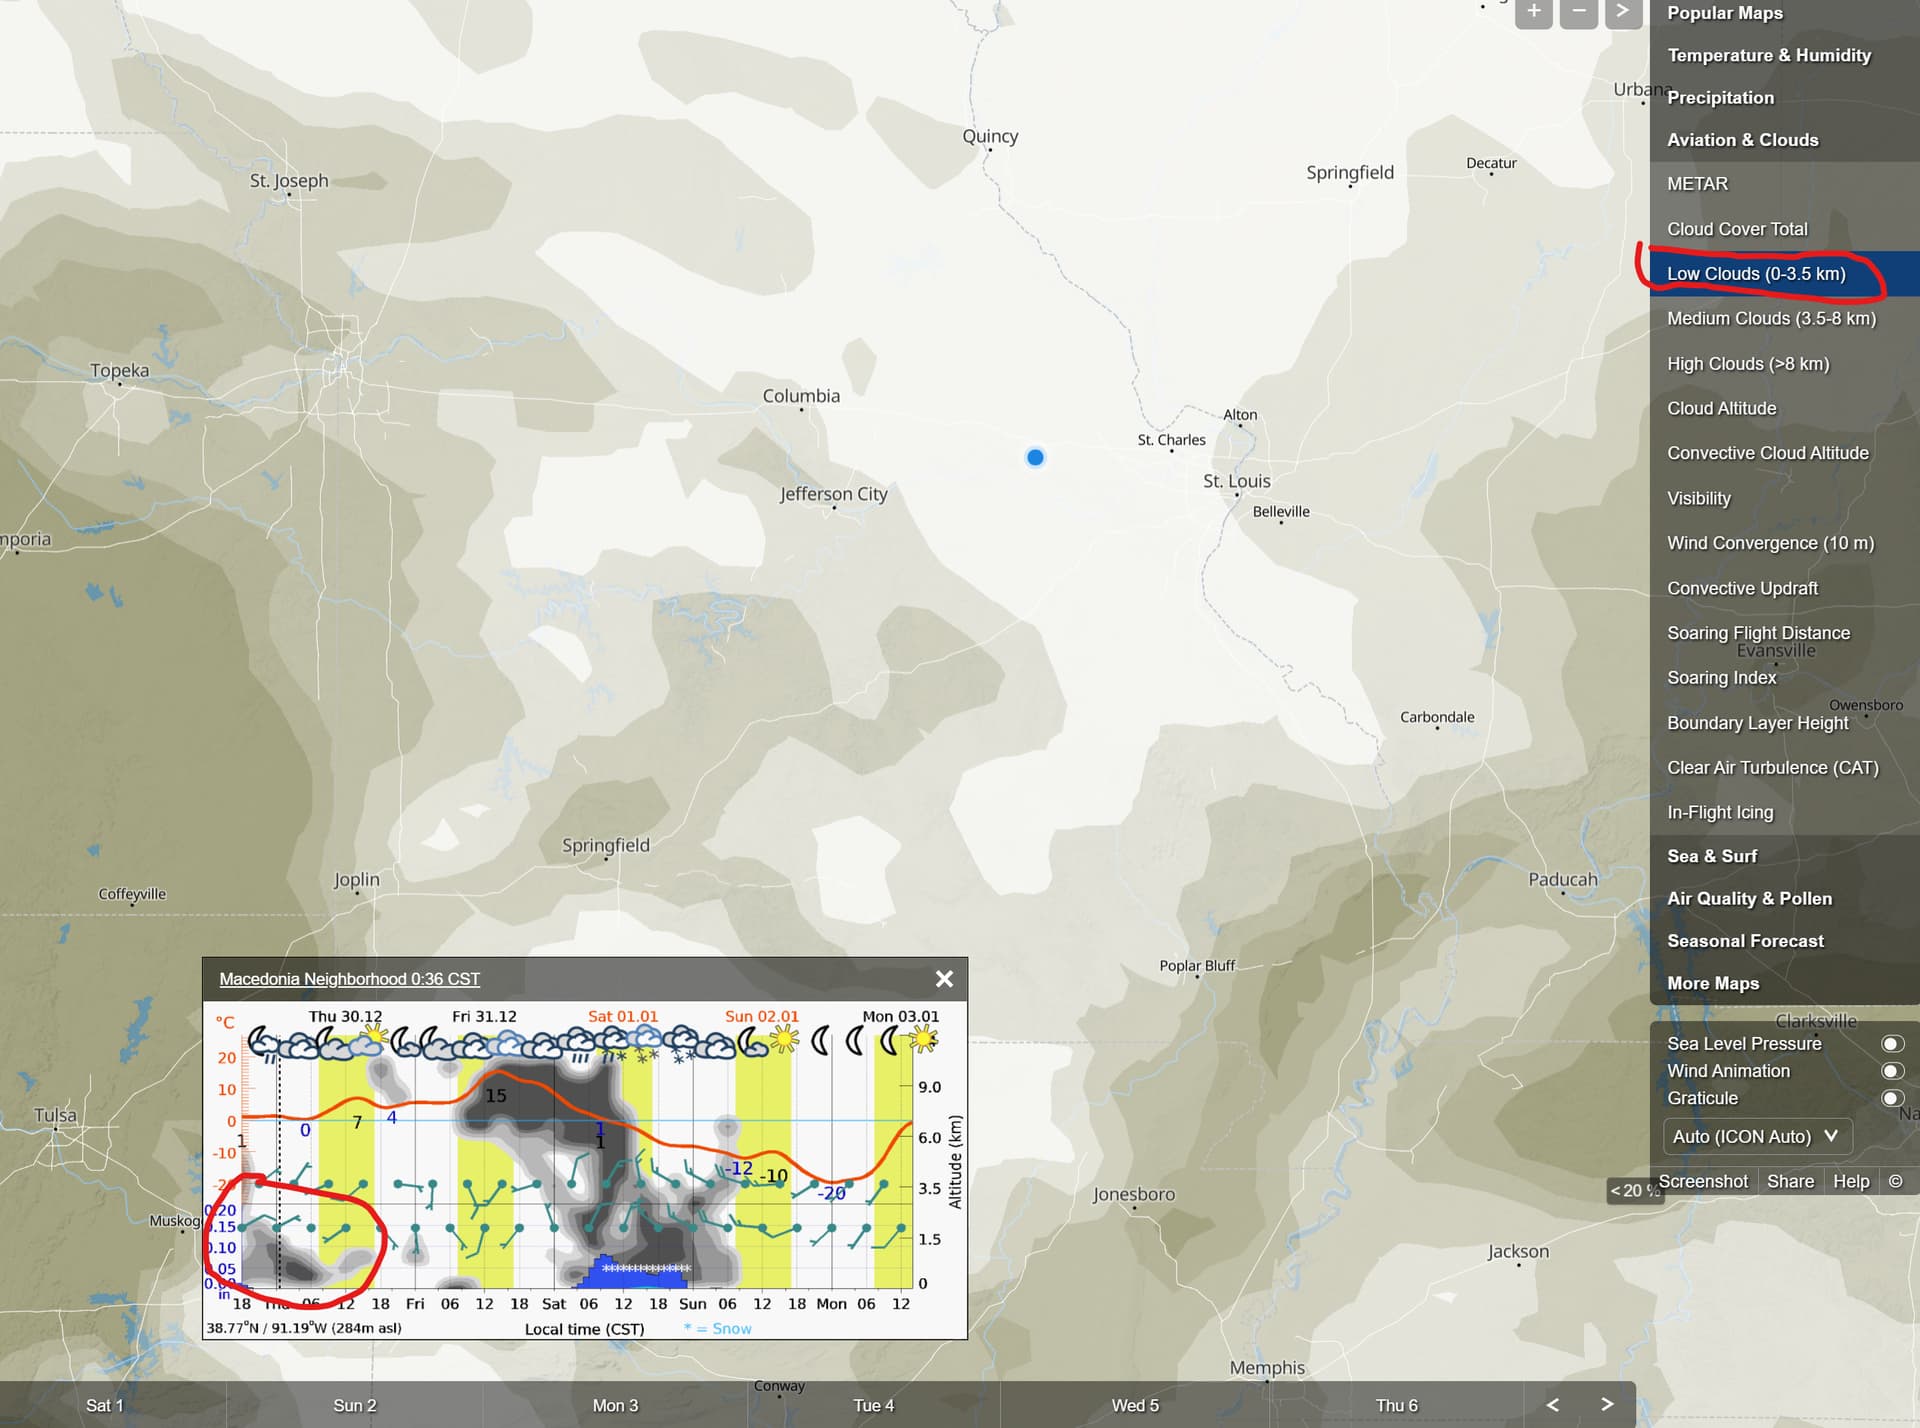
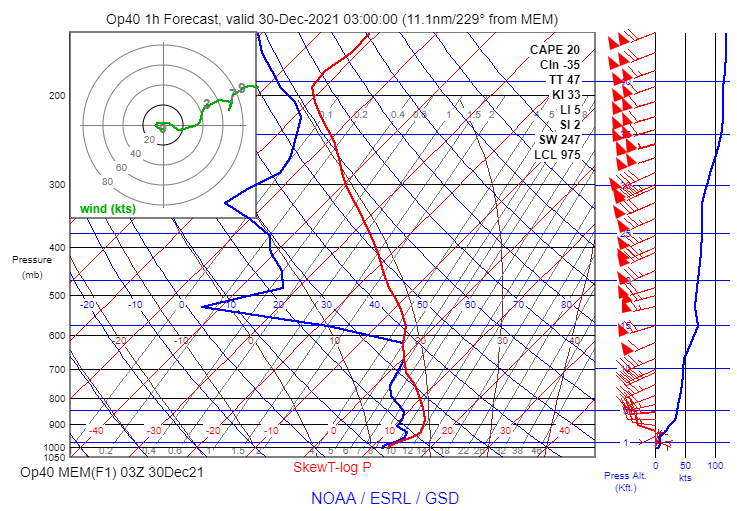
The RAP model sounding for 03Z shows a shallow stable saturated layer near the surface (with a top near 1700 ft. MSL) and another saturated layer near 11,000 ft (similar to the METAR reports of clouds at 12,000 ft).

At ground level in the sim, blue sky and sunshine are easily visible through the clouds, but if you look closely, you can see that the clouds are covering most of the sky. The density parameter is low, resulting in translucent clouds.

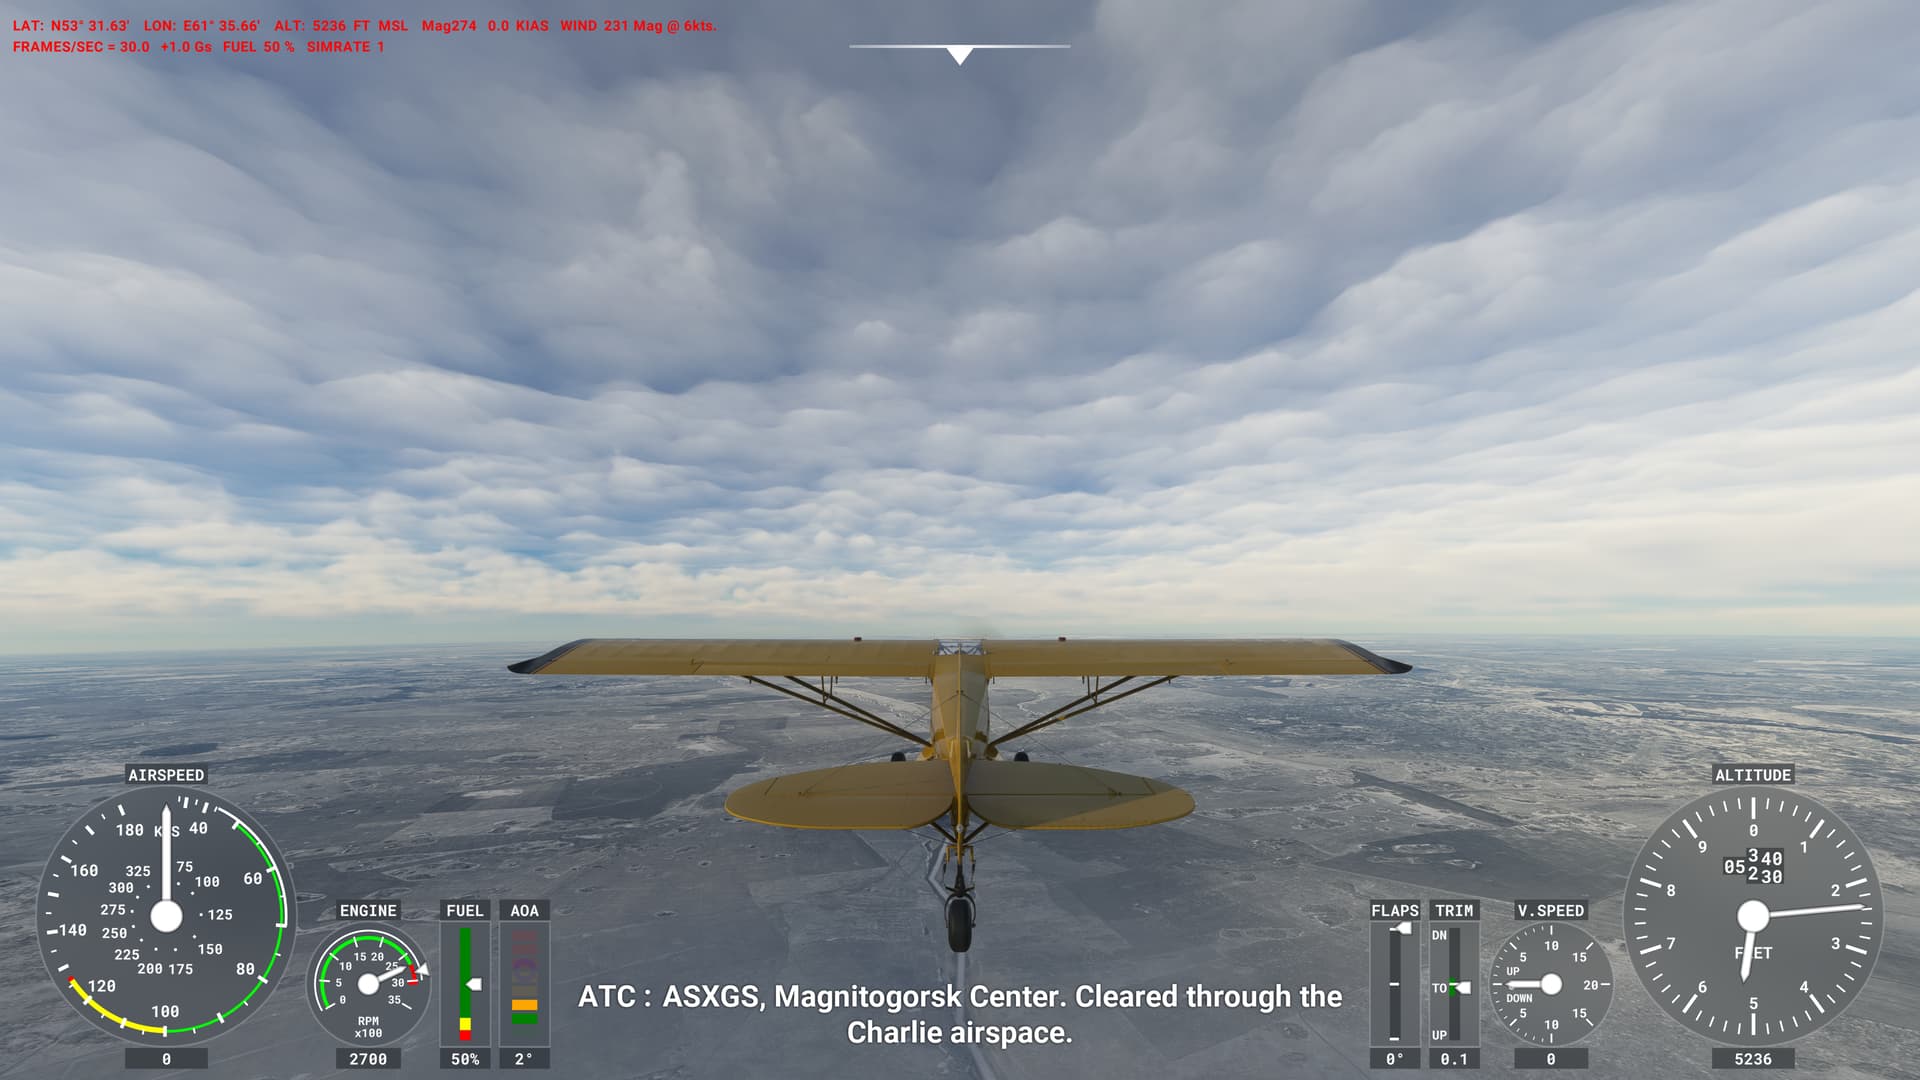
Climbing through the clouds was almost like climbing through a hole between clouds. I could see the ground and the sky throughout the climb. Here is the view near the cloud base:

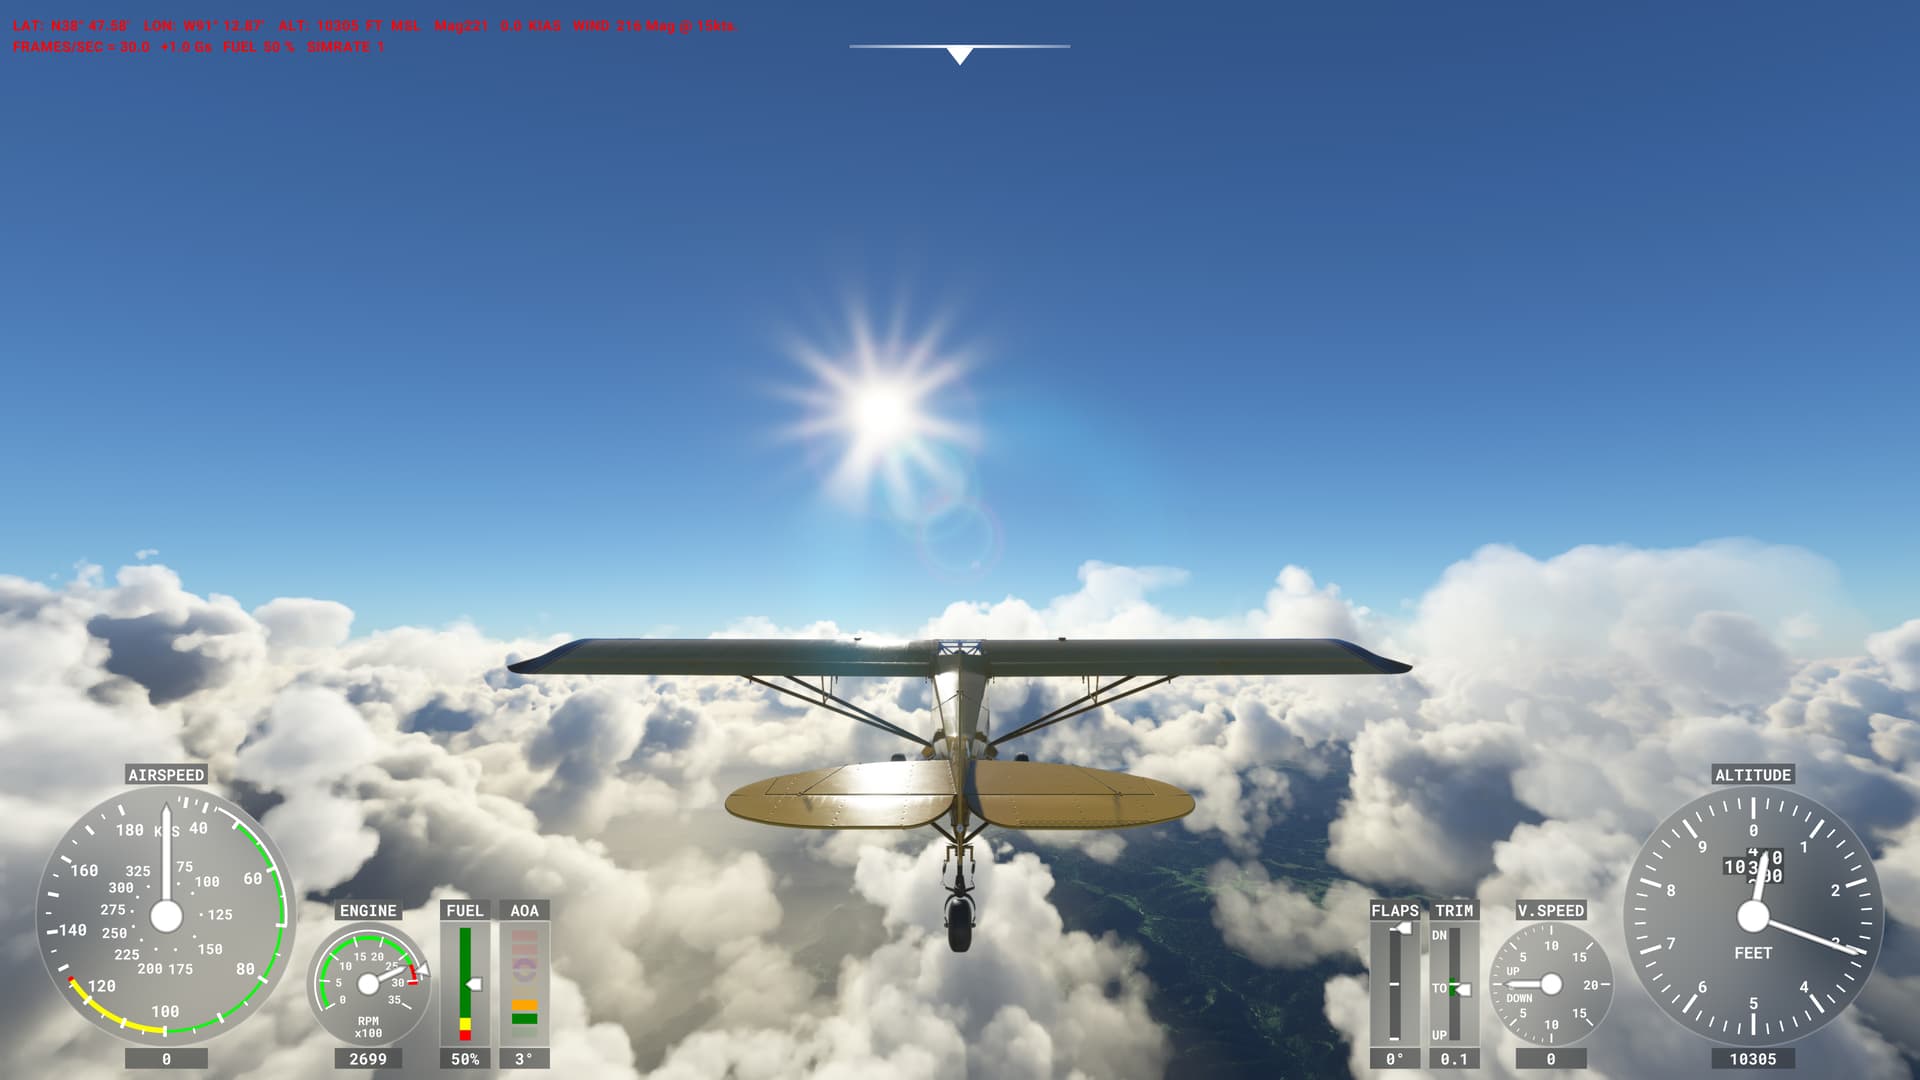
The cloud top was near 3,200 ft. MSL (different than the RAP model, but the sim isn’t using the RAP model). The clouds above this layer were at approximately 13,000 ft. MSL:

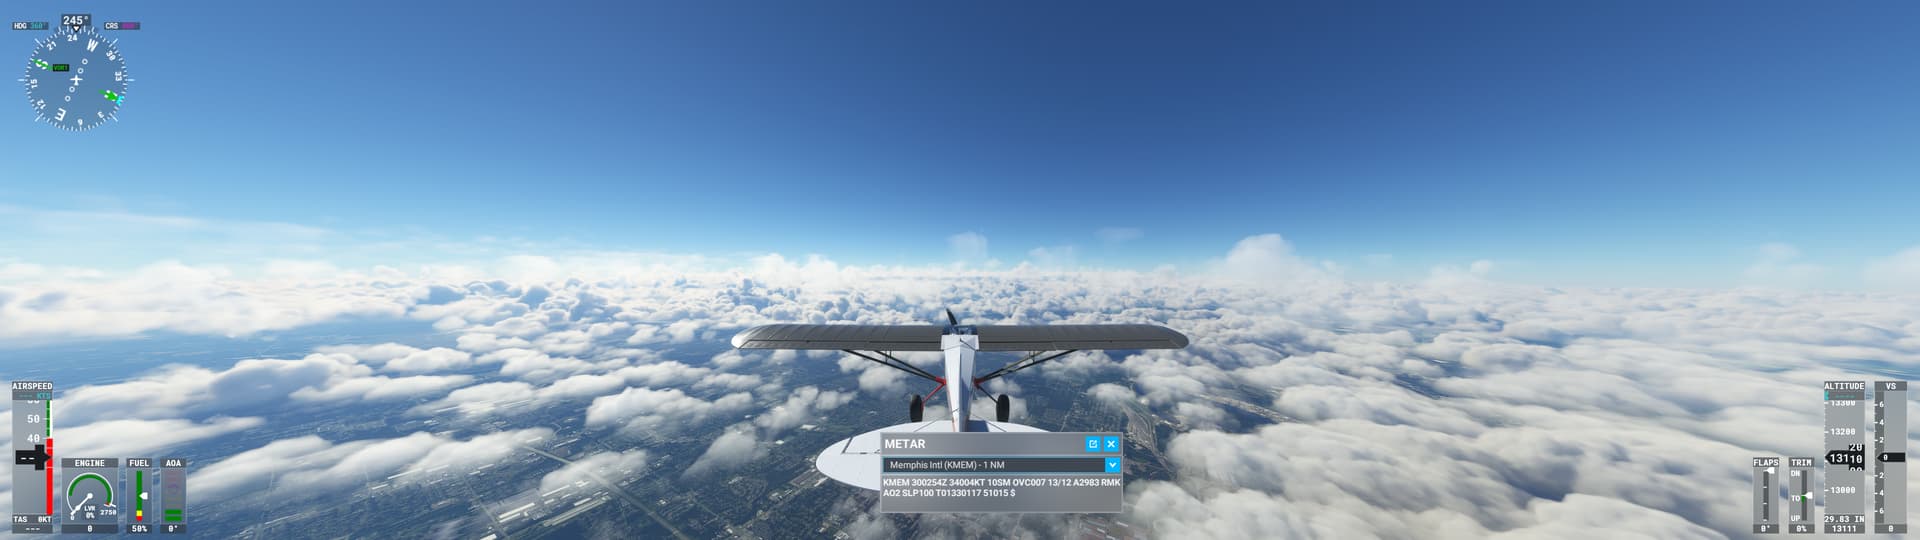
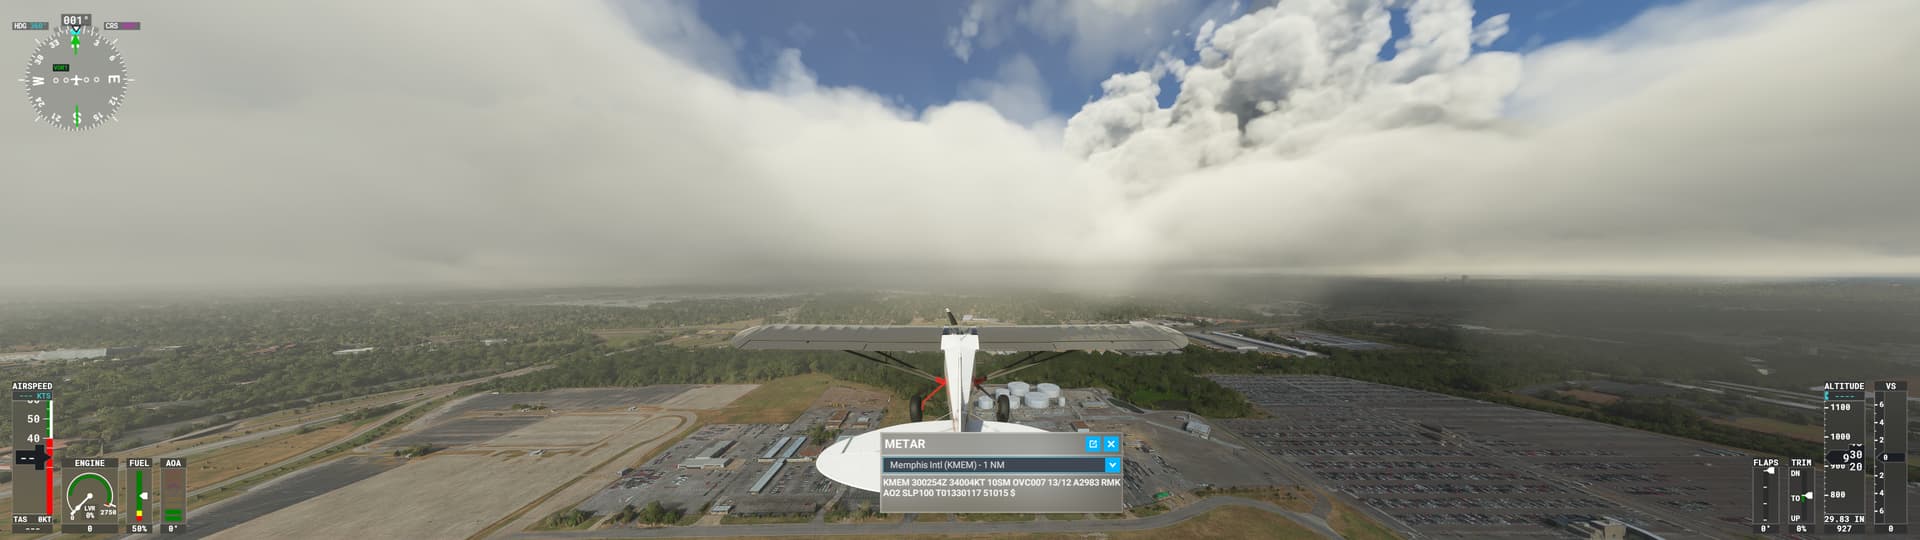
The accuracy of cloud heights here is reasonable. From above, the cloud coverage definitely does not look overcast, but as I descended back toward the airport, I could see very thin clouds covering the area:

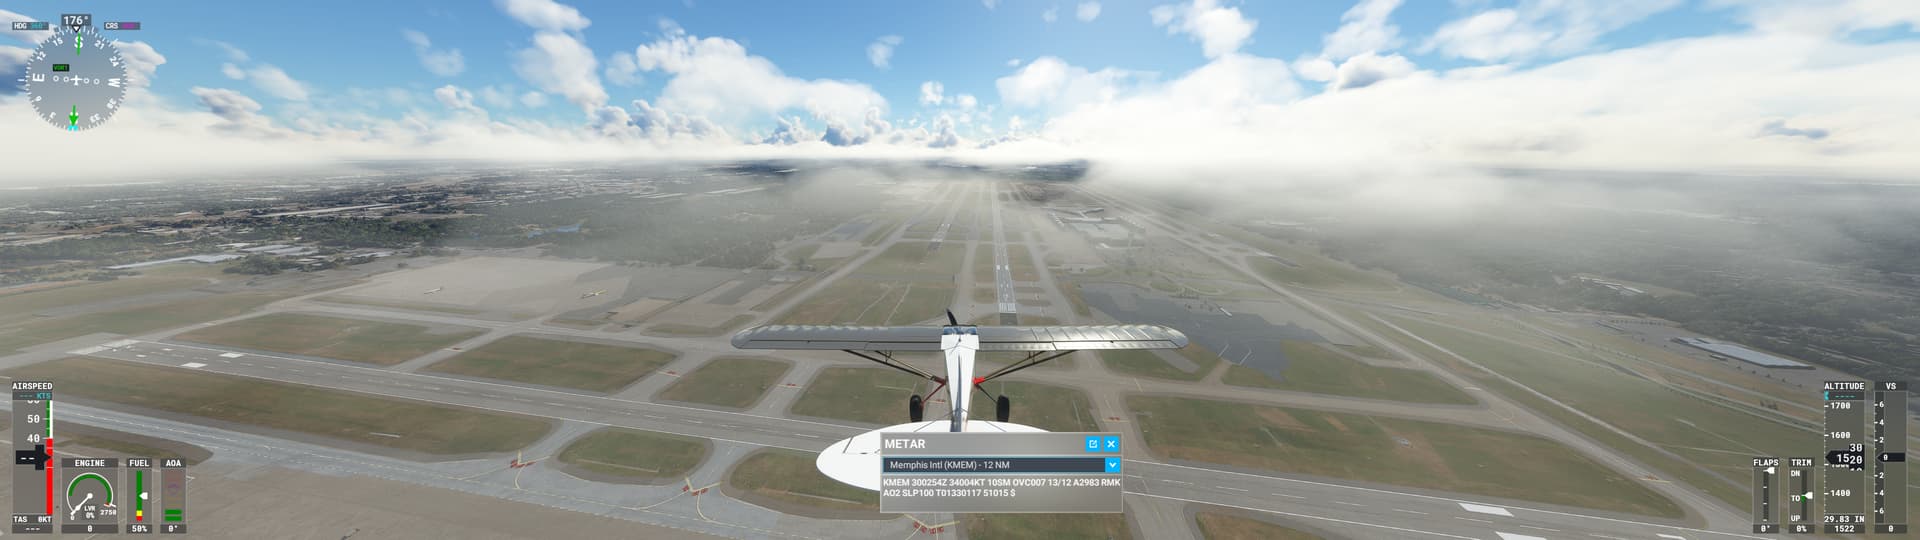
These clouds are so thin that they are practically invisible when viewed from above.

In this case, I suspect coverage was not 100% in the sim, but it might have been near 90%. And that seems reasonable based on the previous hour’s METARs and the satellite image showing the edge of stratus in the area. The clouds are also passable as stratocumulus. They do not look like building cumulus clouds. Here again, though, the density is far too low to be convincing. The cloud layer is so translucent that climbing through the layer looks like climbing through a hole in the clouds.

6 Likes

I really like your detailed posts! You describe what we see is a problem in a constructive way. Hope Asobo make notice of your hard work here. I can see much problem here in Sweden. I wonder if you can see what kind of problem you think is going on there. It’s often those towering clouds where those maybe sometimes exists in the summer when it’s thunderstorms going on. Now it’s mostly those stratus clouds. I think it’s because the theory you had about those thick layers of clouds injected into the sim. Mostly only on the lowest layer too. It almost feels like they inject many cloud layers at the same altitude. Look like a mess.

1 Like

Here is a test with the different cloudlayers injected into the sim. Hope it can be for some help.

Low clouds

Didn’t get any clouds injected only fog from METAR

One more test with low clouds

Medium height clouds

High clouds

All the layers covered

Also found this on meteoblue homepage. Maybe it’s this that tells how much cloudcoverage it should be injected?

2 Likes

This thread is perilously close to being actioned. Perilously. Close.

Think twice before making a comment. Is it in alignment with Code of Conduct? More importantly, is it civil and relevant?

Once again, a reminder is needed. METAR data was already being incorporated prior to SU7.

I’ll repeat. Live weather pre-SU7 already had METAR winds, temperature and pressure. The only new elements in the live weather with SU7 is the incorporation of METAR cloud coverage and visibility.

These are visual characteristics of weather, and therein lies where the issues are. Winds, temperature and pressure are obviously not visual and therefore present less noticeable problems when incorporating them into the sim.

1 Like

Another test today at Dubuque, Iowa (KDBQ). The current satellite imagery shows a widespread stratus deck over the area:

The RAP model sounding for 19Z shows a stable saturated layer from the surface to near 4,300 ft. MSL:

The recent METARs indicate a persistent low ceiling with fog developing:

KDBQ 301953Z 16006KT 1/4SM R36/1600V1800FT FZFG VV002 M04/M04 A2978 RMK AO2 SLP102 I1000 T10391044
KDBQ 301902Z 14004KT 1/4SM R36/1800V2200FT FZFG VV002 M04/M04 A2979 RMK AO2 T10441044
KDBQ 301853Z 13006KT 1/4SM R36/1600V2600FT FZFG OVC002 M04/M04 A2978 RMK AO2 SLP103 T10441044
KDBQ 301834Z 13005KT 3/4SM R36/2400V5000FT BR OVC003 M04/M05 A2980 RMK AO2 T10441050
KDBQ 301812Z 16004KT 1 3/4SM R36/6000VP6000FT BR OVC003 M04/M05 A2982 RMK AO2 T10441050

In the sim, the ground-level view looks quite accurate. Overcast and foggy:

As I climbed into the clouds, the ground didn’t disappear until about 2,400 ft MSL (very similar to my experience at KSTL yesterday):

I broke out of the clouds near 5,200 ft. MSL:

Viewing the clouds from a high altitude, this is an overcast stratiform deck. Aside from the low optical density, this is a good representation of the current weather. The sim does a good job with stratiform clouds if coverage=100, as multiple posts in this thread have indicated.

1 Like

This is how that looks in cross-section at meteoblue at kdbq right now

Here is a link if someone wants to scroll through the time scale

Cross-section Dubuque Regional Airport - meteoblue

2 Likes

Very interesting! I think you may be correct that the coverage data on these cross-sections is what the sim is getting from the NEMS model.

1 Like

Maybe, look at the red marked area we can see what kind of model is in use. That changes depending on where we look at. It’s not always the same model in use there.

It’s cool that they draw the terrain also on that. Look the bottom black part in a mountainious area.

Like this

Most part of the US use nems global it seems. Here in Sweden it’s nems 12 EU.

2 Likes

I really hope they take care of this whole weather mess as it was one of the major key points they sold with the YouTube series they done before release. Also as mentioned before in the thread, the sun bleed through is terrible. Sunsets and sunrises in overcast looks like an apocalyptic mess.

2 Likes

This is how this looks like. Looks good in my onpinion when it is properly working.

Really low cloud coverage is a problem though. Sometimes they are not vissible at all and sometimes we get those towring clouds.

If i convert 1500m to feet it is around 5000ft and it matches the part above the clouds.

@WxMarc needs to be commended for the time and effort put into testing and drilling down into the mechanics of cloud creation in MSFS.

Thank-you Marc.

I would also like to thank Marc and @SkipTalbot for the continued contribution to this thread.

The unfortunate side effect to this conversation is the constant attempts to steer this conversation back to the other topic involving the overall weather generation system. There are a few threads actively discussing the merits and pitfalls of the weather engine. Those threads have been dominated by a handful of users and have degenerated to the point of having sanctions placed on the threads.

This thread has furthered our understanding of the way MSFS generates the visual effects that we see as cloud. It is not about the overall weather system. It is not about sunset colors. This discussion is about “How MSFS Draws Clouds”.

Can we please, not turn every weather/cloud related discussion into the same banter that ends up with the moderators needing to throttle the posts to keep things from getting out of hand.

Before posting, read the title of the thread. Please.

4 Likes

I just collaborated with @perrry to look at the clouds over southern Finland in the sim currently. The test location was near latitude 60.8N and longitude 26.66E. The satellite image from Meteoblue shows cloud cover over the area, but the detail is not sufficient to see the different cloud layers clearly:

The nearby METARs are all reporting overcast skies with low ceilings:

The 21Z GFS model forecast sounding shows a stable saturated layer extending upward toward 7,400 ft. MSL or so:

This is quite similar to the NEMS 12 sounding at 22Z available from Meteoblue:

The NEMS 12 cloud cross-section from Meteoblue shows overcast cloud cover in the area, with a thickness similar to the saturated layer shown on the soundings:

In the sim, Perrry observed the following conditions (using the latest Beta version):

These clouds look very convective – inconsistent with the stable temperature profile in the soundings. Other screenshots show that the coverage was apparently less than 100% (although there are thin clouds covering some of the patches where the ground is visible):

My tests in the original post showed that a thick cloud layer with less than 100% coverage will look convective due to the default pattern the sim is using for clouds. The only way to tone down the convective appearance is to reduce density significantly below 1. But if the density is reduced, the translucence of the clouds will be even worse (the ground will still be visible after climbing a few thousand feet into the cloud).

I’m not sure why the sim didn’t draw 100% overcast here. METAR blending is apparently not to blame, because all the nearby METARs were reporting overcast. The model data also indicated overcast coverage. The only glimmer of a clue I can find is the thin area of lower cloud coverage in the NEMS cloud cover cross section between 59N and 60N . It’s possible that the sim is blending several nearby model data points to smooth out any sharp contrasts in the data. If that’s true, the narrow region of low coverage would be averaged over a larger area, reducing the coverage parameter below 100%.

Overall, I think this is an excellent example of the limitations of the current cloud system. The default cloud pattern features a lot of convective “bubbling.” If coverage is less than 100%, the convective bubble-like (or cauliflower-like) formations will become visible in the gaps between clouds. To draw a thick cloud layer with truly stratiform characteristics, the coverage either needs to be 100%, or the density needs to be reduced a lot to smooth out the convective appearance. Lower density produces unrealistically good visibility inside the cloud, though.

Ultimately, due to examples like this, I suspect that a second default cloud pattern is necessary for low-level clouds. If the atmosphere is stable, there should be a stratiform cloud default that is far less noisy and bubbly.

8 Likes

On the main M.B. web site it will show you the highest resolution they have available for the area you are focusing on. MeteoBlue has several high resolution models for Europe.

However, I am 99.99 percent certain that MSFS uses the NEMS 30 model everywhere for consistency. When the model resolution increases (from 30 km to 12 km) the size of the resulting data files would increase enormously.

Yes, maybe you are right in the sim. The cross-section is using different models deppending on location i choose to look at that cross-section for. In the sim we do not know what type of model they are using for sure because they have not told us that information. The cross-section matches with the sim though but i’m not sure what model they are using. We can’t choose to look at different models in the cross-section page. It choose models automatically.

Here is a link for some help using the cross-section.

Cross-section - meteoblue

Yes, in the sim it would have to be the NEMS 30 model, because it is the only MeteoBlue product that has worldwide coverage.

Nothing wrong with using the higher resolution tools on the M.B. web site though, other than the fact the the higher resolution European models may also be updated more often, so the data they show may not exactly correspond to what is being injected into the sim.

As WXMarc has discovered, it appears that the biggest limitation right now is a limited variety of basic cloud types and a limited number of parameters that can be set to control their appearance.

2 Likes

Yes totally agree with that :slight_smile: And maybe not reducing the coverage below 100% when it should be 100% :slight_smile:

1 Like

Just curious, what do you see not matching METARs? There’s the known (fixed in the beta I think? I’m not using it) bug about cloud height erroneously being rendered as MSL, but other than that I’ve seen very good results. Winds, vis, precip conditions, and ceilings at sea level airports typically track pretty darn good for me.

I do understand that real world winds and temps were being injected pre-SU7, but now the visual phenomena are there as well. I’m puzzled as to how that’s not seen as an improvement.

A discussion on clouds “perilously close” to being locked? Geez, what’d I miss??

Regarding cloud density, I will offer that wintertime stratus are often pretty diaphanous. Especially when in snow showers, it’s often difficult to tell exactly when you enter or exit the cloud base, as you maintain some vis straight down with little or no forward vis. Obviously stratus shouldn’t always look like this, but at least it sometimes does.

1 Like

This is really useful information. If there are reliable indicators for when a stratus base is translucent vs opaque, the sim might be able to replicate that effect. For example, if translucence occurs when precipitation is falling, the sim could draw lower density in areas of precipitation.

Yes it is useful information as it comes from a real life 737 pilot and can only add to the veracity of your analysis