Its easy to get confused… much like how I did a linear trendline based on the numbers but did not factor square root which is what the OP’s findings are based around and therefore not a linear line.
Above is a new trendline (included in an edited post) based on the square roots (converted to percent) of settings 0, 100, 200, 300, 400, and 500.
Again, I am doing this out of curiosity of the line it creates to visually determine what the actual percentages are of each LOD setting and the ones between because I find this whole thing very interesting.
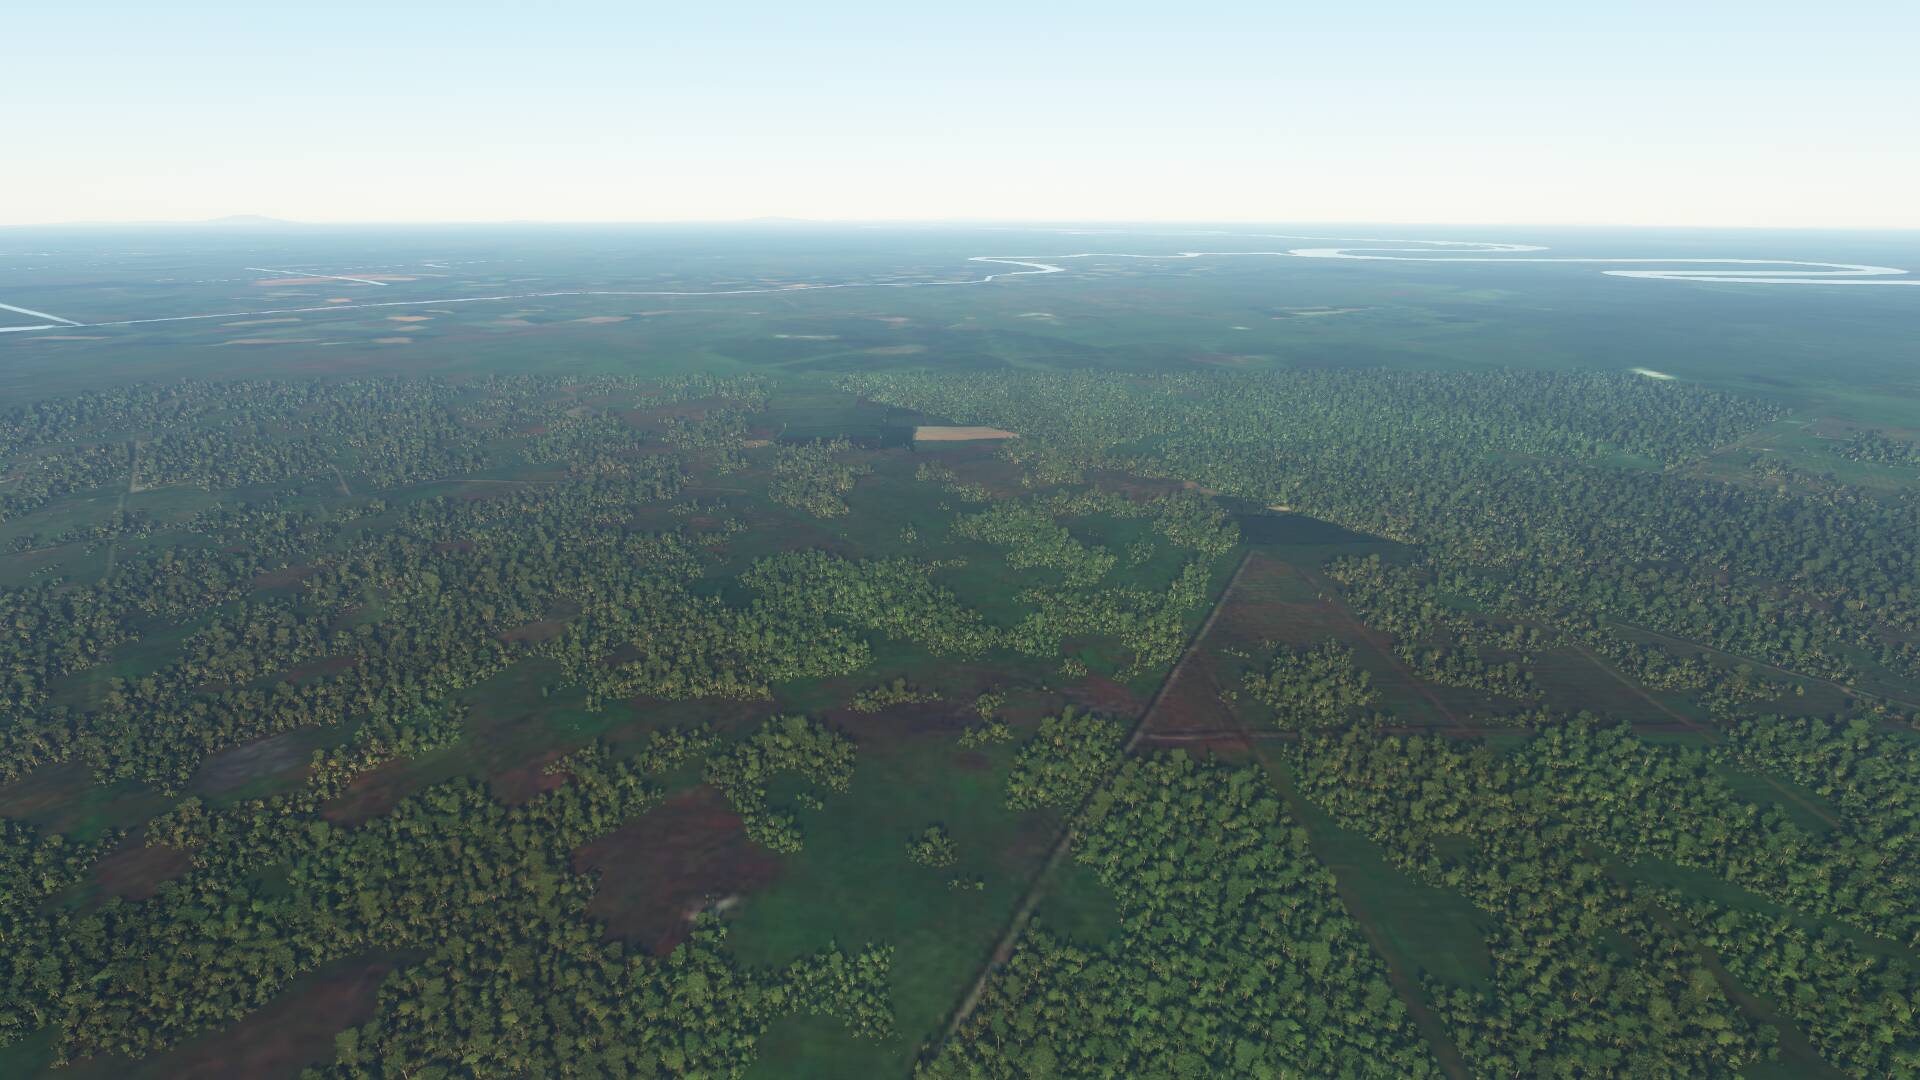
If draw distance is 100 at the equator, it’s only 34 at 70 degrees North or South.
(and 0 at the poles, however there is nothing from 85 degrees up, no terrain, no water, nothing)
This is LOD 10 at the equator (Pontianak, Indonesia)
thank you for this graph! that explains a lot!
So if we had to revert back to 200 ingame setting now we need to set the Terrain LOD in cfg to 4.0! Oh boy…
Increasing that alone already has a big hit on performance as you are asking your CPU,RAM then your GPU to do twice as much work. Maybe one of the reasons it s like that as I am quite certain the majority running this sim their rigs are probably struggling with that setting.
As DX12 roles in we may possibly have a preset higher than Ultra Lets see what Asobo does.
Personally prefer to see further performance improvements before tackling the LOD setting.
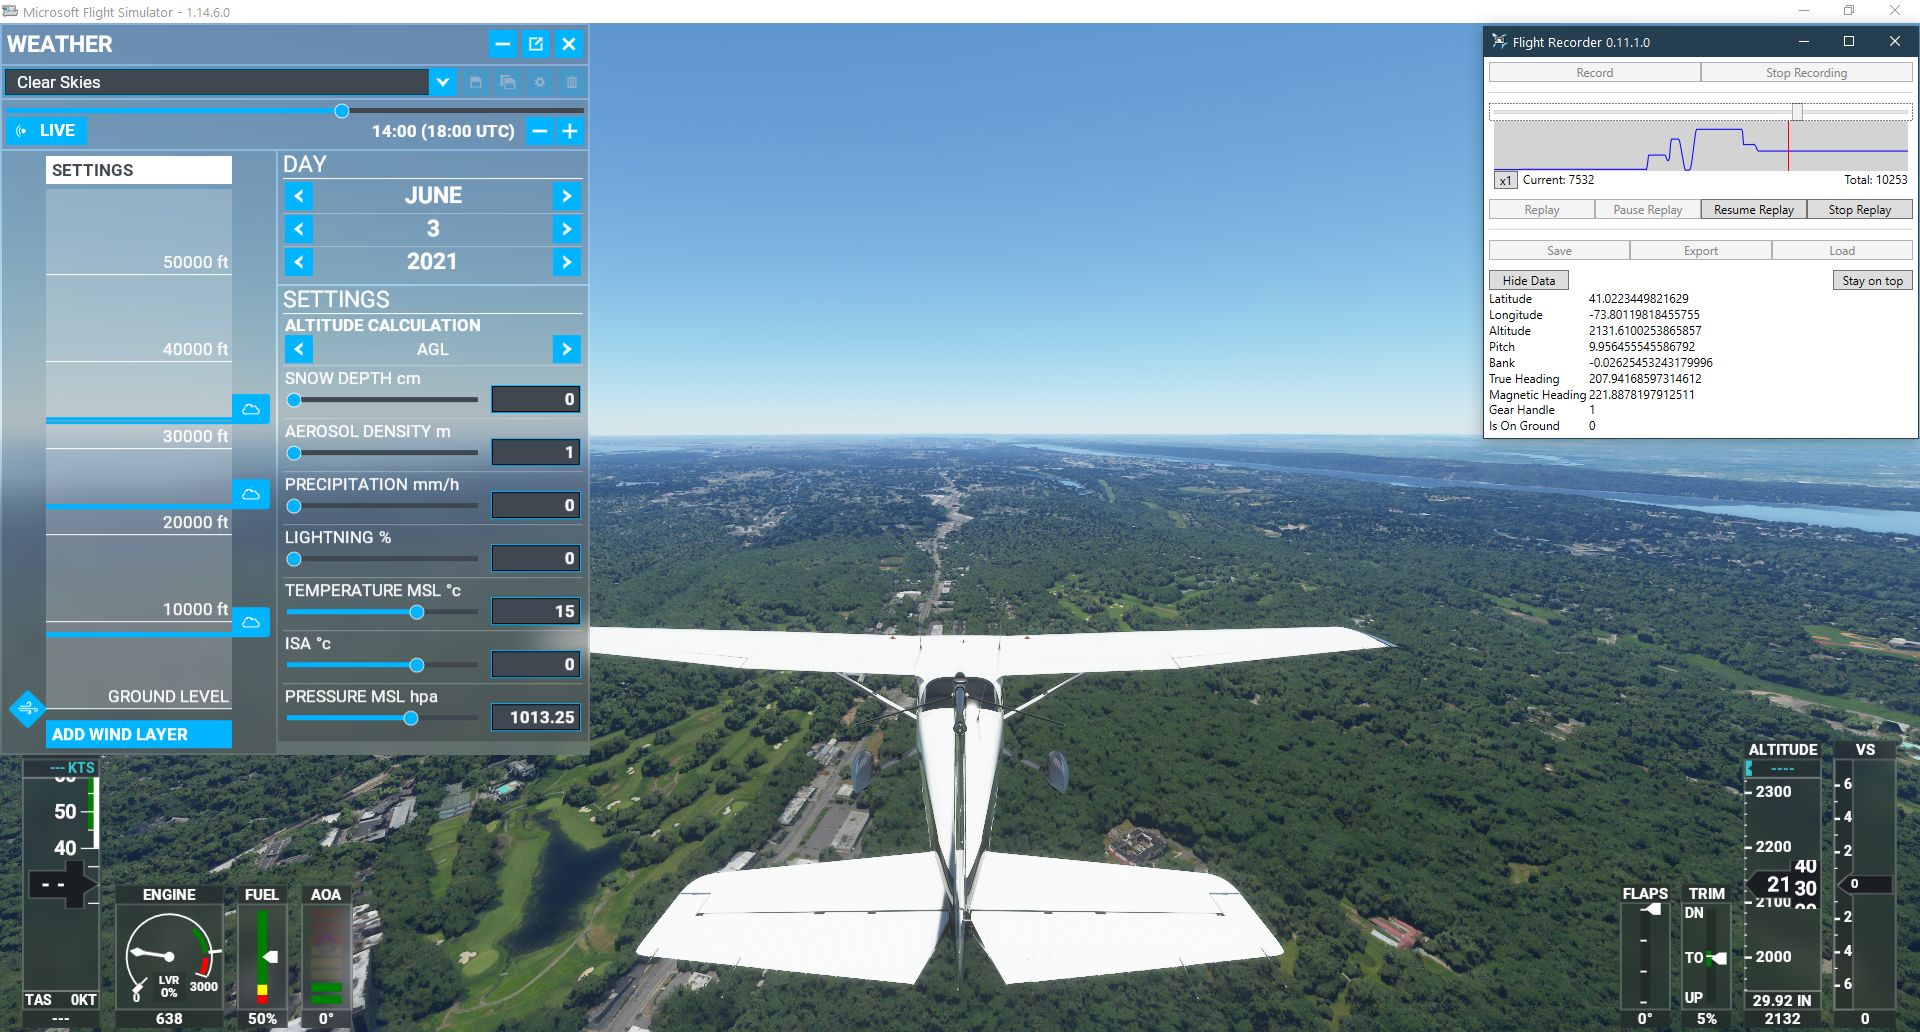
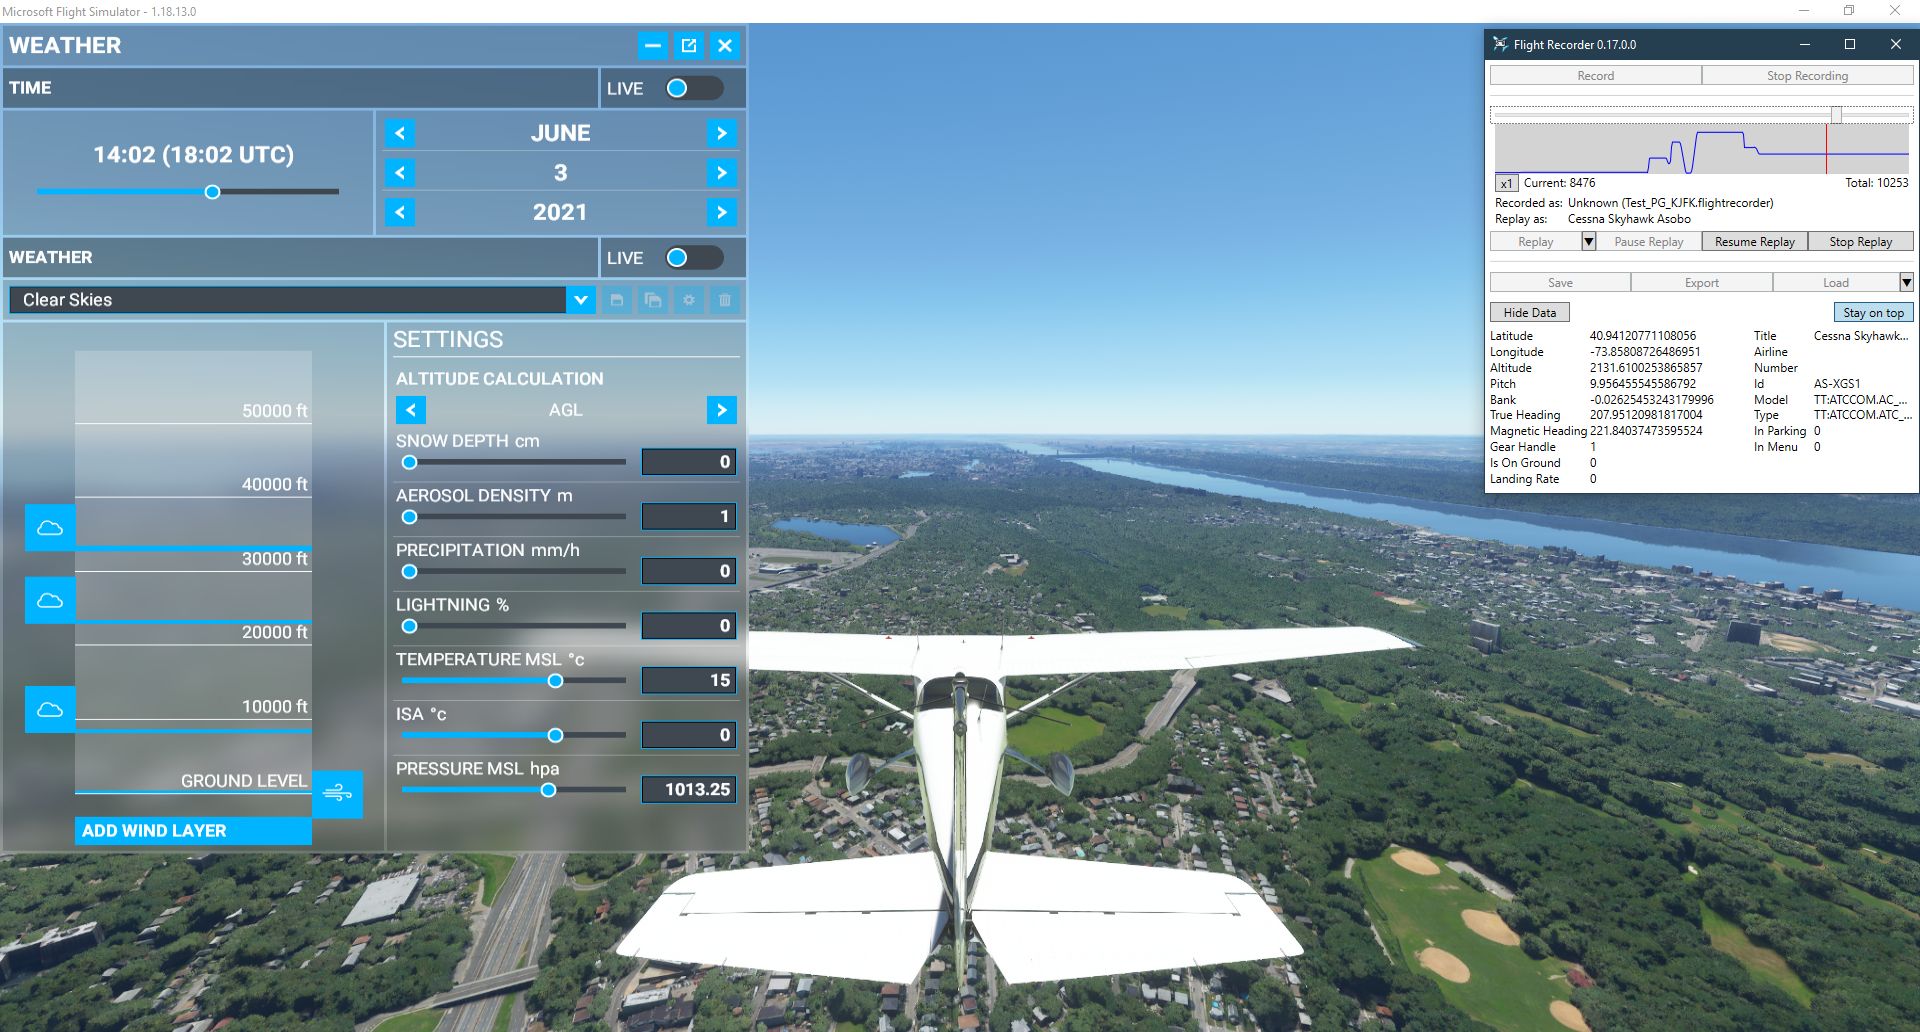
I hope people are taking a wide selection of screenshots to compare with before SU5 arrives. I have a suspicion LOD and other graphical elements are about to change and it would be good to have proof either way.
Yep they are sure to be downgraded again, I really hope I am wrong. But I am fed up of the constant downgrades to increase performance, when there is nothing wrong with the performance if you have the appropriate PC running at the appropriate settings.
Do we have to spot the 7 differences? I don’t get why you posted twice the same screenshot and why they’re not from the same place.
What are we supposed to see here?