This is the way things are measured in OpenXR Toolkit:
app CPU is the time measured
- From the moment the OpenXR runtime tells the game: we’re ready for the next frame
- To the moment the game finishes submission of the frame for display and begins waiting for the next frame
This is a universal definition of “all the time an app take to make a frame, minus any time spent waiting”.
rdr CPU is the time measured
- From the moment the app manifest its intent to start drawing a new frame
- To the moment the begins submission of the frame for display.
Now the definitions of MainThread and RdrThreads are… I have absolutely no idea. This isn’t documented anywhere is it? So who knows what they measure. These aren’t standard measures. They measure “stuff that Asobo finds useful”.
What I see from your screenshot is that:
app GPUmatches exactly “GPU” from MSFS overlayapp CPUmatches exactly the frame time right under your FPS in the MSFS overlay- the MSFS overlay tells you you are limited by CPU (I think? It’s hard to read if it’s a C or a G), just like the OpenXR Toolkit overlay tells you.
In order words: OpenXR Toolkit and MSFS overlay agree, but they use different naming conventions.
My guess is that MainThread and RdrThread have somehow some overlap, but this is not indicated by the overlay. Thread = thing that runs in parallel. The MSFS overlay doesn’t provide any information about what runs in parallel and what sort of phasing (delta between when a thread runs and another one starts running).
Yet the DevMode overlay is telling you in plain letters “Limited by CPU”? (again please help me read if this is a C or a G… looks like a C to me).
“loads” are 100% not representative of frame times. You have multiple CPU cores, and as described above, it’s isn’t clear from the overlay what interdependencies there are between threads. For example, let’s assume the following guess:
- MainThread is pinned to Core 0
- RdrThread is pinned to Core 1
- Top of the frame loop, MainThread wakes up, performs some work related to game logic, networking, physics… you name it. You have load on Core 0.
- Meanwhile, RdrThread is waiting until the MainThread has a sufficient clear picture of what needs to be rendered. When this happens, Core 1 is idle.
- Eventually MainThread signals RdrThread to wake up and do its job. At this point, you have a load on both Core 0 and Core 1.
- At some point, MainThread might run out of work to do, but since RdrThread is not done doing its work, MainThread has to wait for it. It goes to sleep. Core 0 is now idle.
- Eventually, RdrThread completes and signals MainThread to wake up and finish frame submission. At this point Core 1 is idle again and load is on Core 0.
- MainThread finishes its work and submits the frame for display.
We can try to do a cheap timing diagram of this showing how neither Core 0 nor Core 1 will run at 100%:
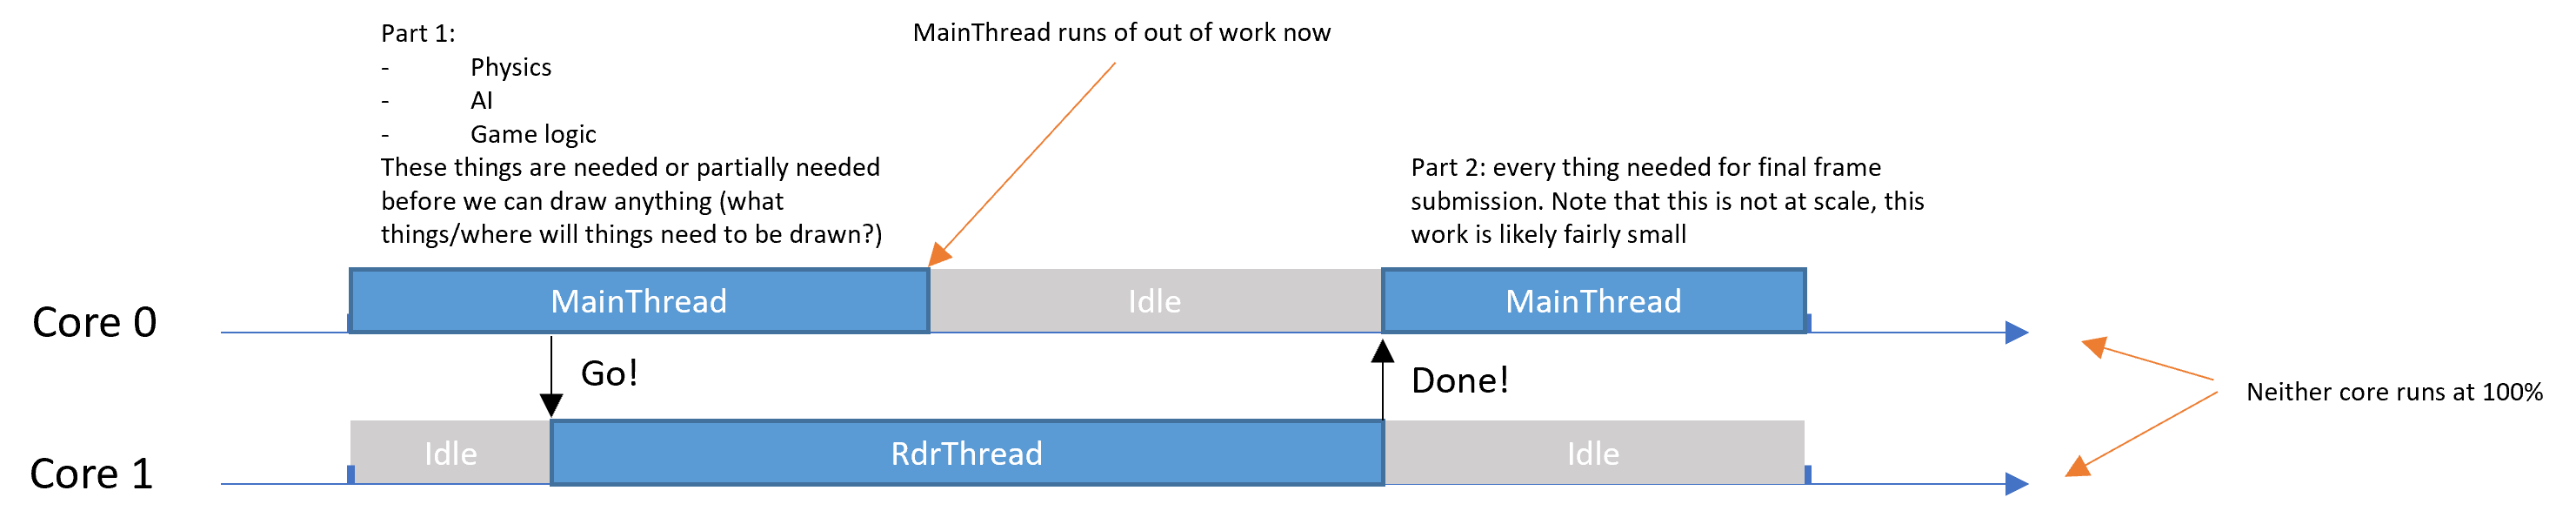
As you can see here too, MainThread and RdrThread both participate to CPU frame times, but not in a predictable slice. The total duration of MainThread does not corresponds to the frame time on the CPU due to the idle/hand-over to RdrThread in the middle.
Now IF you CPU was faster, both the time spend in MainThread and RdrThread would be shorter, which would lead to faster CPU frame time.
However, IF you CPU has more cores, but these cores aren’t any faster, your CPU frame time would remain identical.
Going back to comparing measurements from OpenXR Toolkit, this is the (tentative) picture I draw:
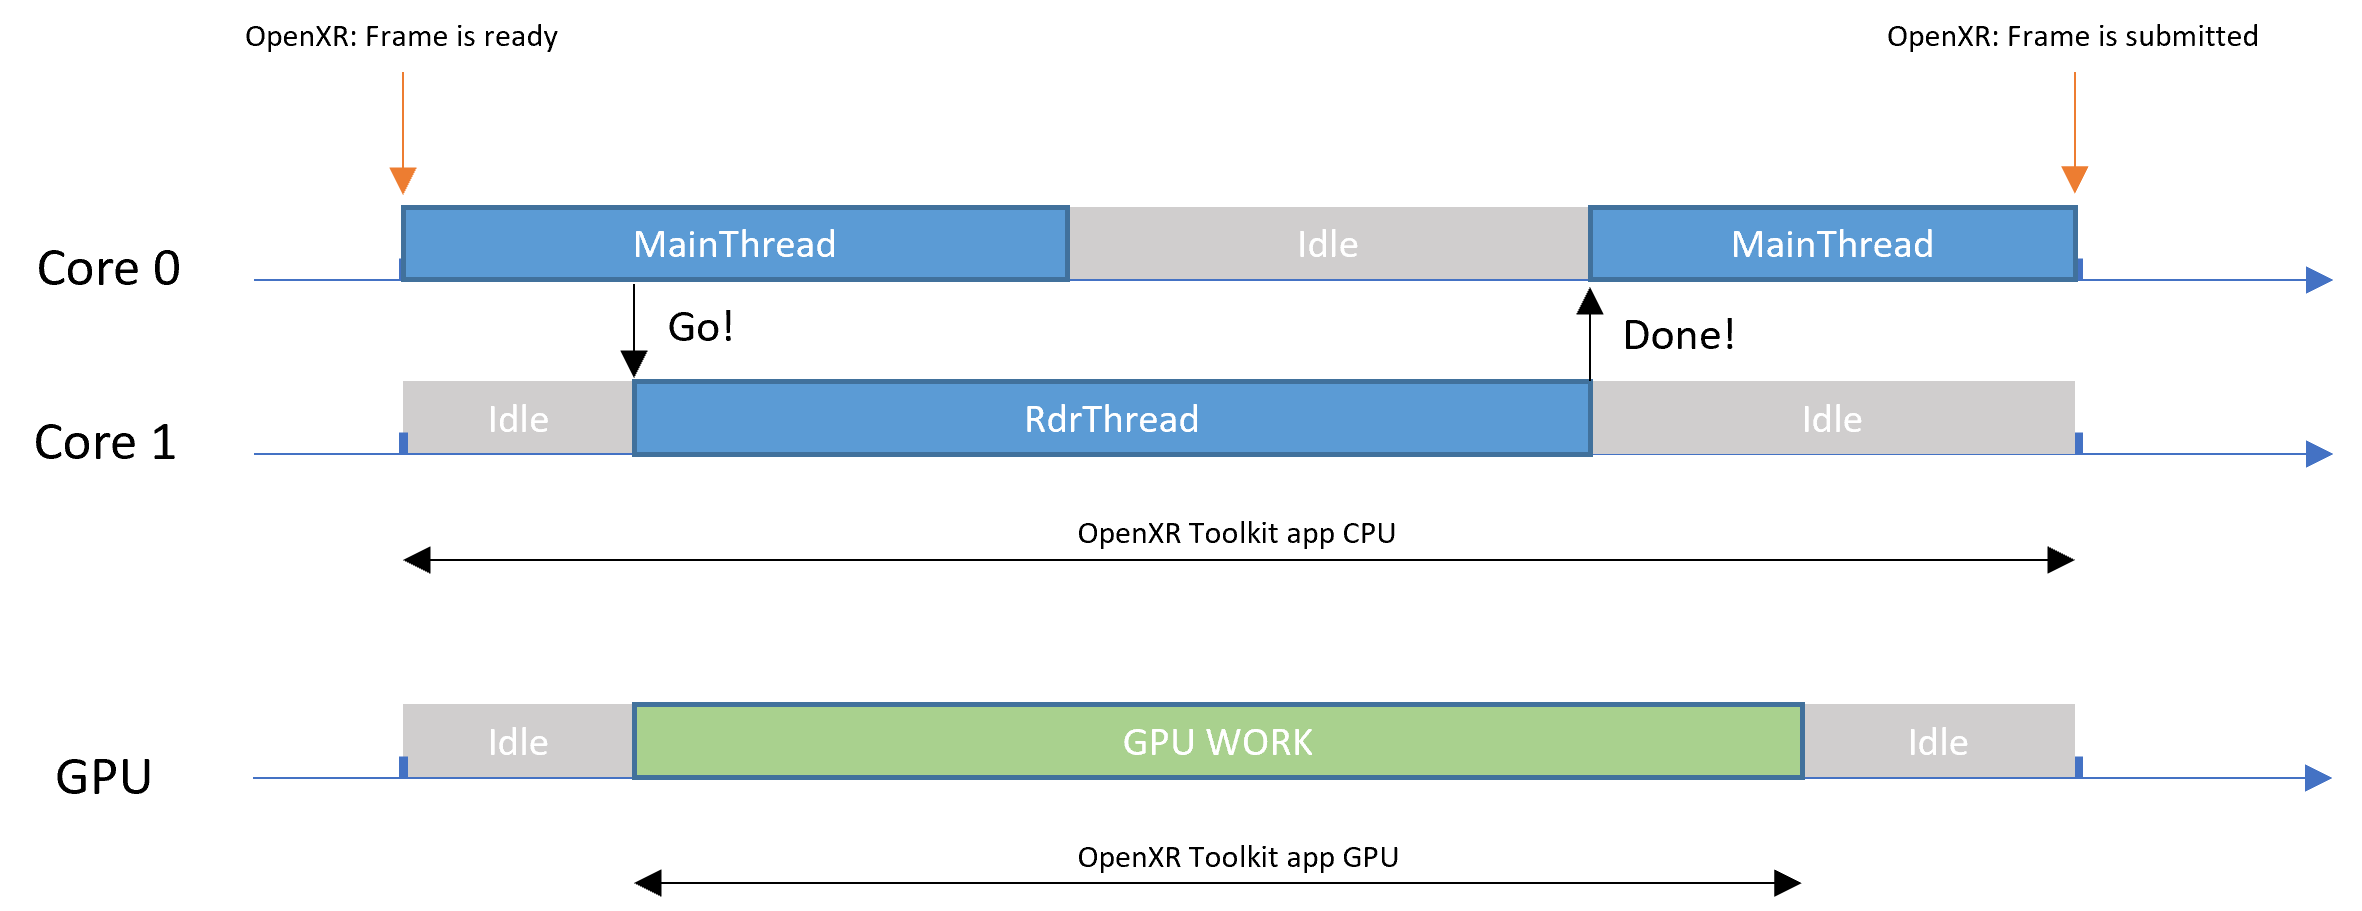
I said TENTATIVE because Asobo and only Asobo knows what MainThread/RdrThread do and how they interact with each other. Therefore this is a best guess based on how typical multi-threaded applications would perform.