RollingCache.ccc performance debugging … under SU3

Overview of RollingCache.ccc performance … under SU3

When FS2024 launched, the problems of the entire data pipeline have been obvious and frustrating … for me and many others.

In order to better understand what was going on and if there were ways to reduce the pain, this little goose started to collect information about the Rolling Cache (RC) and documented all the findings and ideas in this thread:

Ten month and three sim updates later I am planing to revisit the subject of the Rolling Cache in order to check and document the progress.

  • This initial post will get updated over time in order to collect the key points.
  • I plan to write individual posts related to individual subjects.
  • I do not plan to repeat all the details from the initial thread
    • … but I will try to provide links for those who want to read more about the history and the technical background.

Overall the release notes for the last three sim updates all had an impressive list of bug fixes … e.g.

However, only a handful of those items could clearly be identified as related to the RC, the servers, or the data pipeline. None of the items provided “real” information about what was changed at a technical level.

So a goose must do what a goose does … I guess.


High level summary of the RC status in SU3

(the following is a quick preliminary list … while I am starting to write the more detailed background postings)

Positive aspects

  • Launch times are fairly consistent
    • … with a little under 3 minutes (on my system)
      • … instead of 3 to 5 … or even up to 60 minutes (up to SU2).
  • Backend (CDN or database) servers seem to be a lot more responsive
    • … as I have (since SU2) not seen heavily stressed or de-facto unavailable servers.
      • Only the “initial Xbox log in” connect failure still comes up … very often.
  • SU3 added manual caching to “MyLibrary”
    • … in the form of “old school” package downloads outside of the RC.
  • Online data usage counter now is a correct GB counter
    • … and (most likely) it also does correctly reset to zero on the configured day.

Negative aspects

  • Marketplace images (and other data) are still not cached locally (e.g. in the RC)
    • … which causes the UI to feel slooooow … and causes unnecessary IP traffic.

Rolling Cache file structure

  • Under investigation … but it seems unchanged … meaning:
    • There is only a single RollingCache.ccc file
      • … fully “zero fill” preallocated on the storage device.
    • A fixed index size of 512 MB.
    • A fixed index item size of 72 bytes.
      • This limits the RC to a maximum of ca. 7.45 Mio blob items.
        • With an average of ca 30 KB per blob item that translates to
        • … a maximum “really usable” RC size of ca. 220 GB.
6 Likes

Love your posts – have read every word of the prior ones. A couple of things I’d be interested in your updated opinion on:

  • What’s the optimal cache size? I have lots of space but still have my cache set to 256GB.
  • Is there anything that indicates that people should clear/delete/recreate their cache’s with any frequency? Should it be part of routine maintenance or something to do with each and every update.
  • Any new findings about what is currently being cached or not cached?
  • Does use of a larger cache reduce overall WRITE activity to your SSD drives? I know frequently recreating 256GB cache files is not good for them but hope the cache indirectly reduces the absolute number of writes to the SSD. If everything streamed (and not read from the RC) is also written someplace during use, cached data reduced write actively AND network activity.

Looking forward to the updates.

FYI, for those that missed it, Sebastian Wloch discussed the Rolling Cache in the March Developer Livestream

2 Likes

Back in March I did not comment on the dev stream because the information about the RC was not too “deep” and mainly touched those aspects:

  • Info that the RC had a lookup bug, which was fixed in SU2
    • … and that should reduce download activity.
  • What happens when the RC is 100% full?
  • What happens if old versions of a package are still in the cache?

However, I did cover the February dev stream in a lot of detail over here:

I also did a deep dive into the 100% full RC over here:

RollingCache.ccc performance debugging and tuning … How? - #134 by nenenui

To not mix too much stuff together I will try to answer your questions in individual posts.

In short …

  • I would keep the size you are already using.

@BearsAreCool510 had a dedicated thread to the question of an “optimal size” for the RC … and my answer is over here:

However, in most cases “highest FPS” is the primary goal.

In your case … @mjchernis … your tradeoff priority seems to be more about: SSD write stress

I did a deep dive about data volumes over here:

Approx data demand at “Ultra everything” for looks something like this:

  • 1 to 2 GB for the active aircraft
  • 5 GB for a major international airport … with lots of static “Ultra” aircraft
  • 1 GB per 10 minutes … “low and slow” over a TIN area (e.g. LA)
  • 0.5 GB per 10 minutes … 70 ktas and low above ground over normal flat landscape (e.g. in Illinois)
  • 0.25 GB per 10 minutes … 70 ktas and 2,500 ft above ground over normal flat landscape (e.g. in Illinois)

If I fly faster (e.g. 200 ktas = factor 3) then the volumes naturally do go up. So in the extreme “worst case” I would calculate with 20 GB/h of data downloads.

Today even cheap QLC-NAND SSDs have a write endurance of around 250 TB per TB capacity.

So for a very small 1 TB SSD it means you could fly for 12,500 hours in TIN heavy regions in “all ultra” before you reach the SSD write endurance “warranty”.

Now if you have “lots of space” and do fly over “normal” (and more interesting) landscape than I would guess that you can multiply the hours by 10 to 100 before you hit a SSD write endurance risk area.

1 Like

This is … still … a tricky question.

I did a deep dive into this topic over here:

The one line summary would be this:

  • 50 to over 90% of all data written into the RollingCache.ccc file is useless, unchanged index area!

… and … spoiler alert … the underlying issue to excessive RC index writes is still present in SU3. I will post more details in the next week or so.

However, this is most likely “only” a major performance problem for the sim.

As I explain in the linked post, the impact on the actual SSD write activity is still unclear to me … and the official Windows documentation on “FASTIO_WRITE” is not helping here.

Regarding you point …

If everything streamed (and not read from the RC) is also written someplace during use, cached data reduced write actively AND network activity.

… I think that in FS2024 this is not possible.

  • Streamed data always goes into the RC
    • … unless it is live traffic, or marketplace, or …

But … obviously … for airports and aircraft you can now cache manually in SU3 (aka download a package). That is outside the RC … only written once to SSD … only downloaded once over the network.

That trick, however, will not work for landscape data.

Personally I am using a 250 GB RC because it clearly does reduce the network downloads and that does clearly speed up some aspects of the sim. But then … I am a sightseeing goose and do not care about FPS … but mainly about 4K-Ultra everything photos.

I hope this somewhat answers you bullet nr. 4 questions.

And … uups … I think I did hit the “3 posts in a row” thread limit … could somebody please leave a post below this to unlock this thread for me again? Mahalo!

1 Like

Great info much appreciated!

1 Like

Useful tools for the Rolling Cache analysis

Just like during the initial RC analysis I am mainly depending on information that I collect via the following tools:

  • Resource Monitor
    • Comes preinstalled with Windows.
    • Can filter system activity for the FlightSimulator2024.exe process.
    • Provides a visual high level live overview of the system usage (cpu, disk, network, memory) over the last minute.
  • Process Monitor
    • Provided by Microsoft for free via the regular app store as part of the Sysinternals Tools.
    • Performs a highly detailed analysis of almost all system activities
      • … by obtaining a sampled and filtered event recording for a certain period of time.
    • Process Monitor - Sysinternals | Microsoft Learn

Resource Monitor details

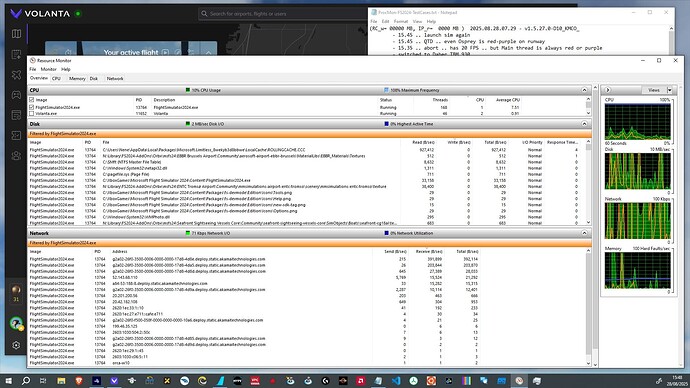
The following is a typical screenshot of Resource Monitor:

The primary features that I use are:

  • Filtering information for certain processes
    • … which usually is only the FlightSimulator2024.exe.
  • “Disk” … shows a list of all files
    • … which have been accessed during the last minute.
  • “Network” … shows a list of all network connections
    • … which have been active during the last minute.

I was never using the “Memory” view, because that IMHO does not seem to provide any practical insights for the RC related questions.

Back in 2024 I sadly did not pay enough attention to the fact that …

  • All recordings (e.g. File Read B/sec) are the average number over a one minute period.
    • So a lot of files or servers are still visible in the list even when they are no longer in active use.

It is a good idea for Resource Monitor to use this technique … but I simply was mislead a couple of times during my analyis.

However, a more serious issue is this:

  • Write operations to the RC file are not visible under the FlightSimulator2024.exe process.

I still do not fully understand why read activities are visible … and write is not. My current best guess is that this might be related to “FAST_IO” file activities bypassing some normal filesystem APIs interactions.

All in all Resource Monitor is good for “watching” the activities of a process

  • … but it cannot produce a recording for further investiations
  • … and it provides zero information about write activities into the RC.

Process Monitor details

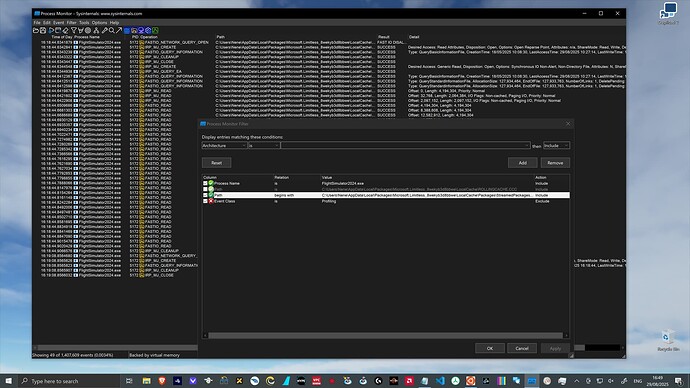
To quote the official documentation:

Process Monitor is an advanced monitoring tool for Windows that shows real-time file system, Registry and process/thread activity.

The tool is very good for:

  • Performing a highly detailed analysis of almost all system activities
  • … by obtaining a “full” event recording for a certain period of time of
    • file (disk) usage
    • network usage
    • memory usage
  • … and then extract specific events by applying searches and filters.

The tool is not good for:

  • Collecting information over very long periods of time (e.g. multiple hours) is problematic.
    • As it collects all individial OS events the amount of data will get very large.
      • e.g. a flight in FS2024 can result in around 2.5 GB per hour of raw event data.

Sometimes Process Monitor did crash on me the moment when I tried to save very large recordings … which resulted in a loss of all sampled event data. With smaller recordings (below 1 hour) I never had any problems.

However, the most important aspect is this:

  • Process Monitor does not capture 100% of all events
    • … as it is more of a periodic “sampling” kind of recording.

The results are e.g. that some numbers simply do not add up (exactly), or that not all writes to a file are visible.

Prior to January 2025 I somehow missed that important fact, which caused me to interpret some of the numbers incorrectly, leading to fundamentally wrong assumptions about the FS2024 network downloads and the RC activity.

However, this all does not change the fact, that Process Monitor is still by far the best tool that I have found on Windows to collect low level insights without any noticable impact on FS2024.

Other tools for the analysis

Over time I increasingly started to also use …

  • Windows Subsystem for Linux (WSL)
    • … which allows me to automate some analysis with regular UNIX command line tools.
  • grep
    • … a very capable UNIX tool for filtering the lines in large text files.
    • Very useful in combination with the CSV exports of Process Monitor recordings.
  • FS2024 Debug -> Display FPS
    • A feature of the regular “Developer Mode” of the sim.

I also have some tiny tools to paint those “RC byte range usage” pictures, which I did use during the initial analysis to get an idea of the RC change and usage patterns.

Debug -> Display FPS overlay

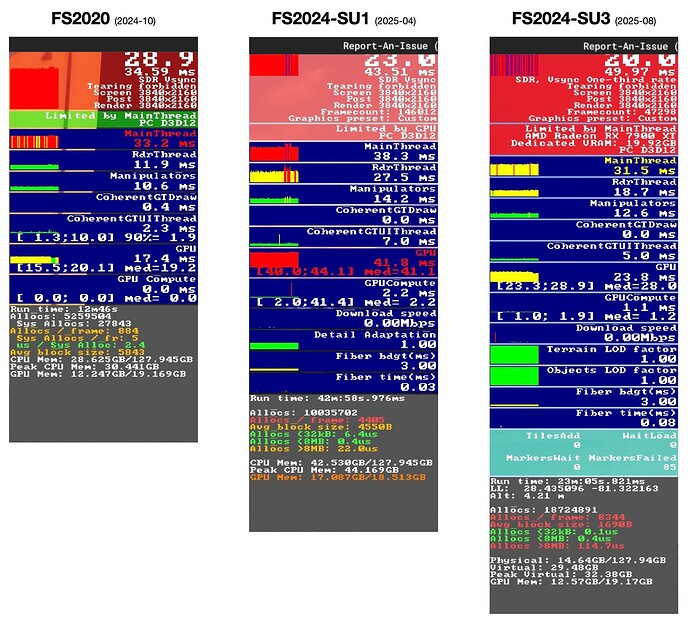
For the new SU3 analysis I especially started to pay more attention to the FS2024 Debug -> Display FPS information.

(Note: … the reduction in FPS numbers means absolutely nothing, as all screenshots have been taken under totally different circumstances)

The above image shows the evolution of the Debug -> Display FPS overlay from FS2020 to FS2024 SU3.

I am still confused about the actual meaning of most of the numbers, and I have not found any good documentation (yet).

What I am already using is …

  • The new “Download speed” indicator
    • … which I can compare to other data from other tools.
  • The new “Tile” and “Marker” related info
    • … even when I have no clue what they really do indicate.
  • The millisecond render pipeline measurements
    • … because I hope that I will find a pattern that might help to answer the question if there (still) is RC related stuttering.

To summarize this tool related overview:

  • The event recordings of Process Monitor
    • … are still my most important source of insight.
  • The new Debug -> Display FPS information
    • … will hopefully help me to get a better idea if there (still) is some RC related FPS stuttering.
2 Likes

These are questions I’ve had since I first read your initial thread on the topic.

  • Where does RAM fit into the sequence of delivering both streaming and cached data to the CPU/GPU?
  • What role do other caches play in the data pipeline (scenery cache, for example?)
  • Am I right to assume that shader caches have a direct pipe to the GPU via the graphics driver?

Thank you for another detailed thread on this important topic.

1 Like

… I am wondering about all those aspects myself.

We are (so far) constrained to looking at a very black box of “stuff” … and it is mainly an educated guessing game.

It would be really nice if Asobo would give a tech deep dive talk at some gaming conference, talking about the lessons learned, the nifty edge cases of all those GPUs etc, and all the rest.

I know … I know … but a goose is allowed to dream, or not?

1 Like

That was one of my big takeaways from your first RC thead:

“We don’t know what’s in the Rolling Cache or how it actually works, because they won’t tell us.”

I know it’s wrong of me to think this, but sometimes I think they think we are all 14 year-olds playing with toys who have Mom’s credit card.