Testing the new airflow simulation

Preparation

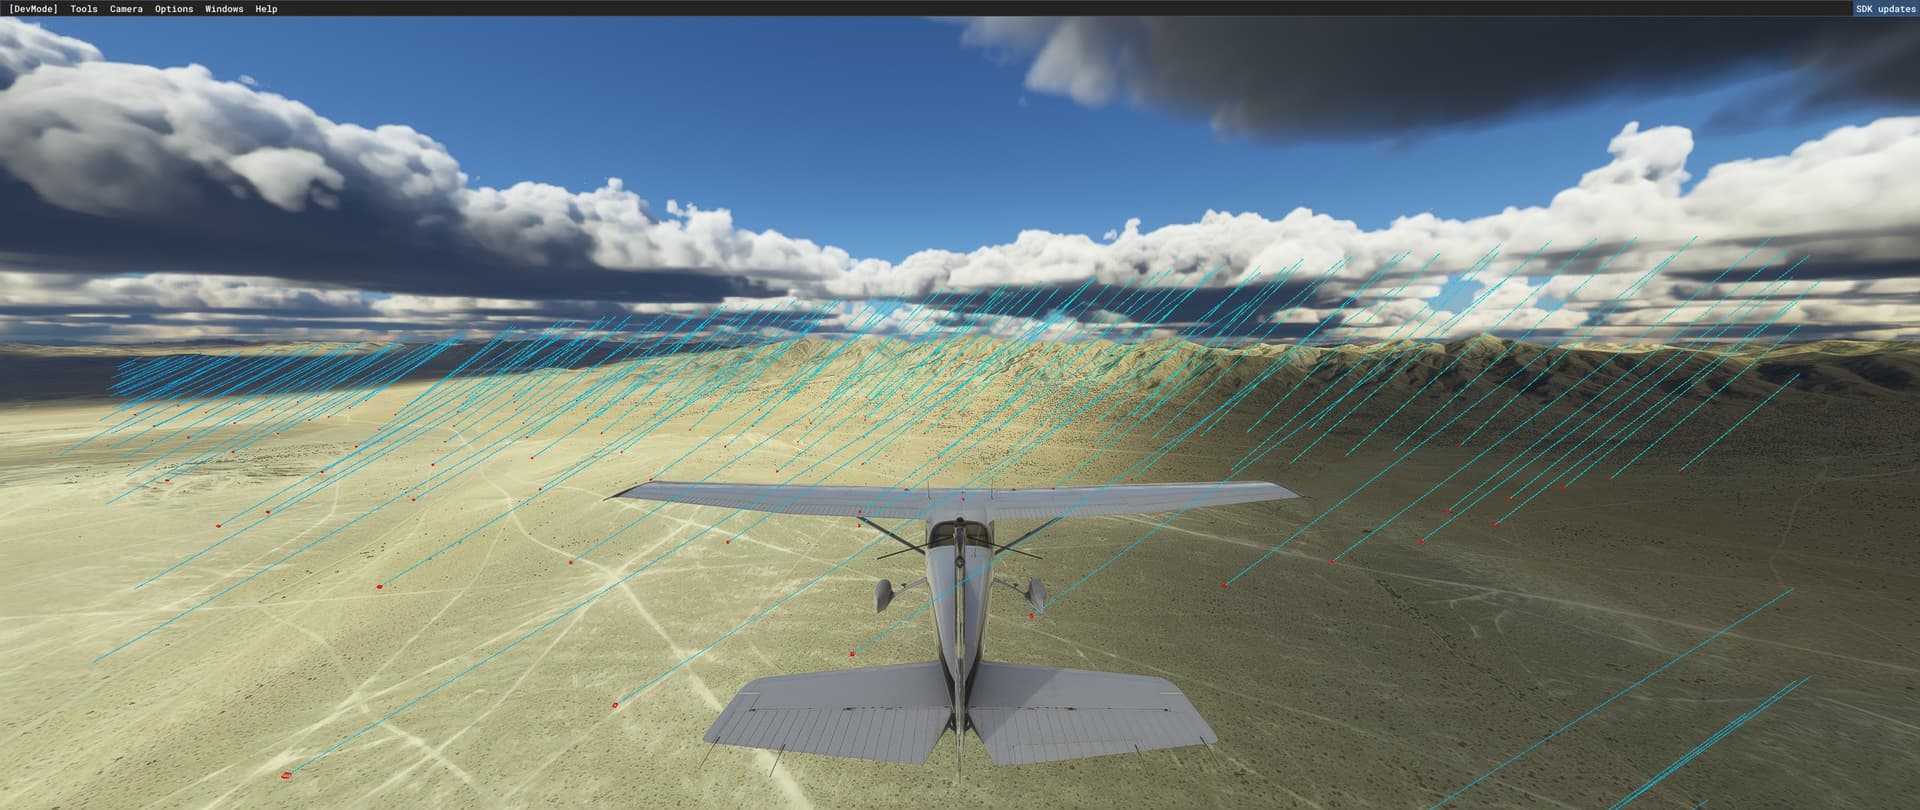
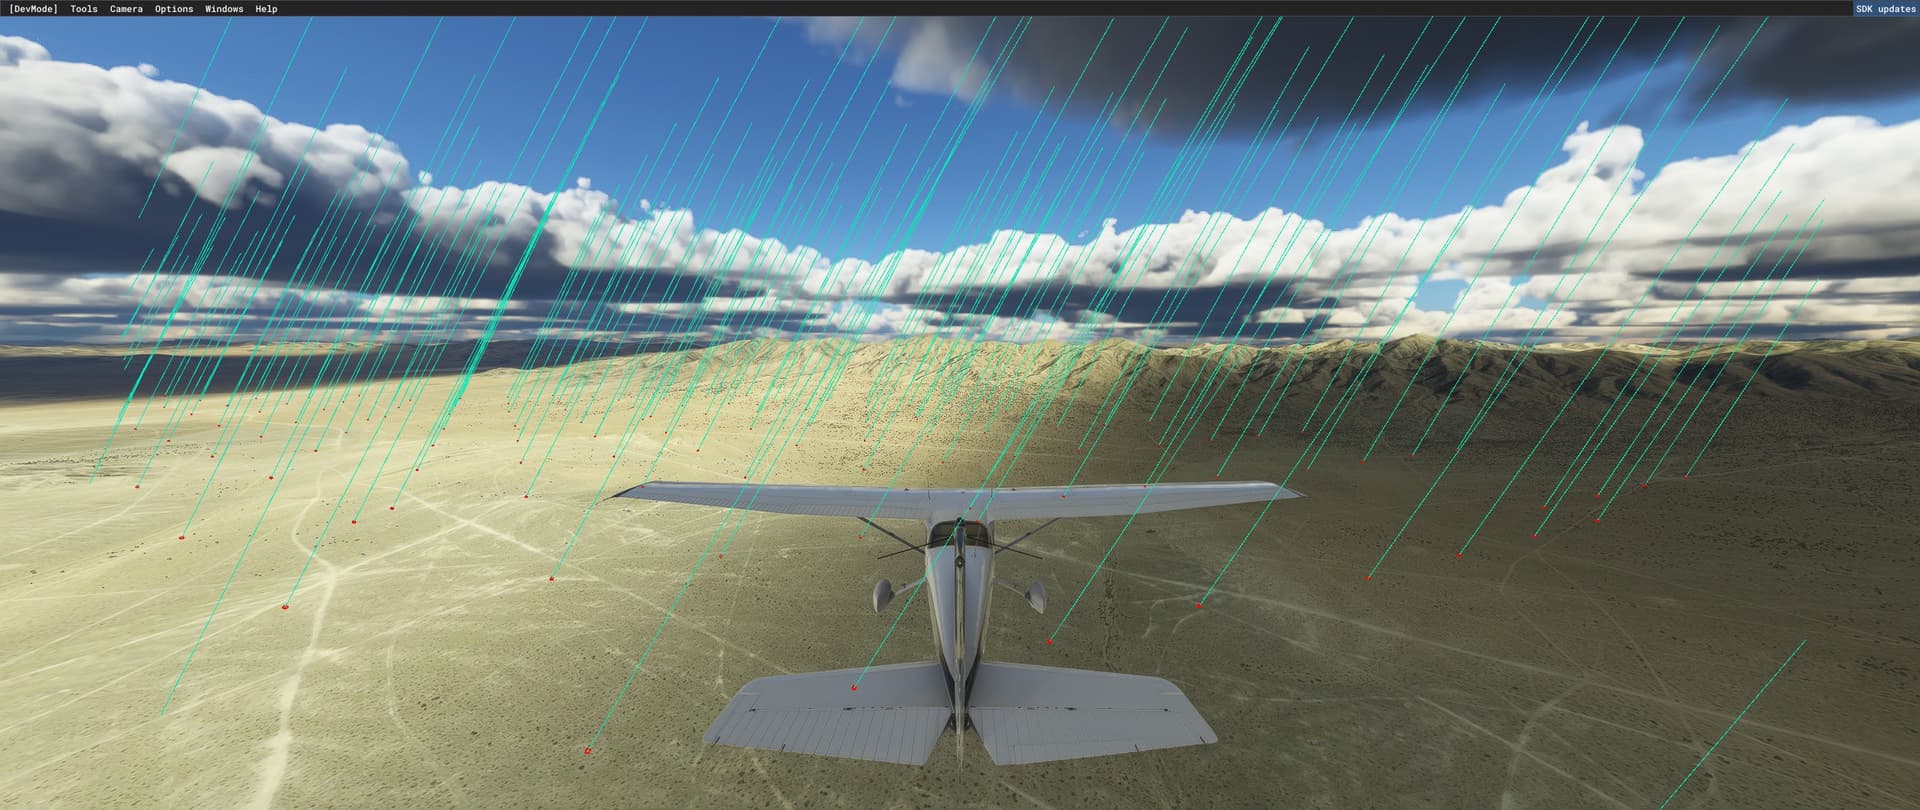
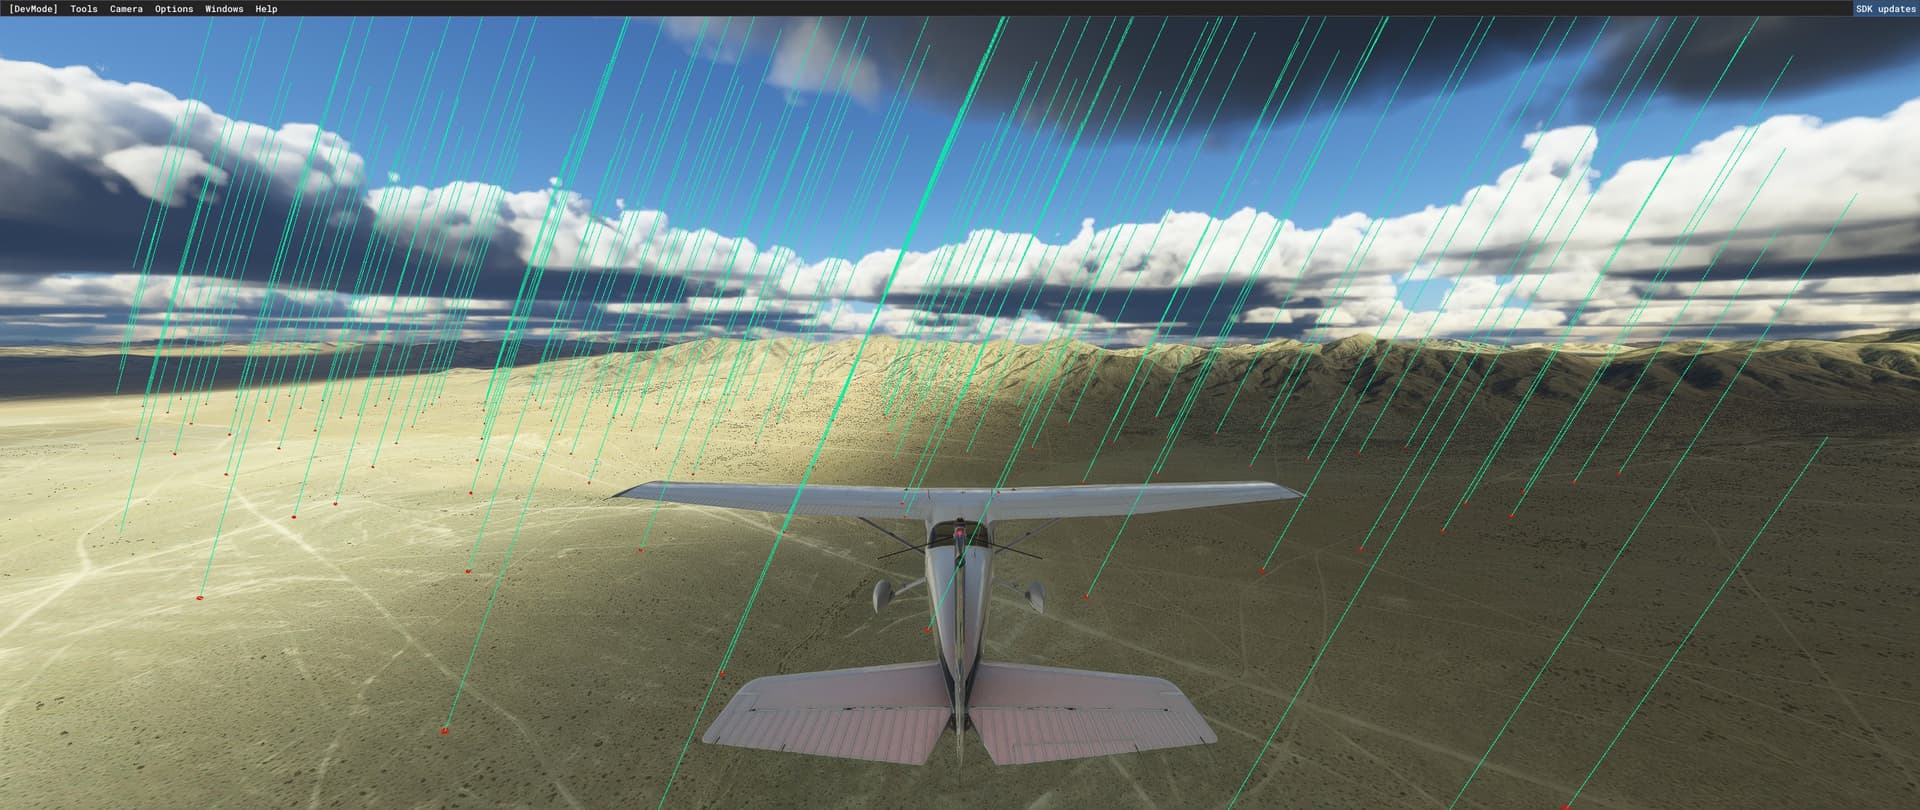
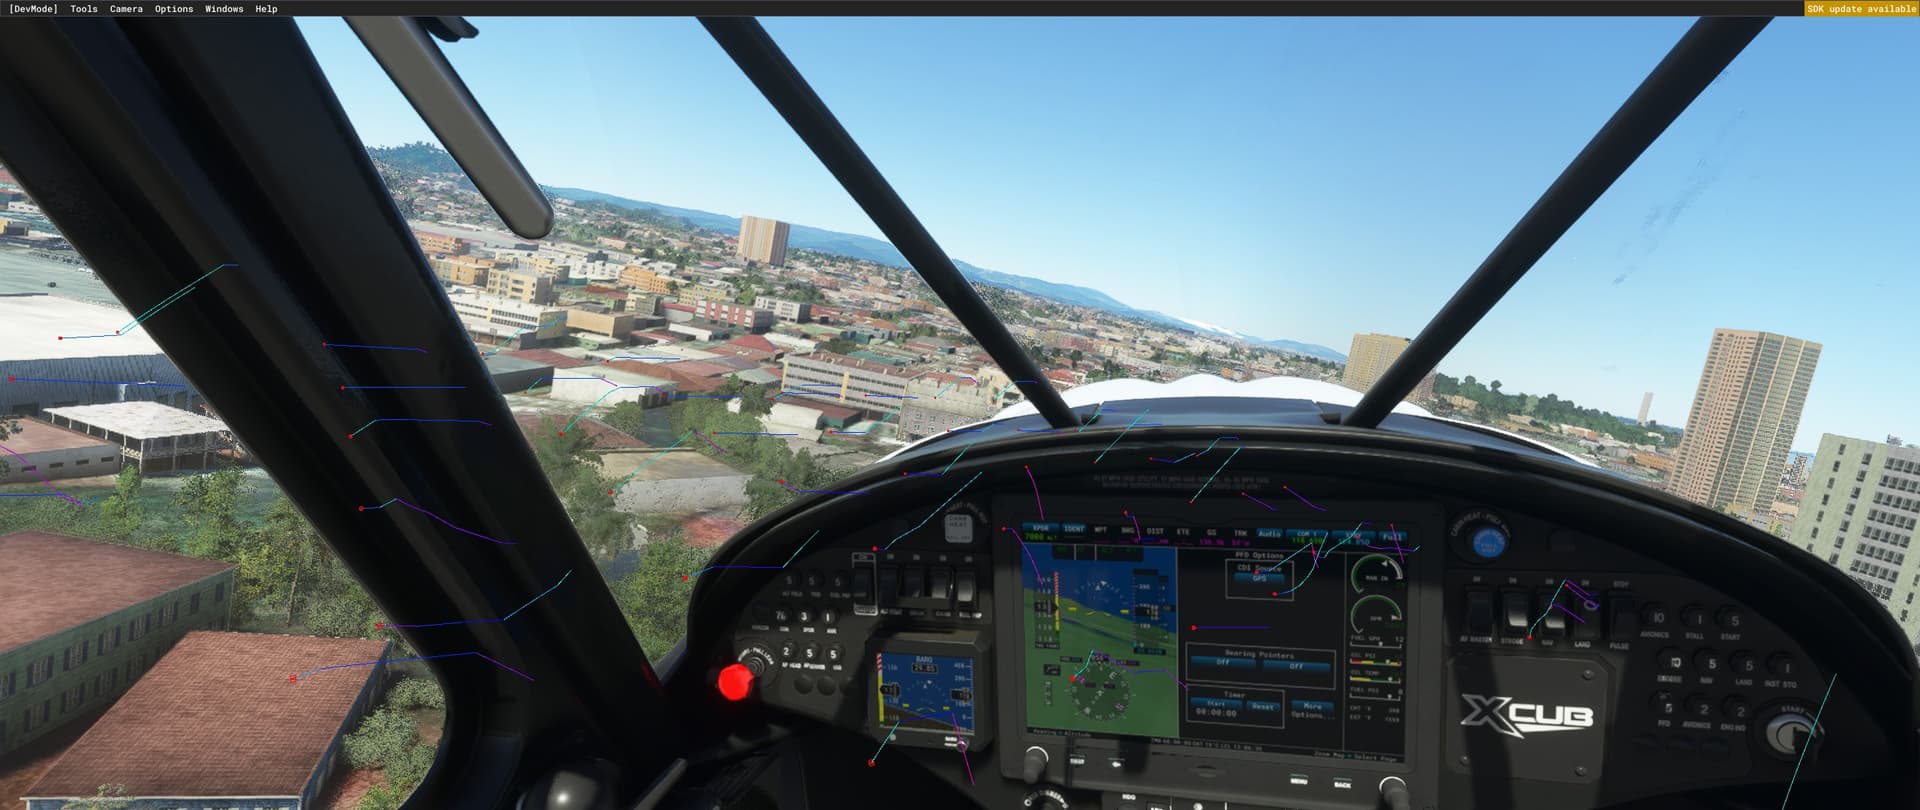
To test the proximity airflow simulation, spawn in the air above the area you would like to test in a light aircraft (should have interesting terrain - not above water.) and enable dev mode. At the top menu select Options → Debug Weather. A window will then open. In that window, enable “proximity airflow visualization”. The rest of the visualizations should be disabled for now. The airflow simulation seems to happen regardless of the CFD settings. As you fly you should now see lines around your aircraft.

Line Colors:

Blue = Horizontal airflow (Or deflected air)
Green = Rising air (Thermals)
Red = Falling air (Airflow simulation)

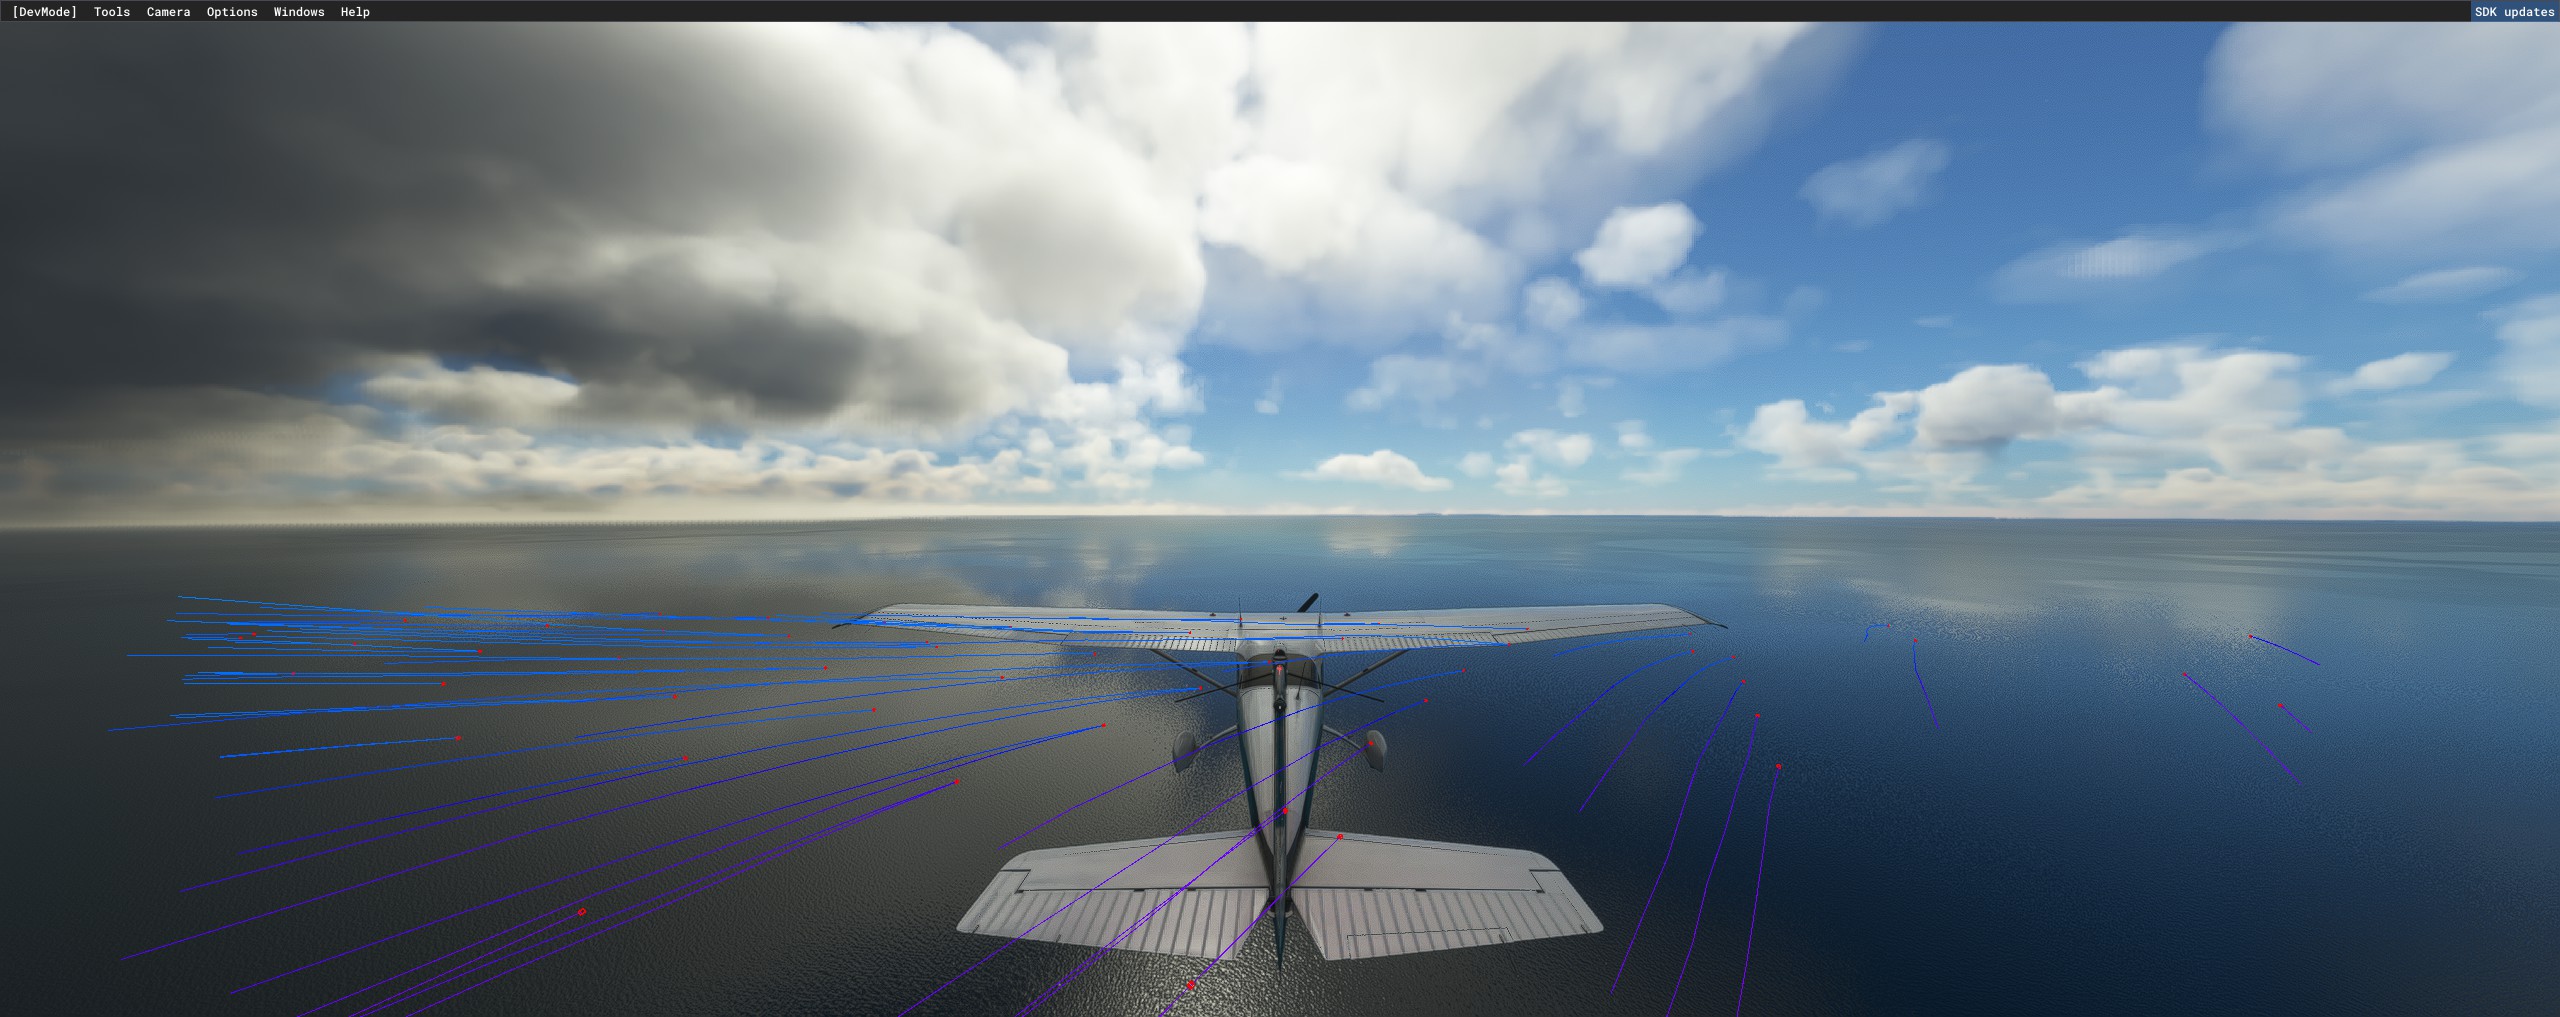
The sim will take the horizontal color and vertical color and blend them together. For instance, air that is moving upward diagonally (from heat) will be a shade of teal, air that is moving horizontally only (or deflected upwards by an object) will be blue, and air that is falling diagonally will be purple. You will notice a red dot\cube at one end of each line, which signifies where the particle started in the CFD simulation, so it will tell you the direction from which the air is moving. The length of the line represents the speed of the wind.
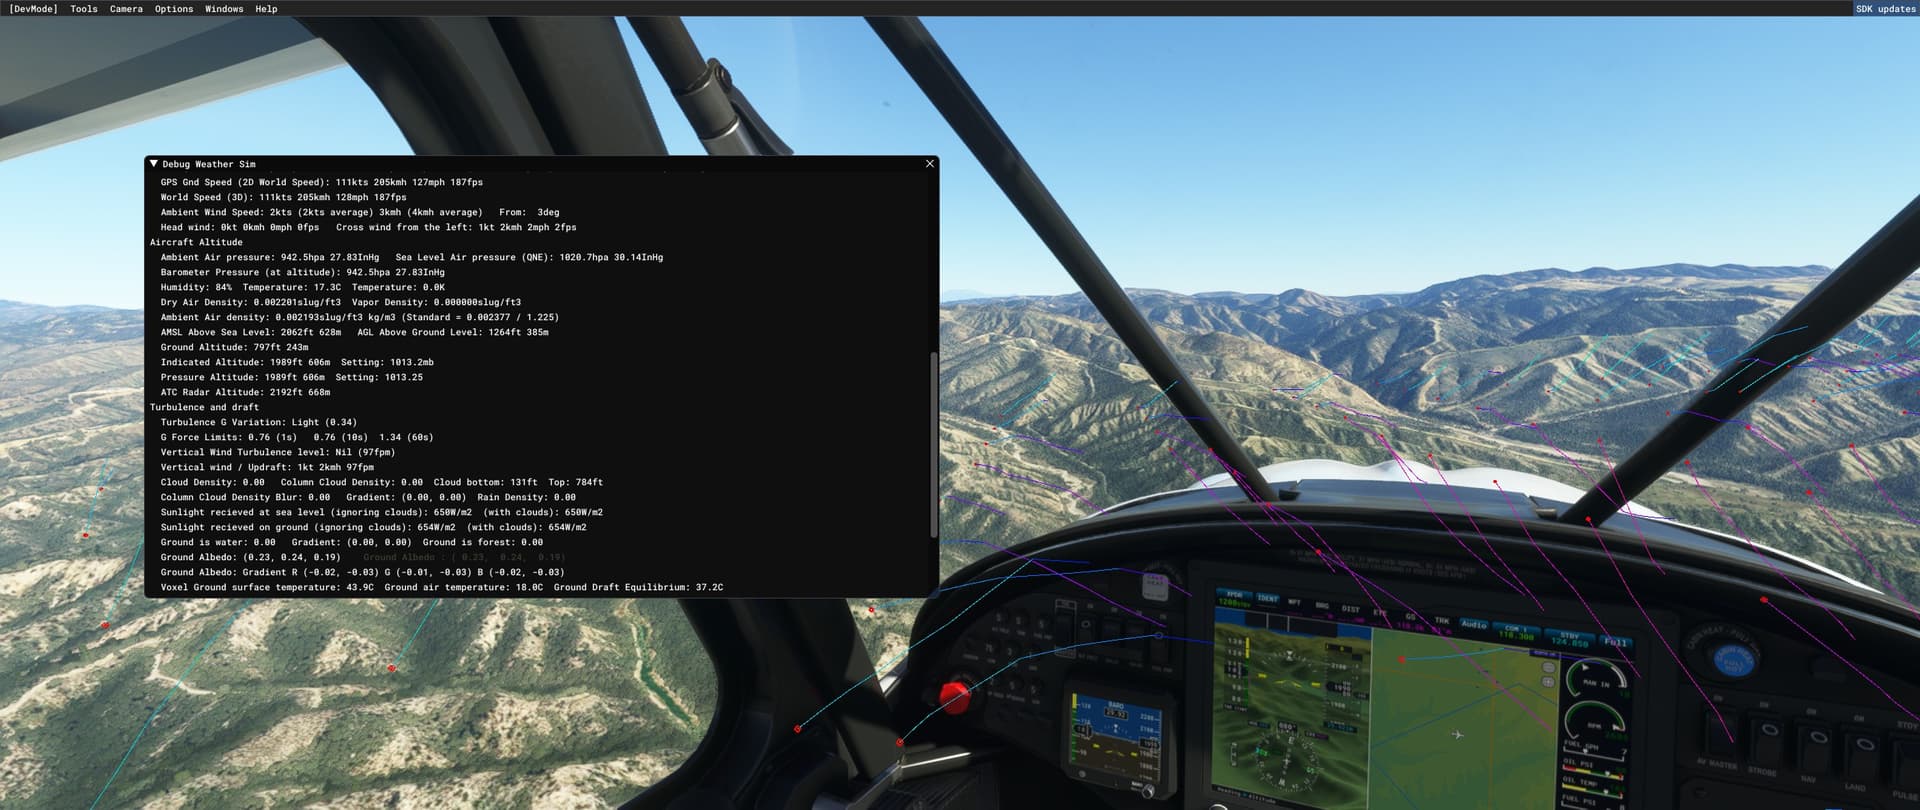
A Simple Test

Within the weather debug window you will see various sections. The one we’re looking for is “Turbulence and draft”. In that section you should see “Vertical Wind”. This value should go up and down as you fly through the lines (columns of rising and falling air). Purple/red air should make the FPM negative, green and teal should make the FPM positive, and blue should make it somewhere around zero. So play around. See how the rising and falling air affects your plane in various circumstances. For instance, when just your left wing is in a column of falling air and your right wing is in a column of rising air, see if that affects your plane appropriately.

Changing the parameters:

The following affects the rising and falling air

  • Position of the sun (Day of year, time of day, location)
  • Temperature
  • Wind speed
  • Clouds
  • Albedo (Colors) of the satellite imagery
  • Trees
  • Water
  • Scenery
  • Trees
  • Terrain slope

The sim calculates the solar radiation in watts (factoring in clouds). It checks the albedo (colors) in the satellite imagery and uses them to determine how much the surface should be heated, which can result in rising air. Rising air is also created directly below clouds. The rising air is an input into the larger atmospheric flow CFD simulation, along with the wind, resulting in air that is moving in various directions, including being puilled downward. Everything in the scene affects the wind in the proximity airflow simulation: Terrain, buildings, trees, etc.

Updraft simulation

The updraft simulation simulates rising air - the results of which are fed into the atmospheric airflow simulation. The updraft simulation particles are created close to the ground based on the solar radiation simulation and clouds. Their velocity is based on the solar radiation simulation and wind speed, and their initial angle is based on the terrain. These particles are affected by the wind, but not the terrain or the scenery (after they are created). They rise on an angle relative to the terrain and are blown by the wind. The higher the wind, the less altitude the particle will gain before dying. Right now (SU11 Beta) there is a minimum wind speed of about 3 knots to get proper thermals.

Atmospheric airflow simulation

The atmospheric airflow simulation covers a large area around your plane and is affected by the DEM, live data, and updraft simulation. The upper-altitude of this simulation is the boundary layer. This simulation is always done a small distance above ground level on a single slice of the atmosphere (a single voxel in height) and does not increase in altitude with your plane. Objects and trees do not affect this simulation. Since this simulation has long-lived particles, it can result in interesting behavior, such as tumbling air (rotor turbulence).

Proximity Airflow Simulation

The proximity airflow simulation covers a much smaller distance and the particles have a lower lifespan, but it updates much more frequently and is affected by just about every object in the scene ( including trees and buildings), as well as live data, at a resolution of about a foot. This simulation is done on a single slice of the atmosphere (one voxel in height) at the altitude of your aircraft. The atmospheric airflow simulation is an input for the proximity airflow simulation until the boundary layer, after which it is just the wind (live data) that affects the proximity airflow simulation.

Updraft simulation → Atmospheric airflow simulation → Proximity airflow simulation → Aircraft

Example Scenarios:

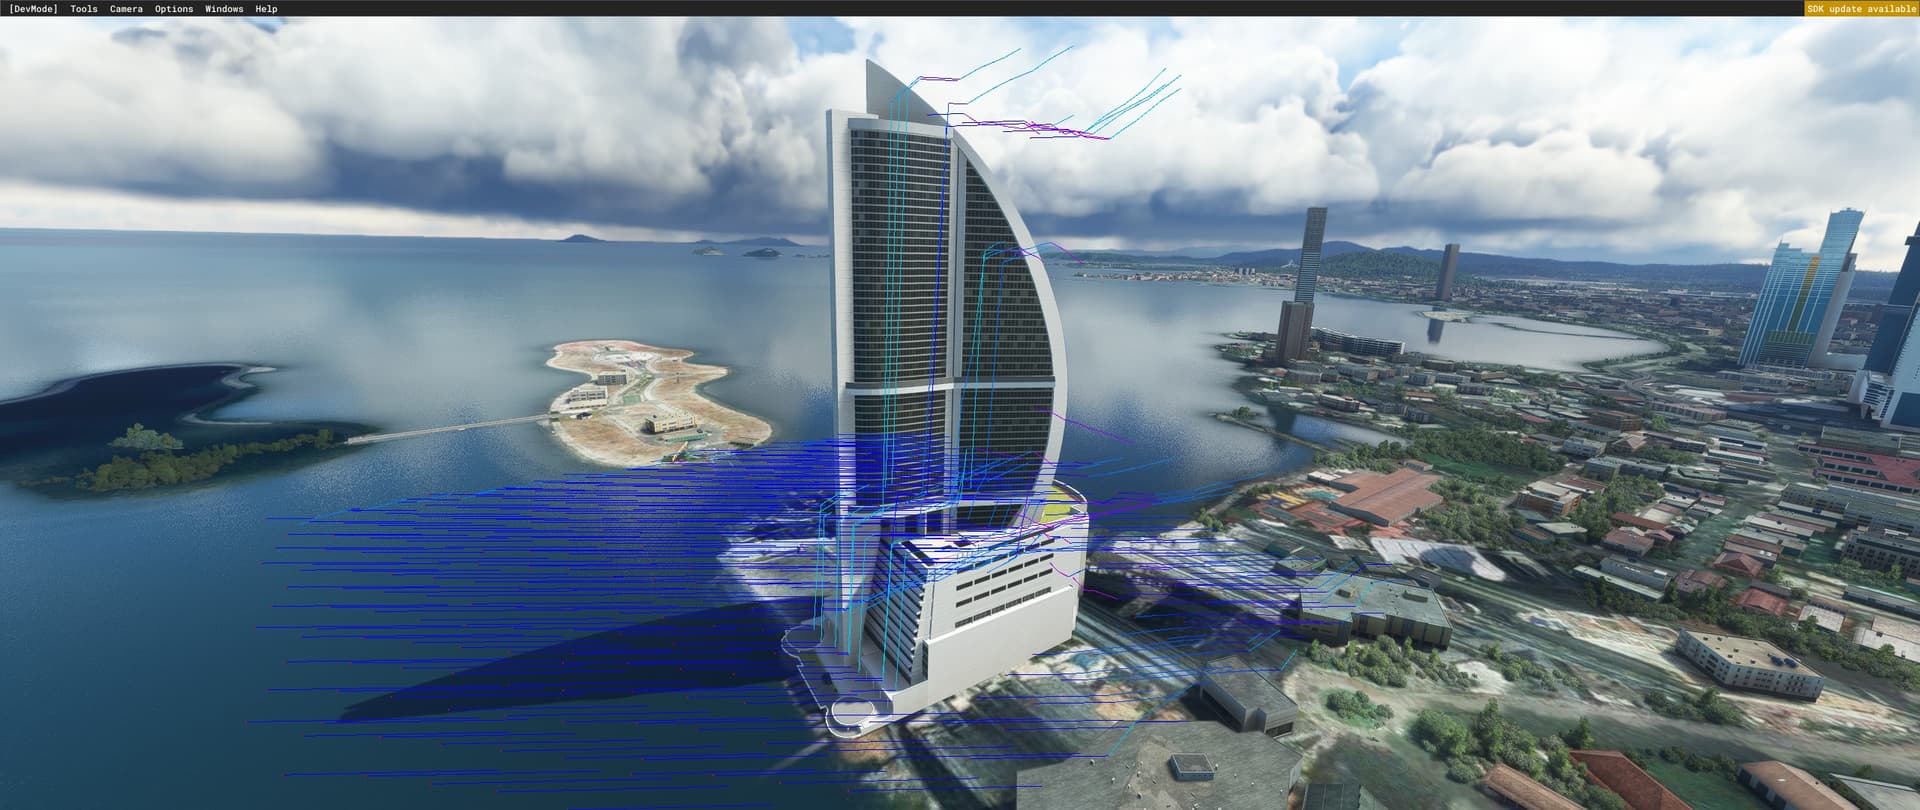
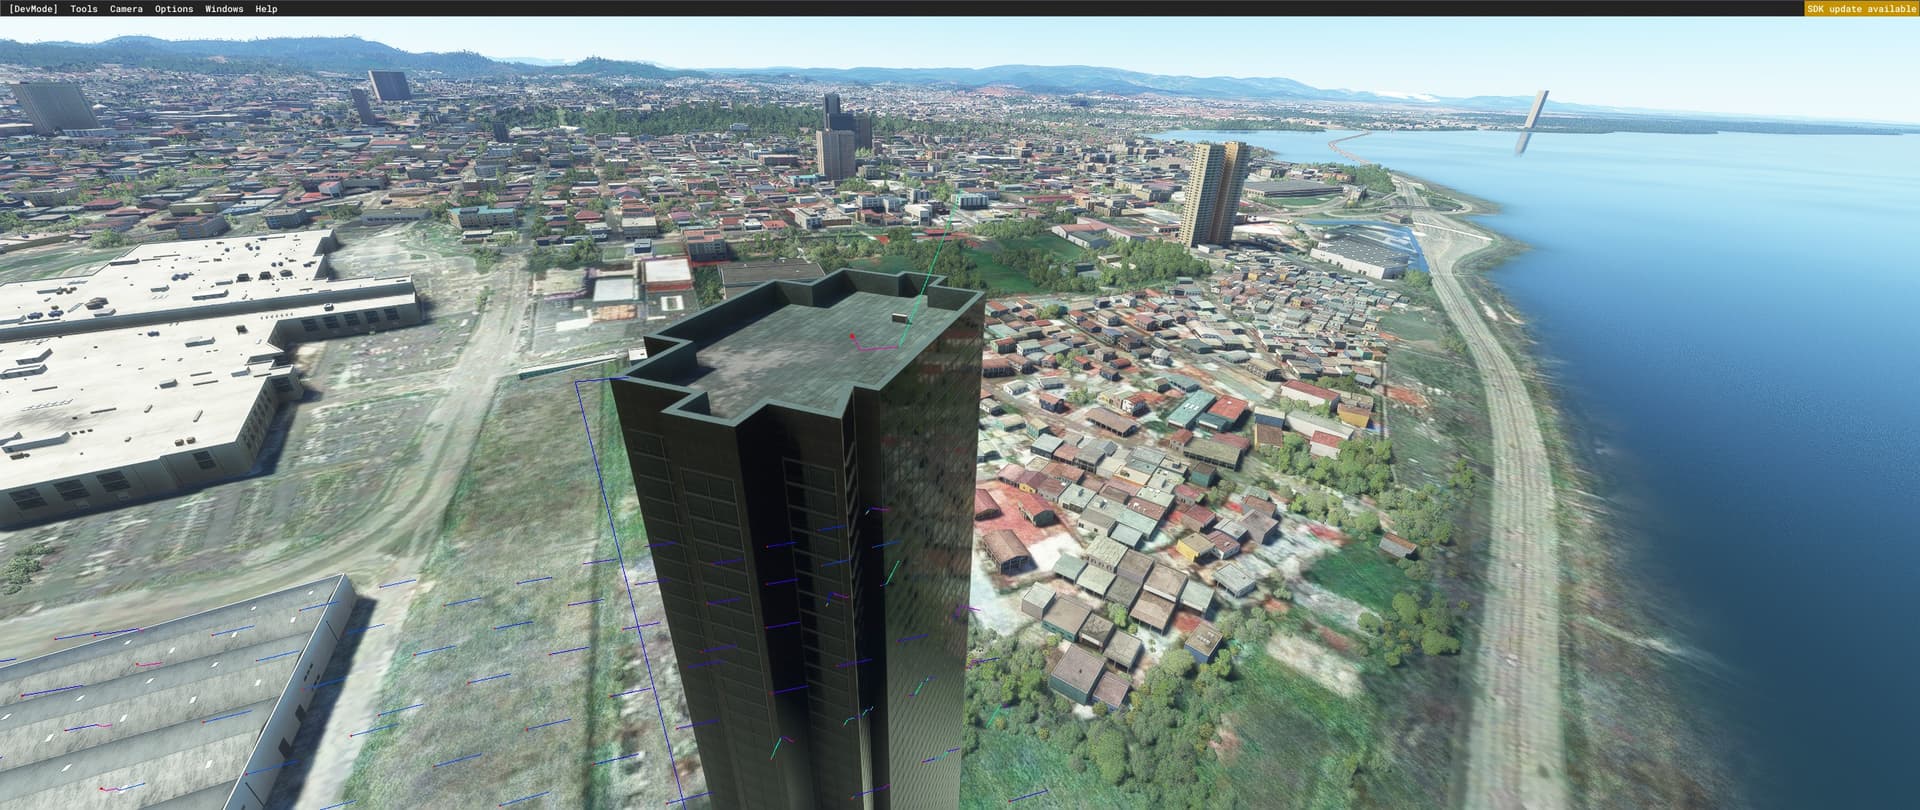
In these screenshots you can see how the wind goes up and down the side of buildings:


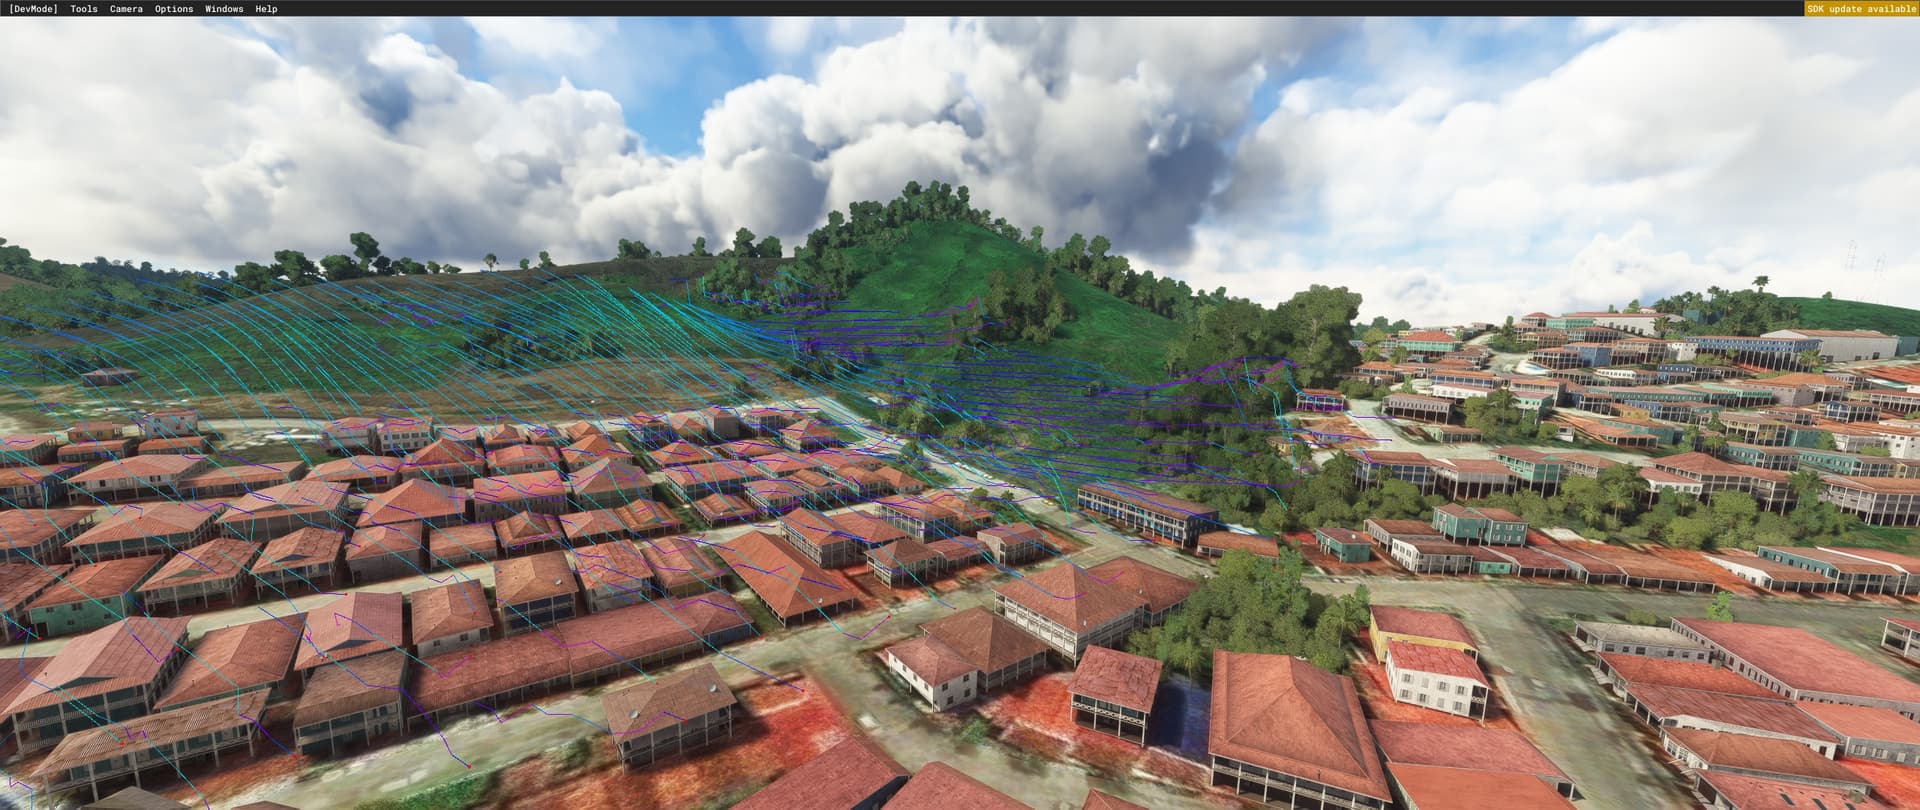
Even small object like trees affects the airflow:


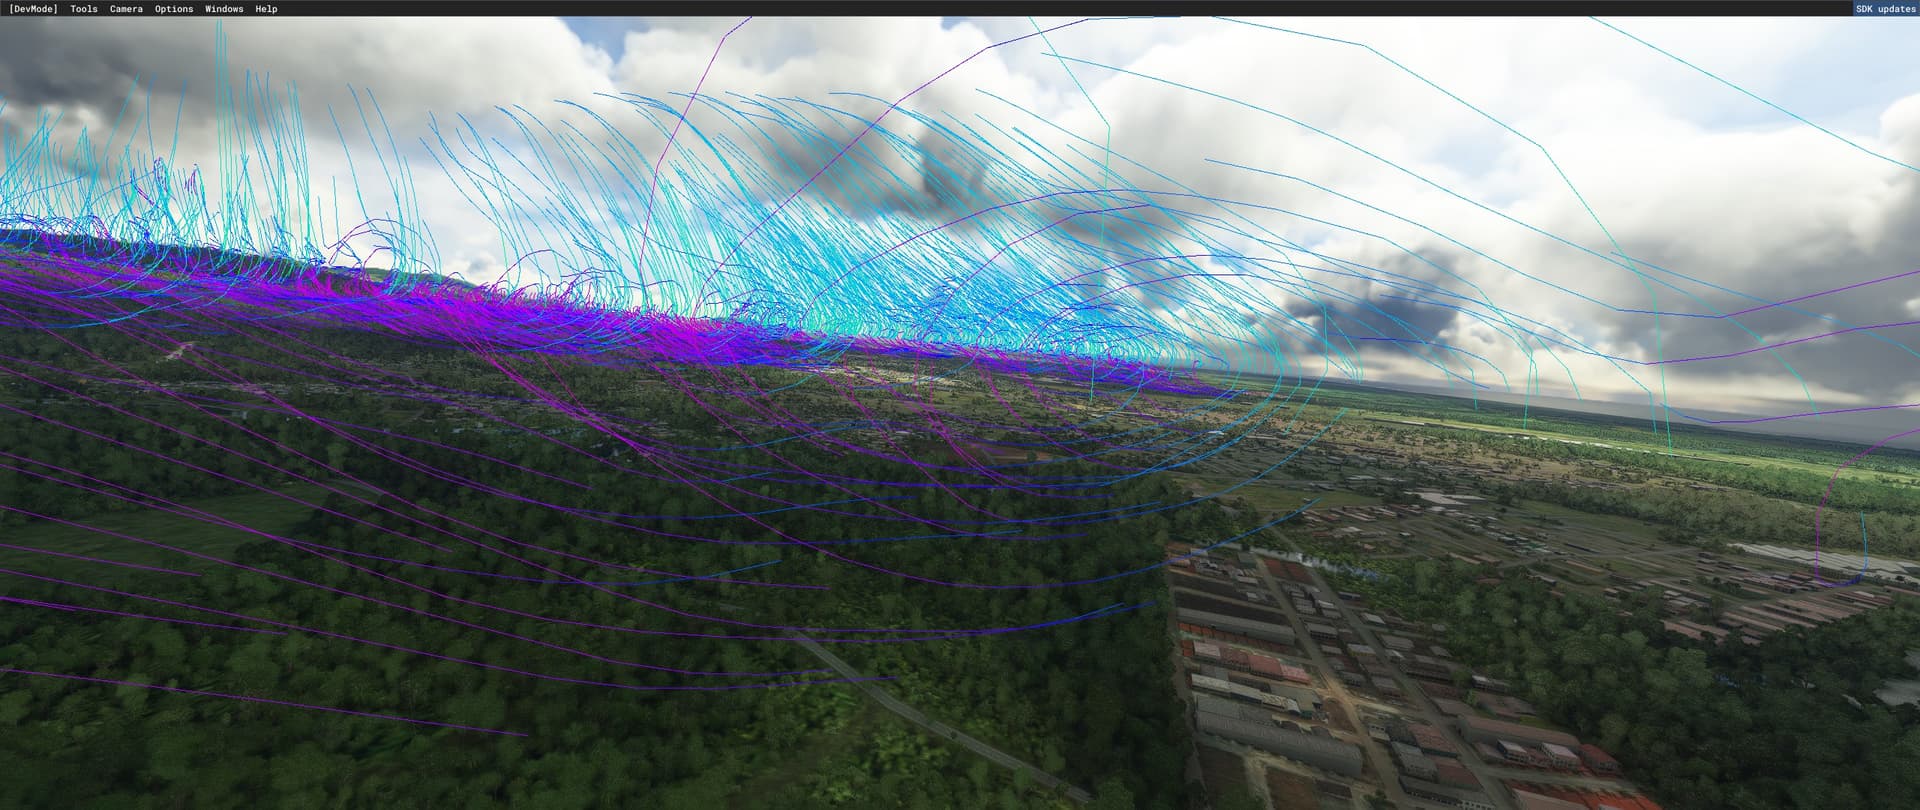
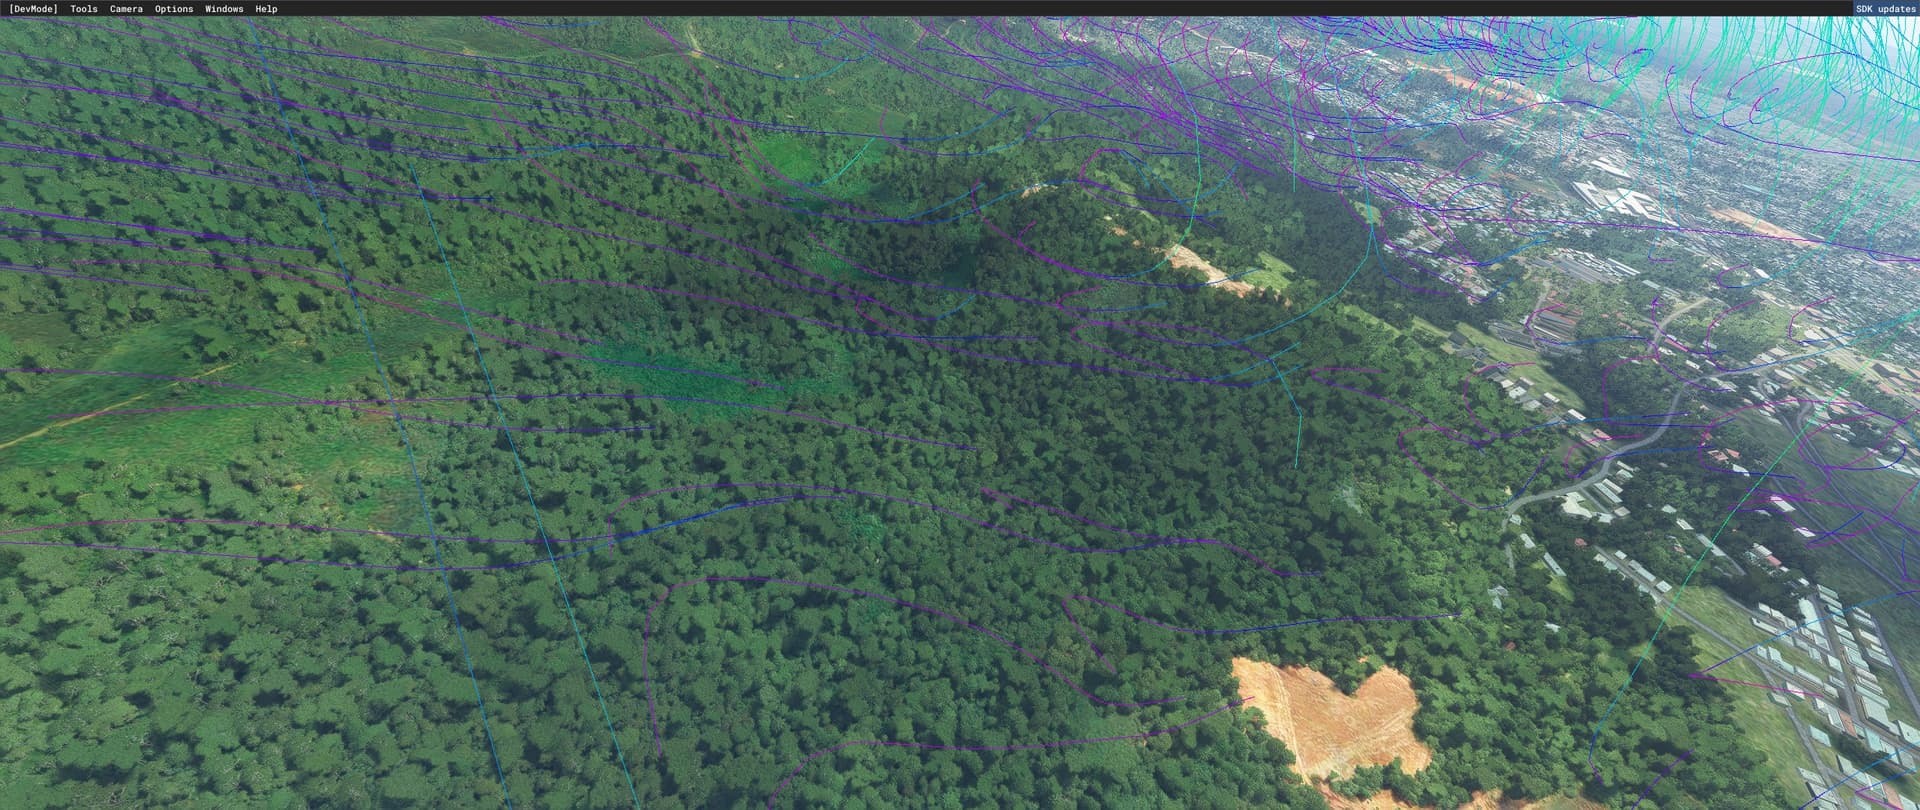
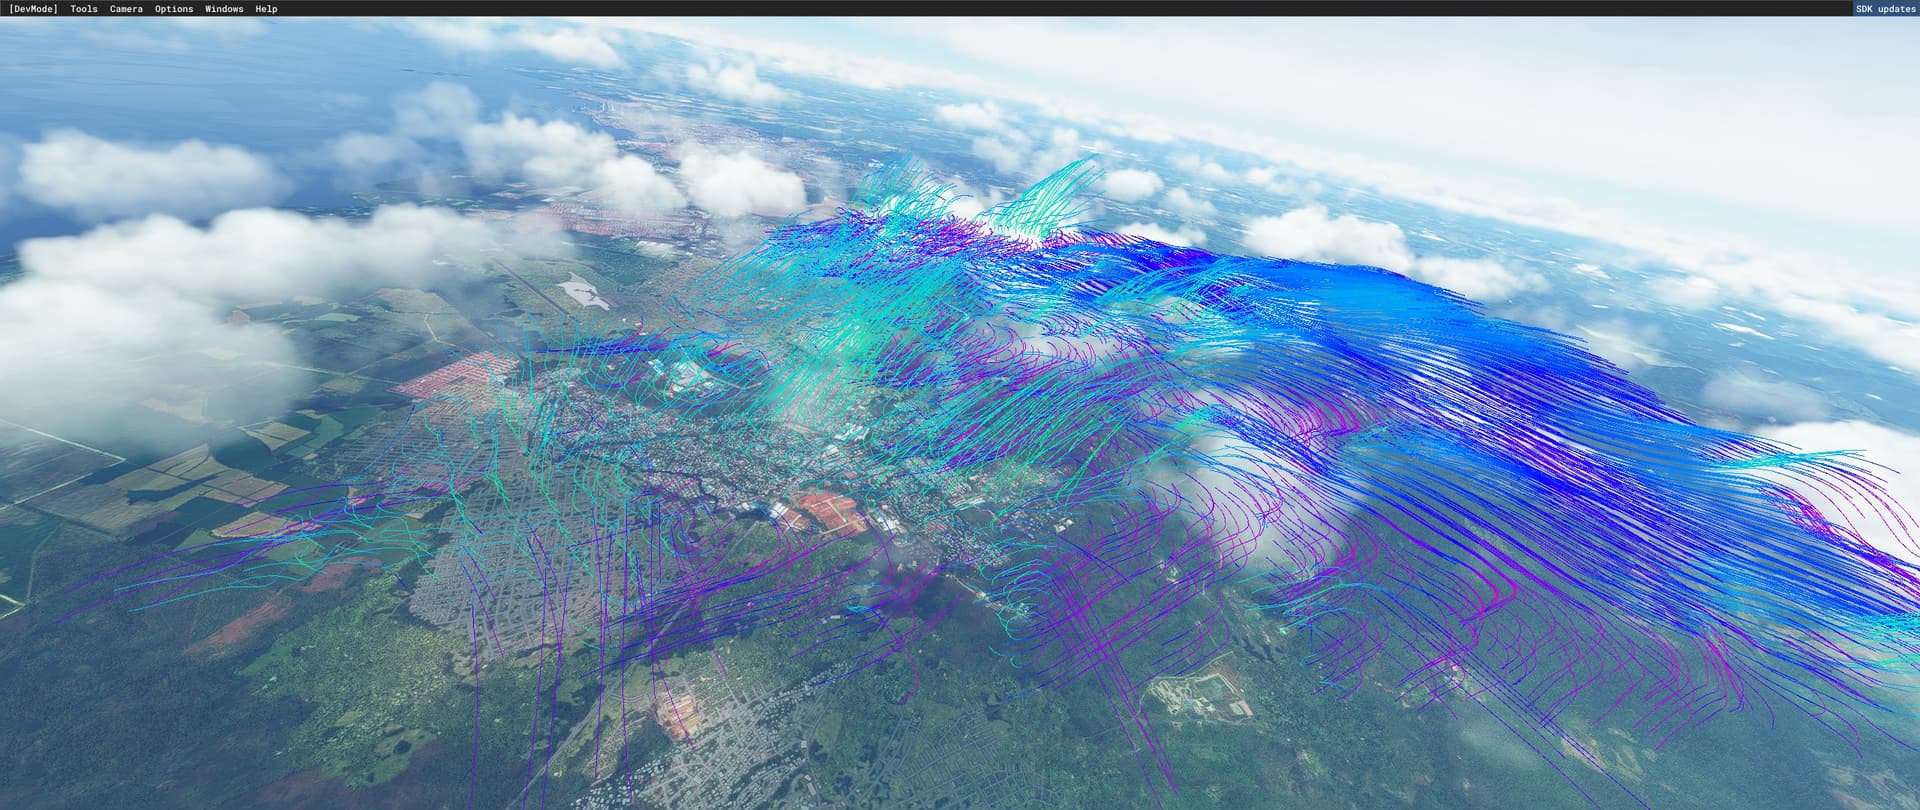
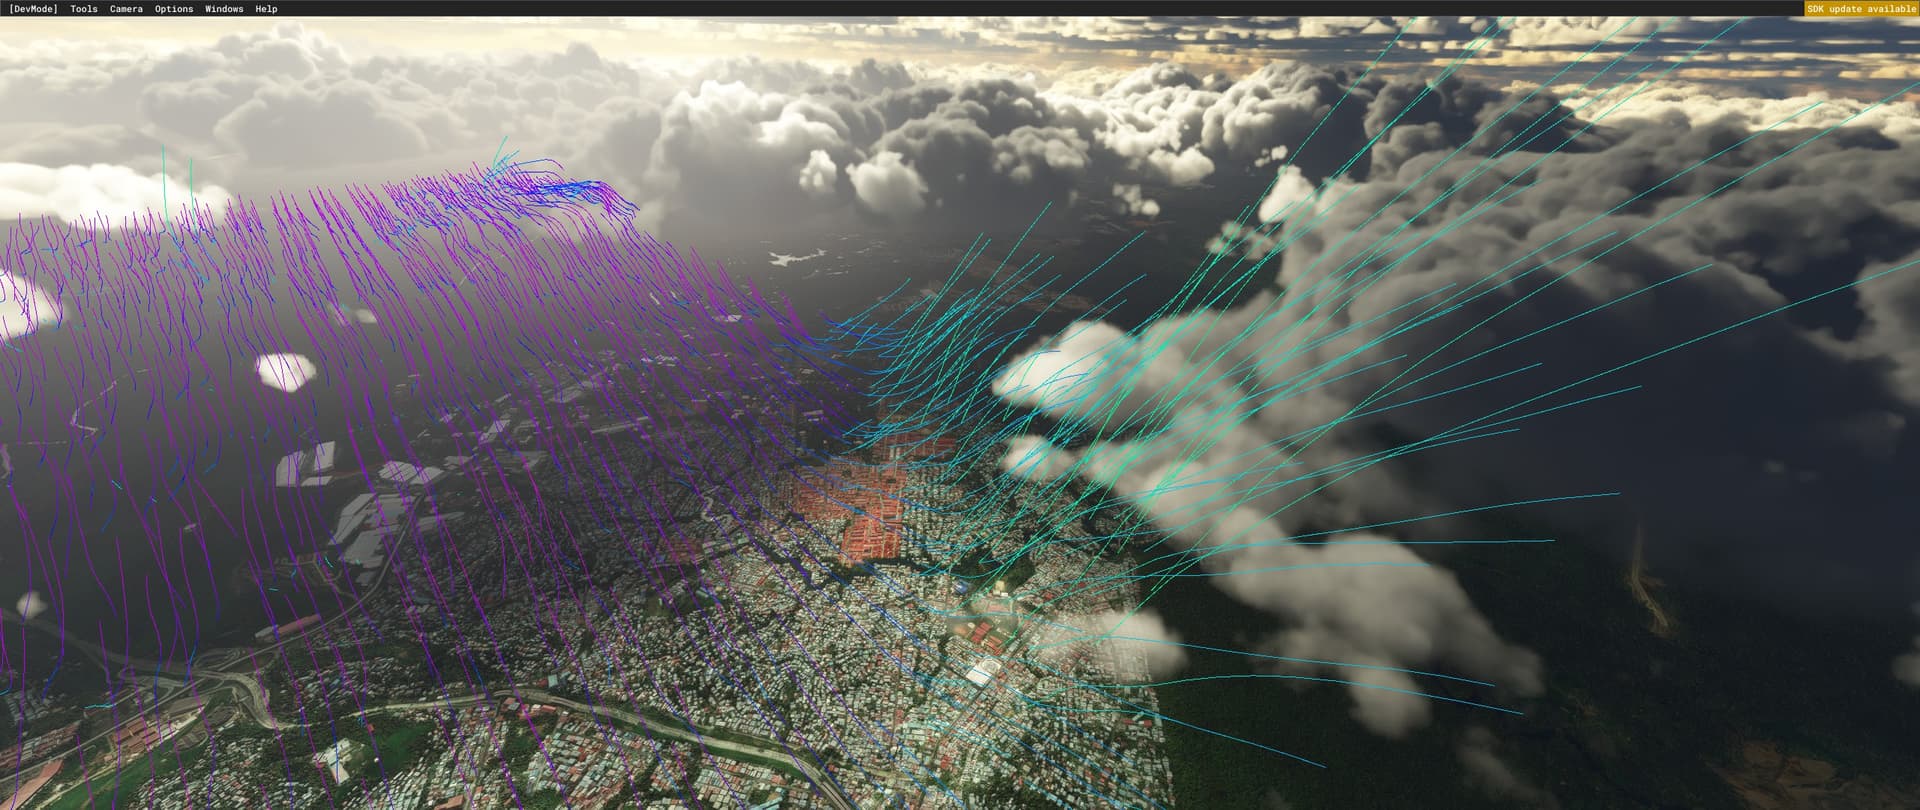
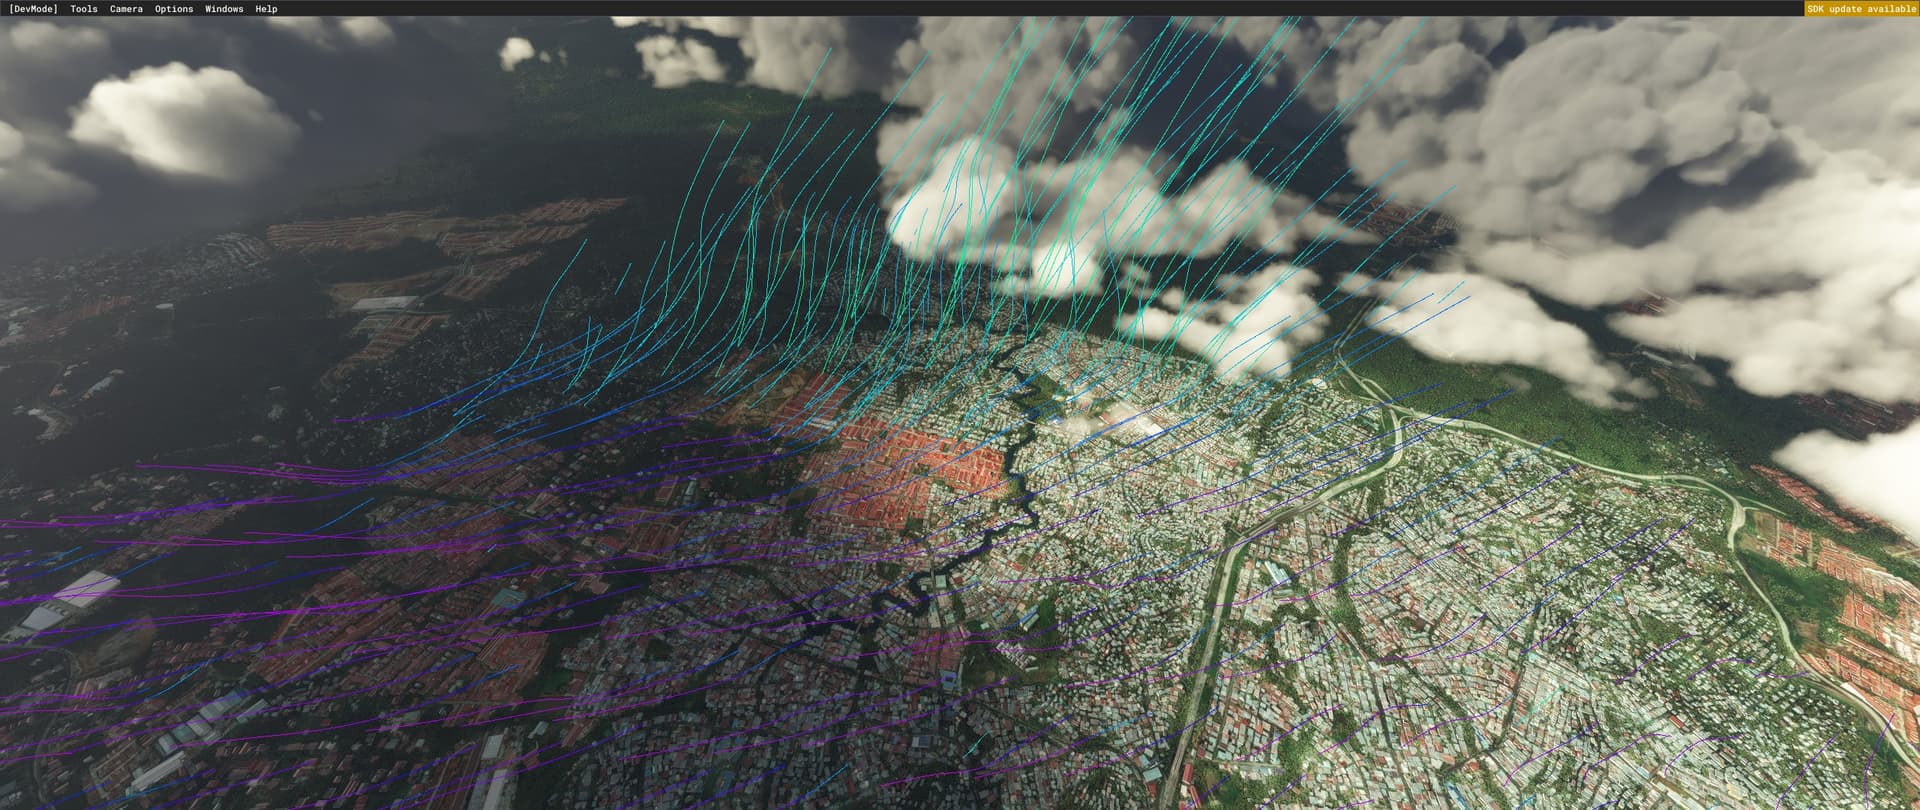
When flying during the summer (or near the equator), you should generally see purple and blue lines over water and open fields, and a combination of teal, green, purple and blue lines over cities. This combination results in thermal turbulence as the air hits the various surfaces of your plane at different speeds and angles. These screenshots are fairly close to the equator - area of the panama canal.


In this screenshot the wind goes up the side of the building, falls a bit to the roof and then is deflected upward by a thermal as a result of the roof being heated by the sun:

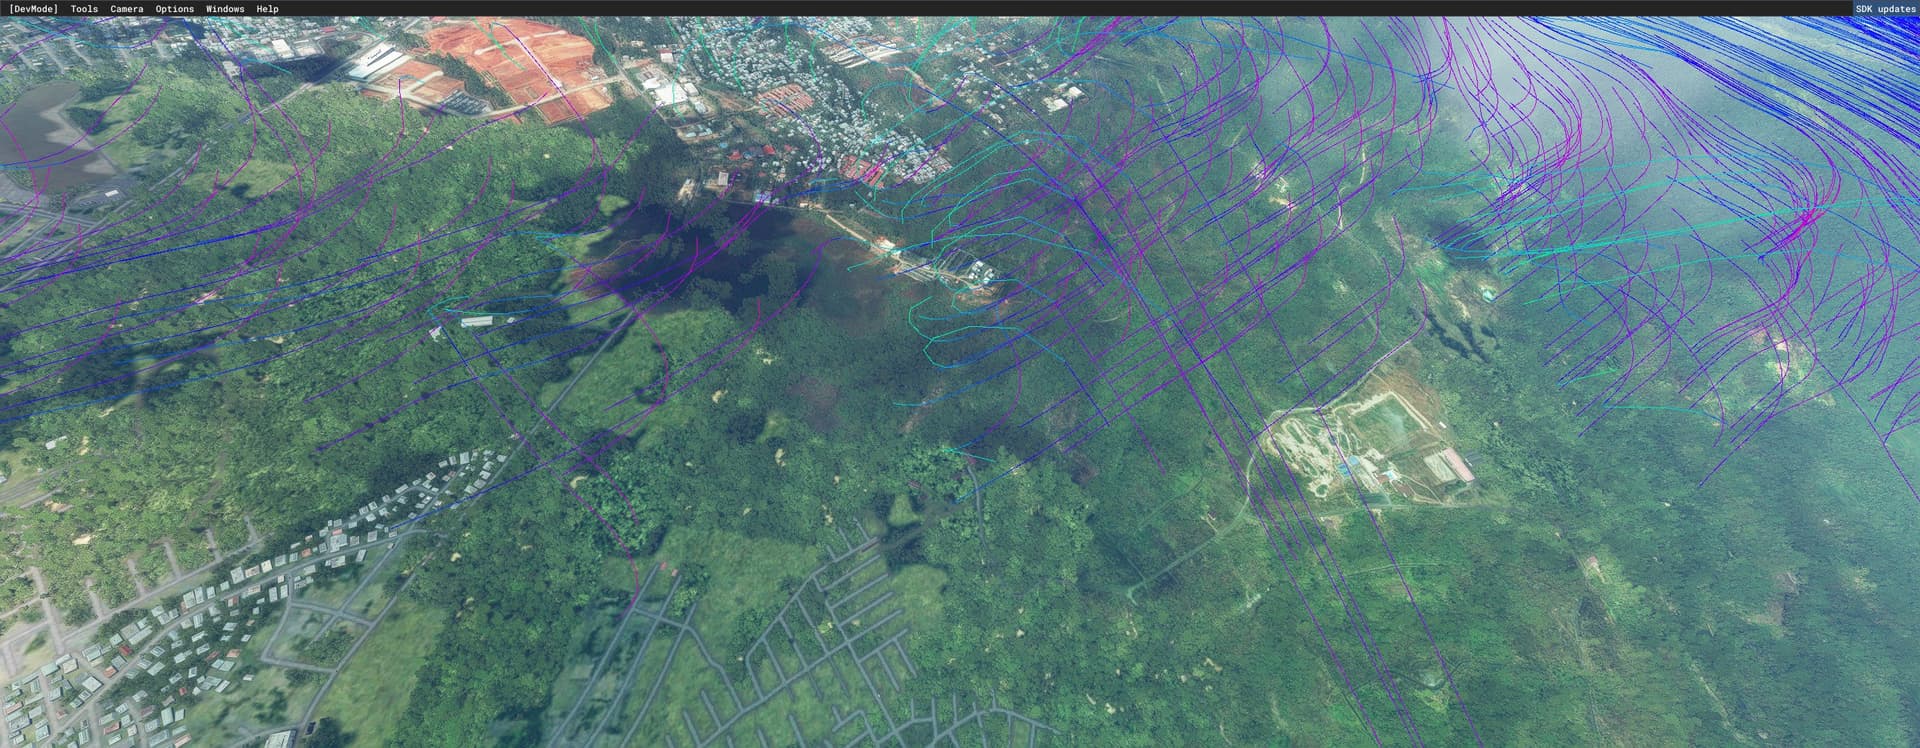
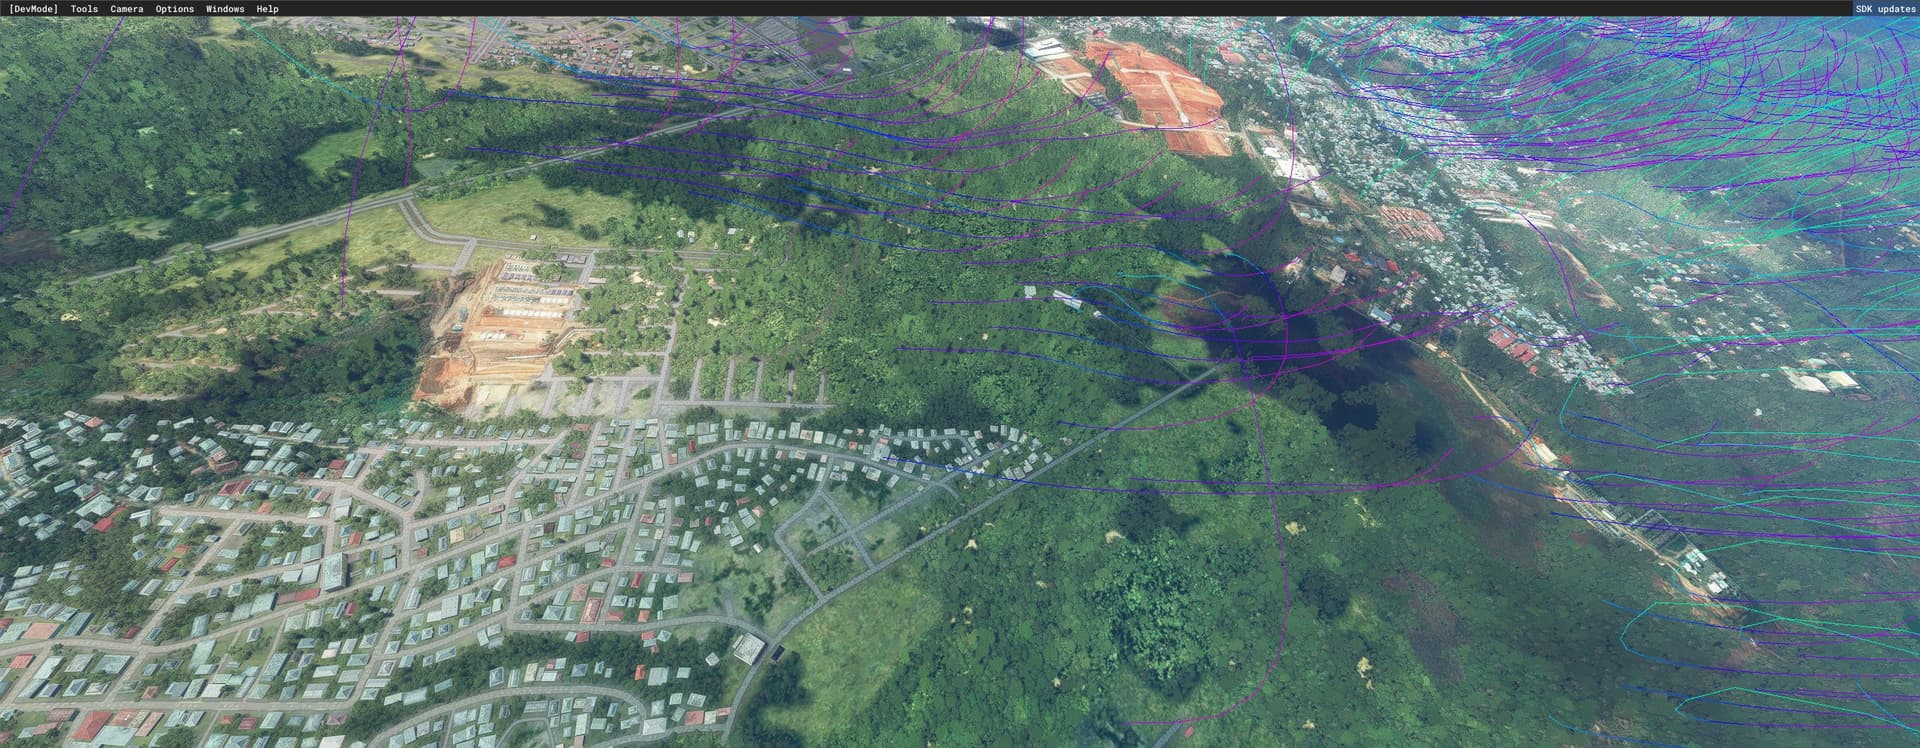
In this screenshot, the wind is choppy over the buildings, goes up and down over the trees, and then smooths out as it goes over a grassy hill:

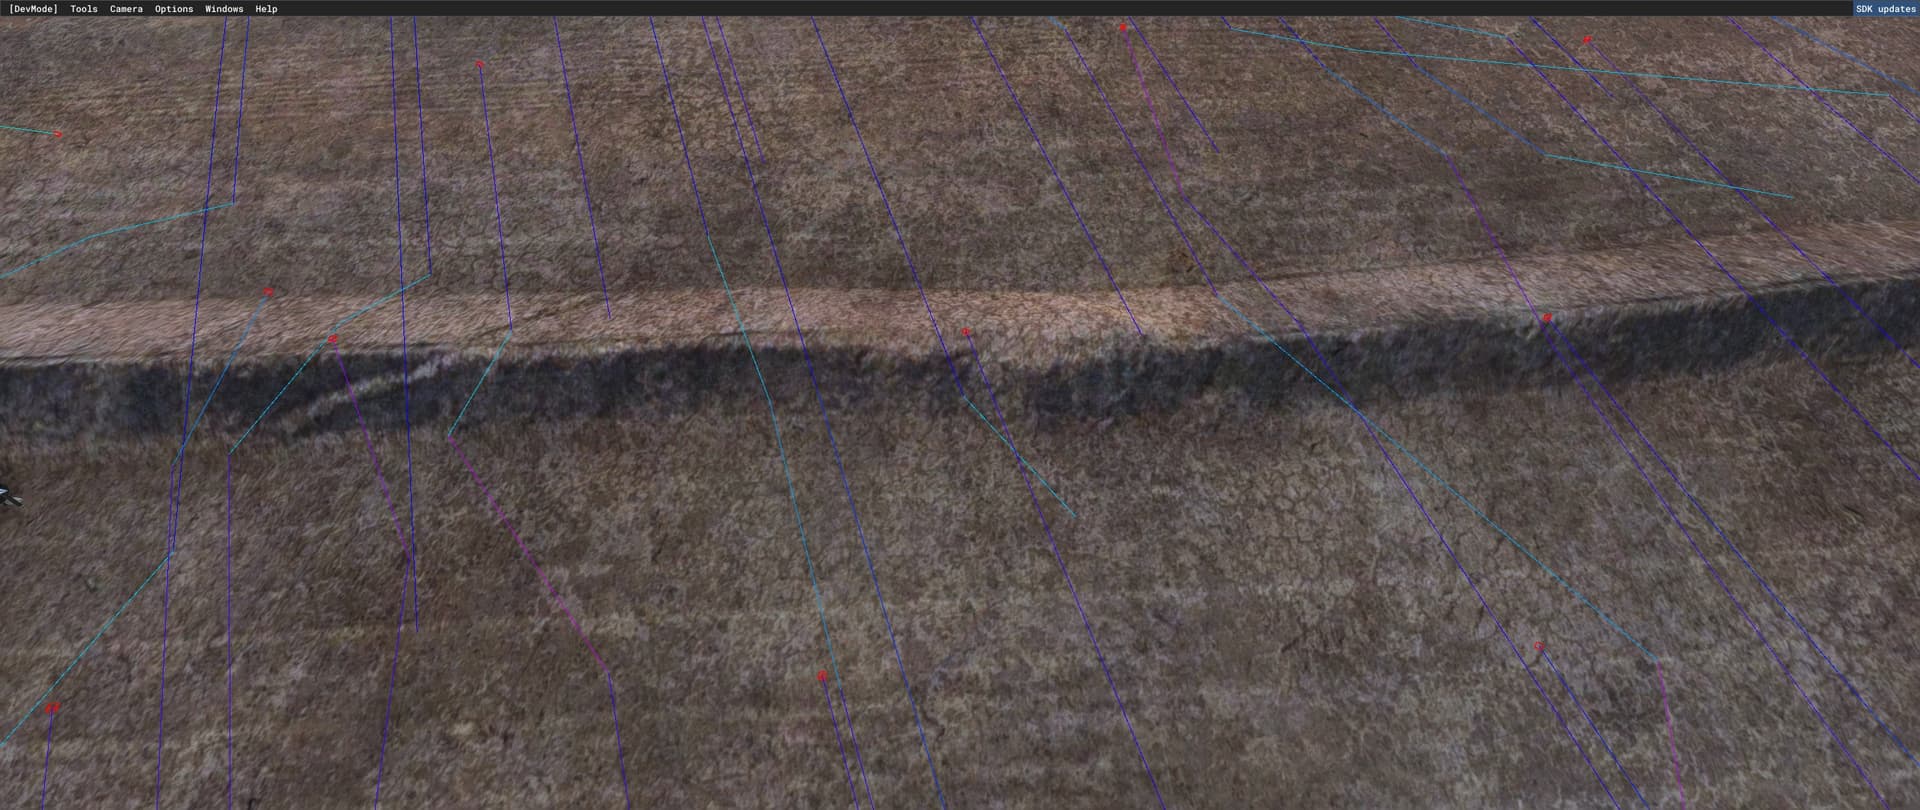
In this scenario (manual weather, exaggerated conditions), you can see an extreme thermal example. The air is being pulled down the side of a large hill that is in shadow towards an area that is being heated by the sun:


Here you can see the wind blowing smoothly across a lake until being deflected up and over a hill. Because of the trees, the air is bumpy as it goes over the hill.

In this screenshot you can see how Wizard Island in Crater Lake affects the airflow, creating turbulent air:

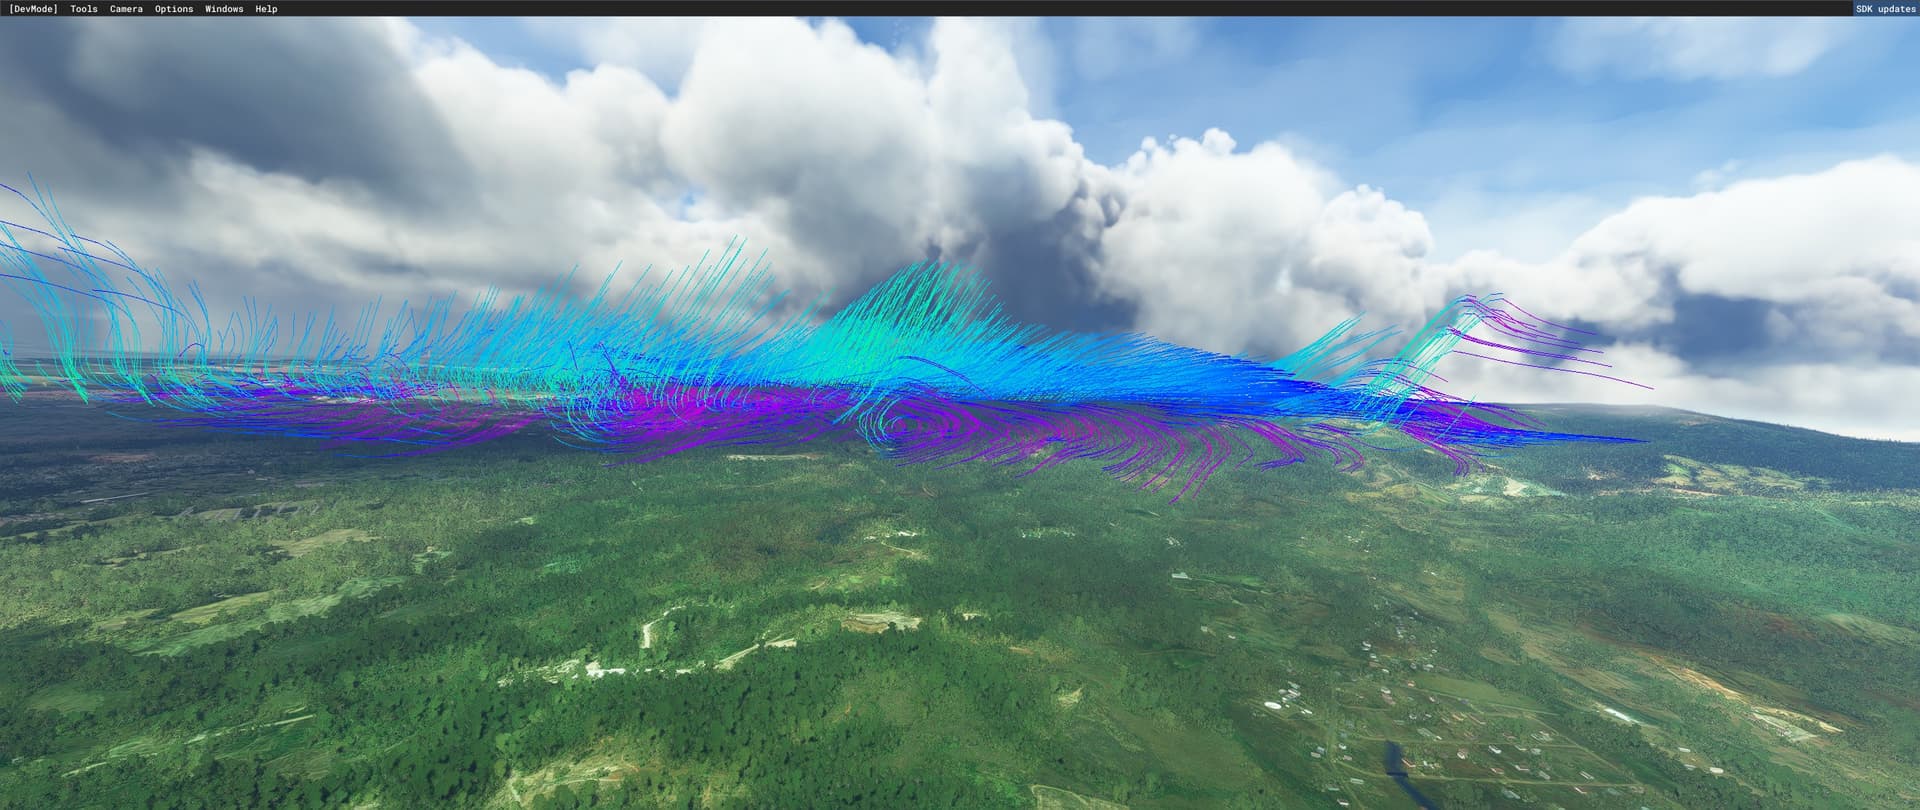
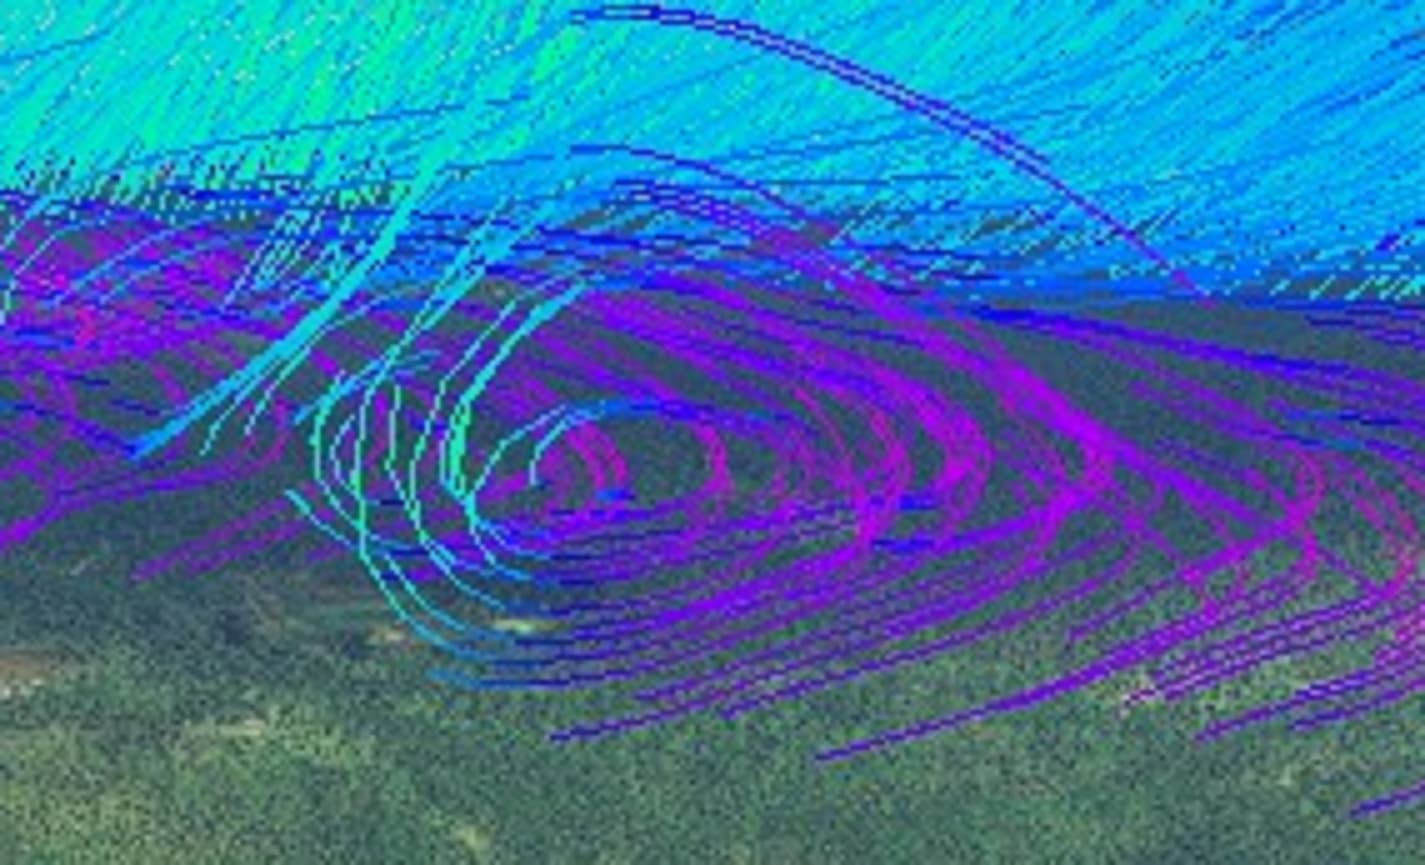
Turbulent tumbling air at the edge of rising air:

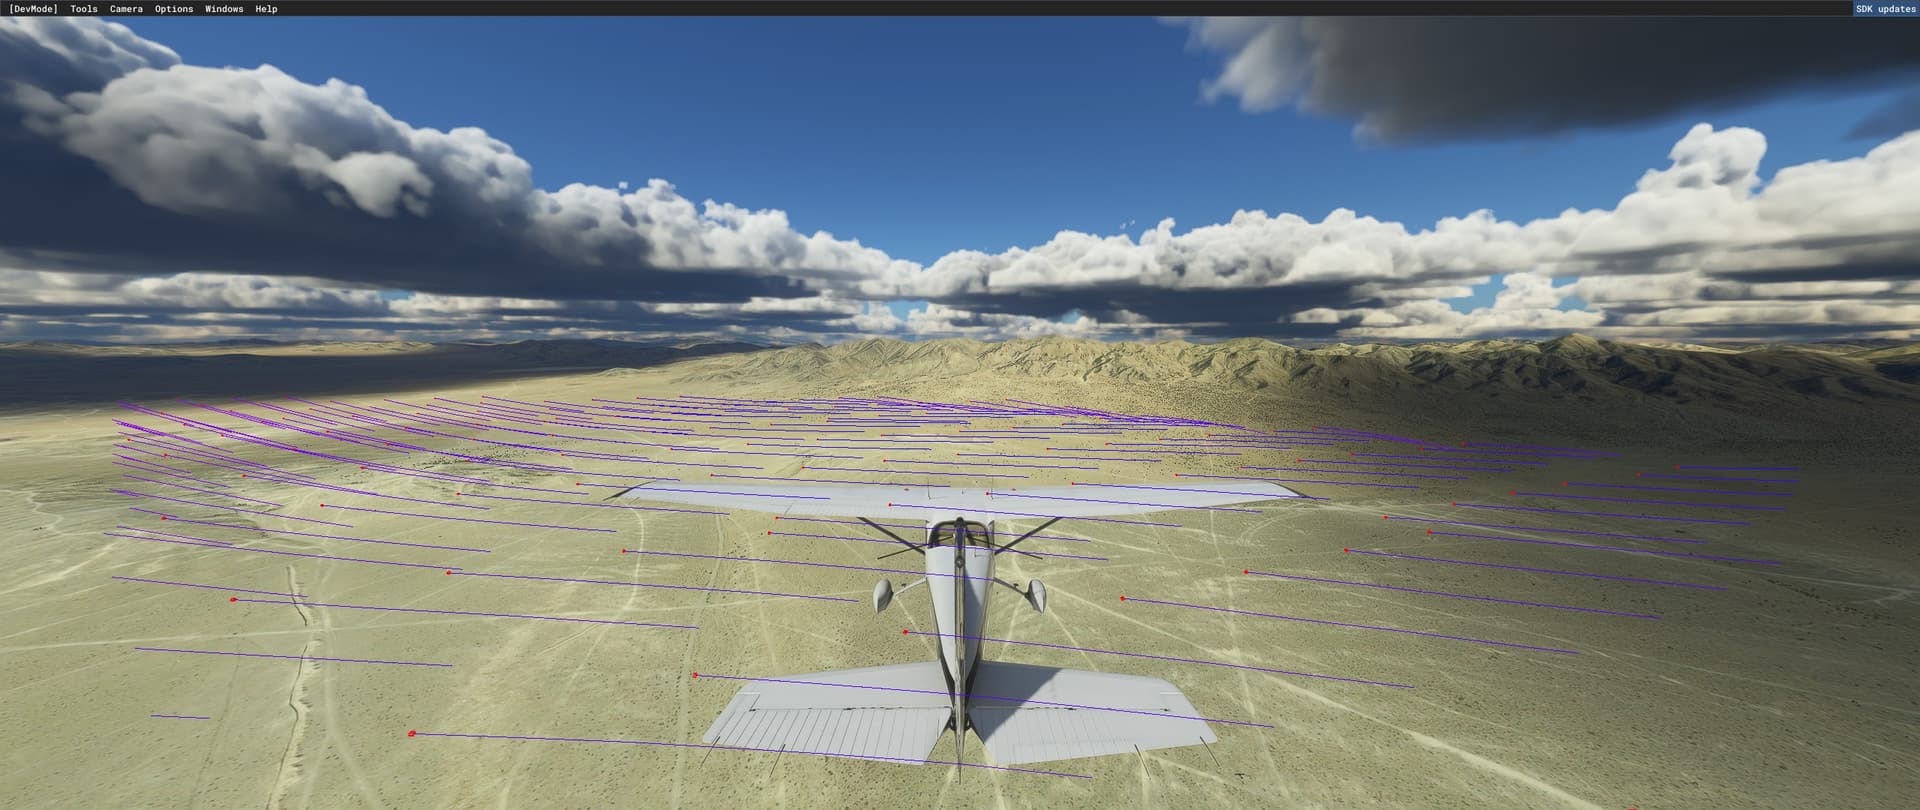
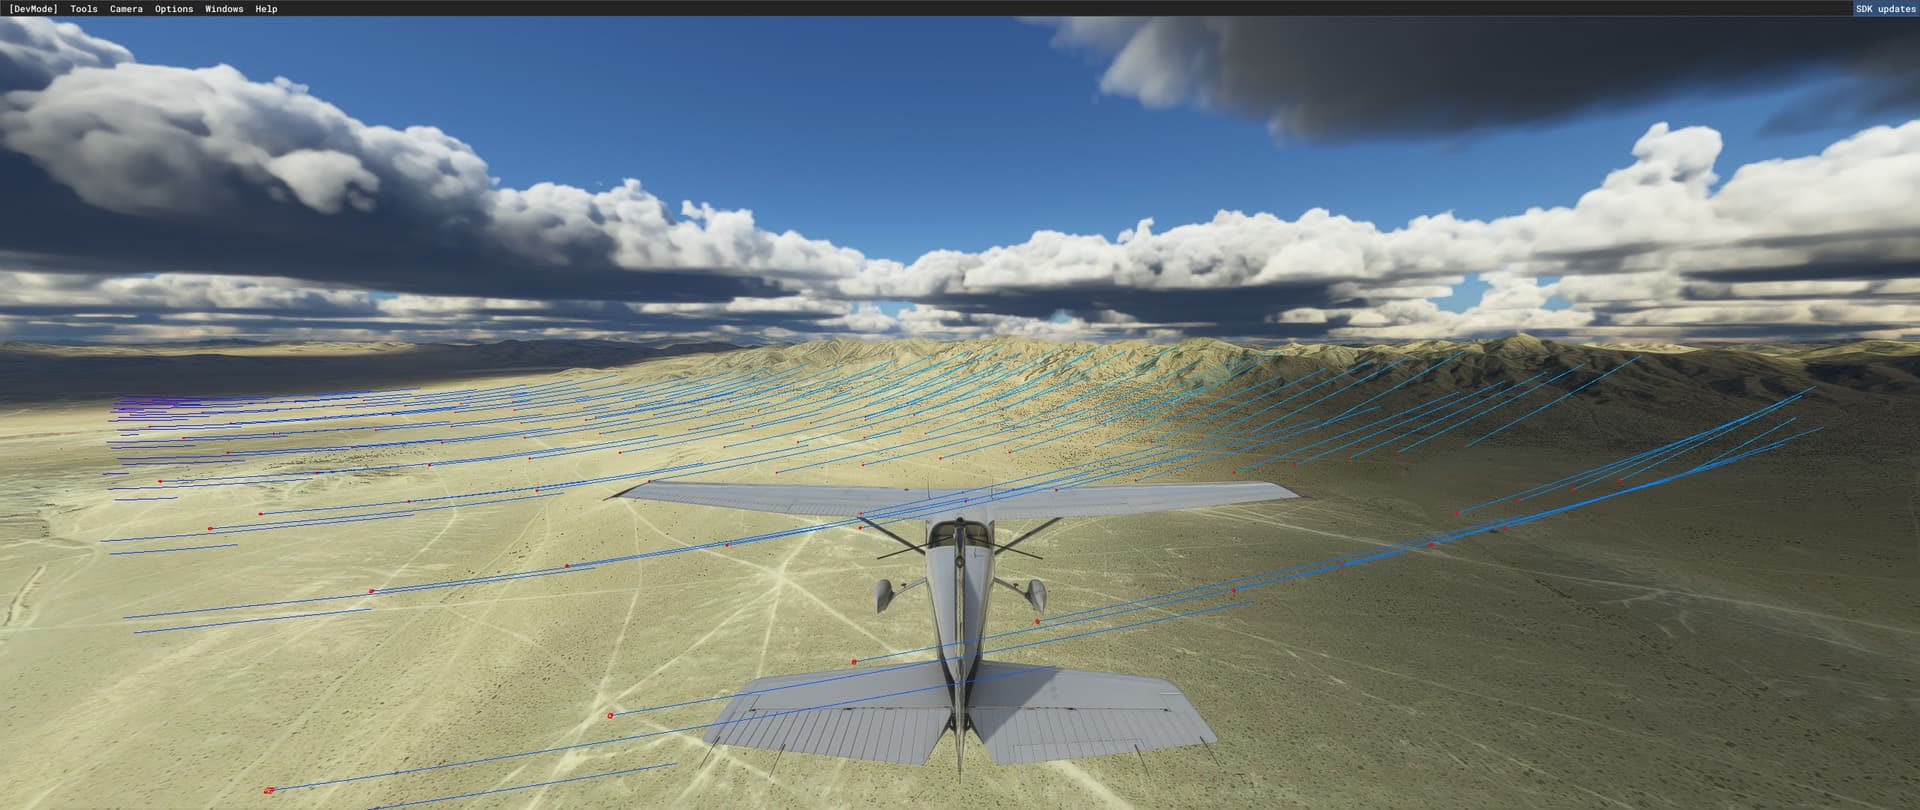
Air tumbling through the mountains:

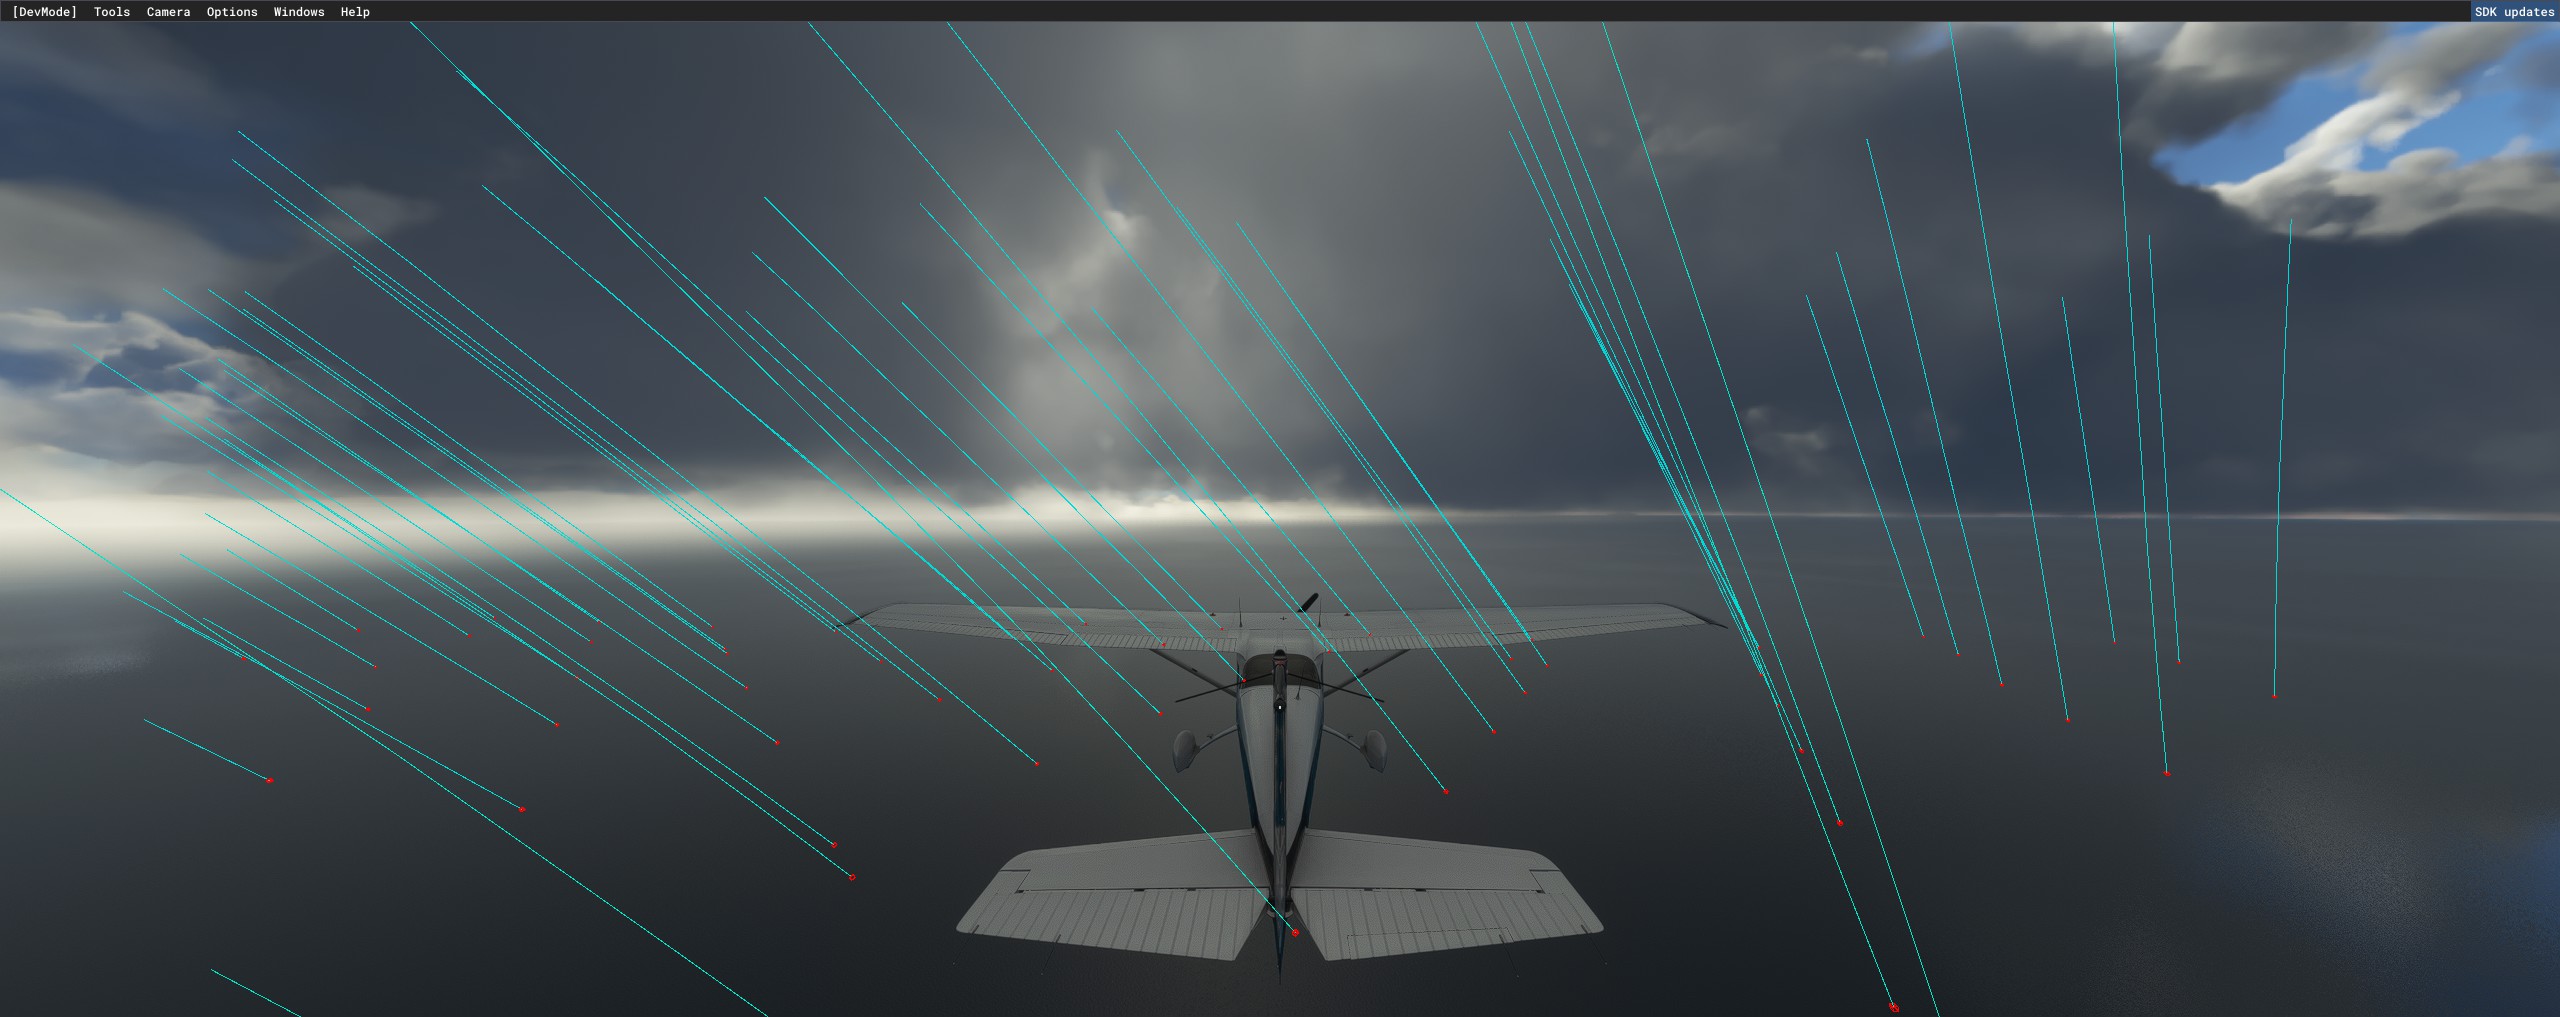
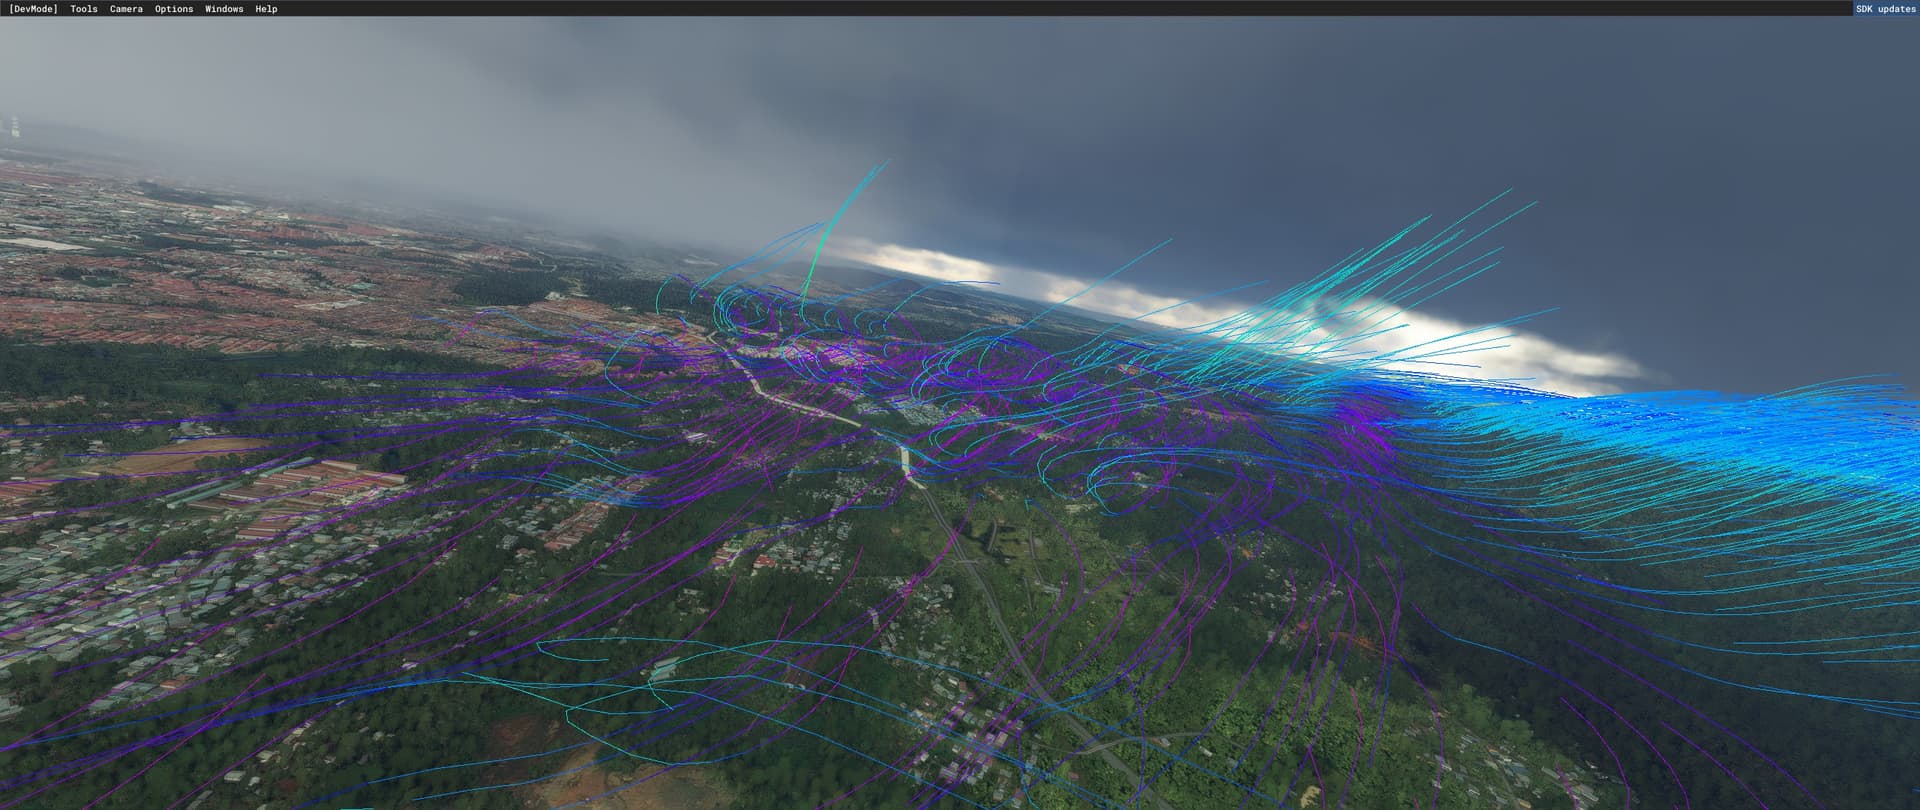
Air rises directly below dense clouds:


To be continued.

1 Like

Fascinating work they’ve done here. I was playing around in a glider yesterday and what Asobo have achieved here is incredible.

Will play around with the dev mode visualisation settings as these seem more informative than the simple visualisation you can enable via the weather toolbar. That only seems to show rising air and you don’t see the full picture.

That being said why do we need to enable the cfd and reinjection? Does that mean that it’s disabled by default?

Regardles I was soaring around and got a nice bit of lift over a town which turned into a deep sink enroute to the next one. Ended up pretty close to the ground before a strong thermal over a car park saved my flight.

Turbulence in general seems less artificial and you can feel your wing dip and rise as you cross the thermal boundaries. It’s really cool.

No clouds though yesterday due to the live weather issues but I’m looking forward to see how they affect the air flows.

7 Likes

My mistake. The wind simulation happens regardless of the settings in that window. I just updated my post to reflect that.

Thank you for the guide!

2 Likes

It looks like Seb was right about the resolution being a foot for the proximity airflow simulation. Even this small sand berm on a beach affects the airflow:

11 Likes

It is crazy to have calculations like this in a $60 entertainment product. :smiley:

16 Likes

This is amazing!

1 Like

See, now I know why I am CPU limited all the time

2 Likes

I was testing the system above water (slew mode) and I noticed something interesting: When no clouds were directly above me the air was moving laterally or falling. When directly below dense clouds, the air rose until it reached the cloud, and then it moved laterally again. The vertical air speed seemed to be based on the cloud density.

No clouds directly above:

Clouds directly above:


More dense cloud (greener, more vertical lines lines)

Less dense clouds (less vertical, more teal lines)

Here’s another test over a desert. The air falls right outside of the cloud shadow and rises inside of the cloud shadow:


This seems to be pretty consistent, which means clouds can be used to find rising air

9 Likes

This has been mentioned already before su11. That was integrated in su9 but now we can see it and they also reduced the limit of up/downdrafts those clouds generate. The thing is many complained it were overdone before su11 but it were actually too less.

those complains made Asobo limit thermals below 3KTS. Thats not how air works.

Where the air moves slower there is often rising air instead.

Good they implemented those visualization-tools. Hope to see less talk about overdone and maybe give more constructive feedback in the future.

4 Likes

Up until SU11 a large number of people on this forum basically denied that the air even rises and falls as a result of the environment and position of the sun. Irrelevant graphs were posted constantly, people kept saying that Asobo just needs to “reduce the frequency of the turbulence effect” etc because there was a general consensus that the turbulence was a simple shake effect applied to your plane. Not many people seemed to think of it in terms of an atmospheric flow simulation based on the environment, and there seemed to be more confusion that anything. Asobo explained the system in pretty good detail in the Q&As, but it had largely fallen on deaf ears. I’m hoping that these visualizations demonstrating in detail how the system works will result in some more meaningful discussions, which I don’t think we’ve really had because of all the confusion surrounding the topic.

13 Likes

I agree. Over at Avsim discussions on weather have a tendency to derail and get very uncivilized. With these visualizations at hand, we should see less of that tendency. Hopefully.

Thanks for this thread. It made me quickly get into the different visualizations.

3 Likes

While testing I noticed that the long distance atmospheric flow simulation can create swirling air. Not sure how accurate it is, but it looks cool in the visualization:


10 Likes

Yes, that is eddy right? Turbulence.

Thats, cool. DIdn’t know they actually simulated turbulence :wink:

To me this system is really complex to be a software for us homesimmers :slight_smile:

I’m really impressed Asobo.

7 Likes

Somebody that figured out what those colours means? What i think. lighblue updraft,dark blue horizontal flow and purple downdraft?

I think dowdrafts from those thermals is missing. Thats why those thermal lines justs cuts off higher up in the air. IRL that line would go up and create turbulence higher up and then travel to colder place and there it would change to downdraft and then move near ground to take the hot air that rises place.

You can see the CPU impact in the Dev Mode box for CFD. At least for me, it was pretty insignificant and measures in the microseconds. I don’t think the CFD calculation density is high enough to make a huge impact, although the vertical resolution of about a foot is rather impressive.

Actually this is why we get cpu-limited

1 Like

The colors are explained in the main post.

Blue = Lateral movement (or deflected)
Green = Rising
Red = Falling

The length of the line represents the speed. The red cube at the end of the line represents the origin of the CFD particle. The colors are blended, so air that is falling on an angle will be purple for instance.

In the first screenshot, the air is being pulled up to the right (teal lines) and the air behind it was tumbling and falling. The airflow CFD particles have a finite lifespan based on the velocity of the particle. As you increase the wind speed you’ll notice that the CFD particles are created further away and travel further.

I think the general idea is the atmospheric flow simulation creates a backdrop for the proximity airflow simulation. The atmospheric flow simulation only creates particles right above ground level, primarily interacts with the DEM and thermals, and does not increase in altitude with your plane, but since it’s such a large distance, it can simulate things that the proximity airflow can’t, such as eddies. The proximity airflow particles is then pushed along by the atmospheric flow simulation particles and checks for more things along the way (at a resolution of 1ft), such as buildings and trees. I think this is what Seb was talking about earlier in the year.

4 Likes

Thank you for explaining :slight_smile:

Have you noticed if all of those flows are affecting the plane? I’ve tested and it feels
like the aircraft not react to all of this. For example in really convective clouds i can see really strong updrafts but the aircraft is not affected by those.

I believe only the proximity airflow CFD directly affects your plane, and the affect of the larger atmospheric flow simulation on the proximity airflow CFD seems to fade with altitude.

Atmospheric flow CFD → Proximity airflow CFD - > Aircraft CFD

Did you have the proximity airflow visualization enabled or the atmospheric flow simulation enabled? Unfortunately, I have not seen evidence of CB turbulence and I’ve tested it quite a bit. I thought I did a few times, but it ended up being low clouds being affected by the atmospheric flow CFD. It seems that the impact of the atmospheric flow simulation CFD on the proximity airflow CFD fades out with altitude. So near the ground the atmospheric flow simulation particles have a large effect on the proximity airflow particles, but when you reach a certain altitude, the proximity airflow particles do their own thing and seems to be primarily based on the wind. So you may not see the atmospheric flow simulation particles get to the altitude necessary for them to level off, but that can be reflected in the proximity airflow simulation. It would also be the proximity airflow simulation that would simulate CB turbulence.

4 Likes