Rather than just glancing at FPS displayed on my monitor screen or in a graph over flight time, I wanted to be able to do statistical analysis and compare mean and median FPS vs. various graphical settings and see how my GPU and CPUs were doing, including the temps inside the machine.
I found that the .HML log file that can be generated by MSI is essentially a .CSV file (comma separated values) and with no modifications can be opened directly in Microsoft Excel. What I do is after a flight just rename the extension from .hml to .csv. That effectively deletes the current HML file as far as Afterburner is concerned and allows me to easily generate a new one for the next flight. (sorry if the .CSV nature of the .HML file is already well known - I’m a newbie to gaming at age 74). Immediately after opening and freezing the panes around one cell, I save the log data as an .XLSX file, which preserves any formulas or formatting inserted into the spreadsheet and also compresses the file size by a factor of 4 or 5.
The thing that I’ve found introduces the most variability into my average FPS is my exact flight path. If there is a way to completely automate flight on autopilot from takeoff to landing and essentially fly the exact same flight plan second by second in MSFS, thanks for letting me know. That would really make the comparative analysis more meaningful.
Perhaps after some more testing (especially if a highly reproducible automated flight plan is possible) I’ll provide some quantitative comparative results. I have a pretty decent machine: Dell XPS 8930 SE, i9-9900K, 32 Gb 2666 MHz RAM, RTX 2070S 8 Gb VRAM, 1 Tb non-system Samsung EVO 970 Plus in Gen 3.0 x4 PCIe slot, 2560x1440 monitor via DP. My settings tested have mostly been the first and second set of settings recommended by Spazzy: #1 Optimal settings for Flight Simulator - Nvidia and #2 Optimal settings for Flight Simulator - Nvidia - #73 by Spazzy.
I have been flying out of KJFK to and around Manhattan, mostly heading WSW towards Staten Island, then flying up the Hudson River. I’ve been mostly using cockpit view with around a half dozen brief external views on each flight just to be consistent (since I started out that way).
I haven’t found much difference in average FPS whether using a Boeing 747-8 or the TBM 930. Both give around 25 fps average. I’ve done the FPS determination with no manual cache and my rolling cache cleared before each flight and also with a high detail manual cache (45 Gb) ~25 mi west of JFK and ~10 mi high, never clearing the rolling cache. Both manual cache and rolling cache are on the same Samsung NVMe SSD as MSFS itself and the max allowed size of each is 100 Gb. The only thing that I’ve noticed makes much of a difference in FPS output is flight altitude. I’ve been flying several thousand feet high to as little as a few hundred feet above up Hudson River going up the west side of Manhattan. I’ve changed between sim graphics settings #1 and #2 above, between program preference vs. background service in Windows, and between Dell balanced power vs. high performance settings, and between Game Mode on vs. off, as well as between the two plane choices.
My pet theory right now, that really needs a very reproducible flight plan to vindicate, is that the level of detail requested by my graphics settings, no matter what aircraft, is what’s bogging down the FPS, given the high complex detail with lighting amongst the buildings of Manhattan. Both my GPU and the main single cpu core thread in use are both averaging about 80% processing usage. I’m averaging about 28,000 Mb of RAM usage and almost full VRAM usage (~7800 Mb out of 8192).
Thanks if anyone knows how to file and execute an exact flight plan from takeoff to landing with a highly reproducible course and altitudes.
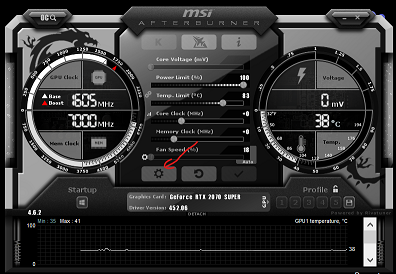
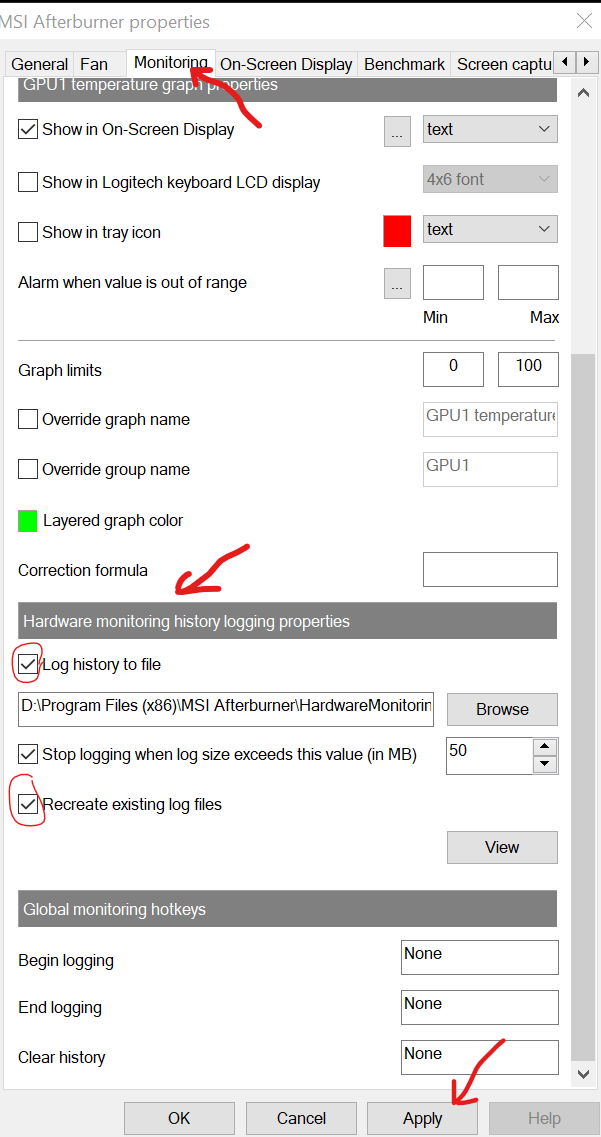
Once you start logging data in MSI Afterburner, it will keep going continuously until you shut it off. So I only turn it on just before takeoff with the throttle(s) powered up before releasing the brakes. The first picture below shows the Advanced button to the left of center on the MSI applet. Then on the monitoring tab after scrolling down there is the Log History checkbox and Recreate Existing Log Files. I check those two boxes just before taking off and click Apply down at the bottom, close out the Advanced floating dialog, and minimize the MSI applet, then release brakes and takeoff. I never land. I just hit Esc to terminate the flight, confirm, and then immediately launch Afterburner to uncheck Log History and apply the change.
I fly my route for more than 8 minutes and usually generate more than 500 data points, one for each second. I copy and paste formulas from one spreadsheet to the next. Works great. Now if there were a way to graph GPS coordinates and altitude (and yaw and pitch!) things could get interesting and we’d really have big data! Revealing newbie ignorance but if there is a way to record the actual flight flown, TIA.
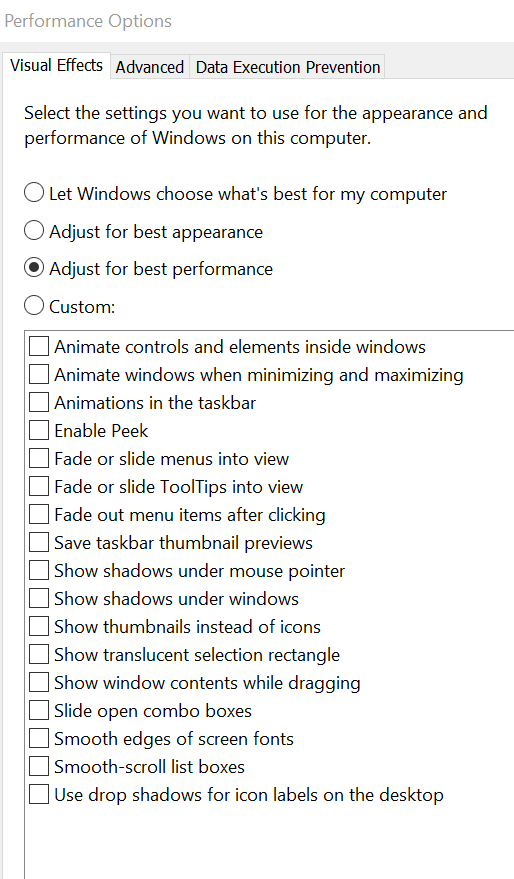
Update: Also note that under This Computer (My Computer), Properties, Advanced System Settings, Performance group Settings button, I have checked Adjust For Best Performance to undo ALL Windows graphic enhancements (is that turned off by default in a game, anyway?).