I hadn’t looked at this for a while, so I found a place with high winds, and also gusty.
KDFW
KDFW 180953Z 19017G28KT 10SM FEW250 04/M09 A2985 RMK AO2 PK WND 20028/0953 SLP109 T00441094


I then let an external tool plot the ambient wind at ground level for a few minutes.
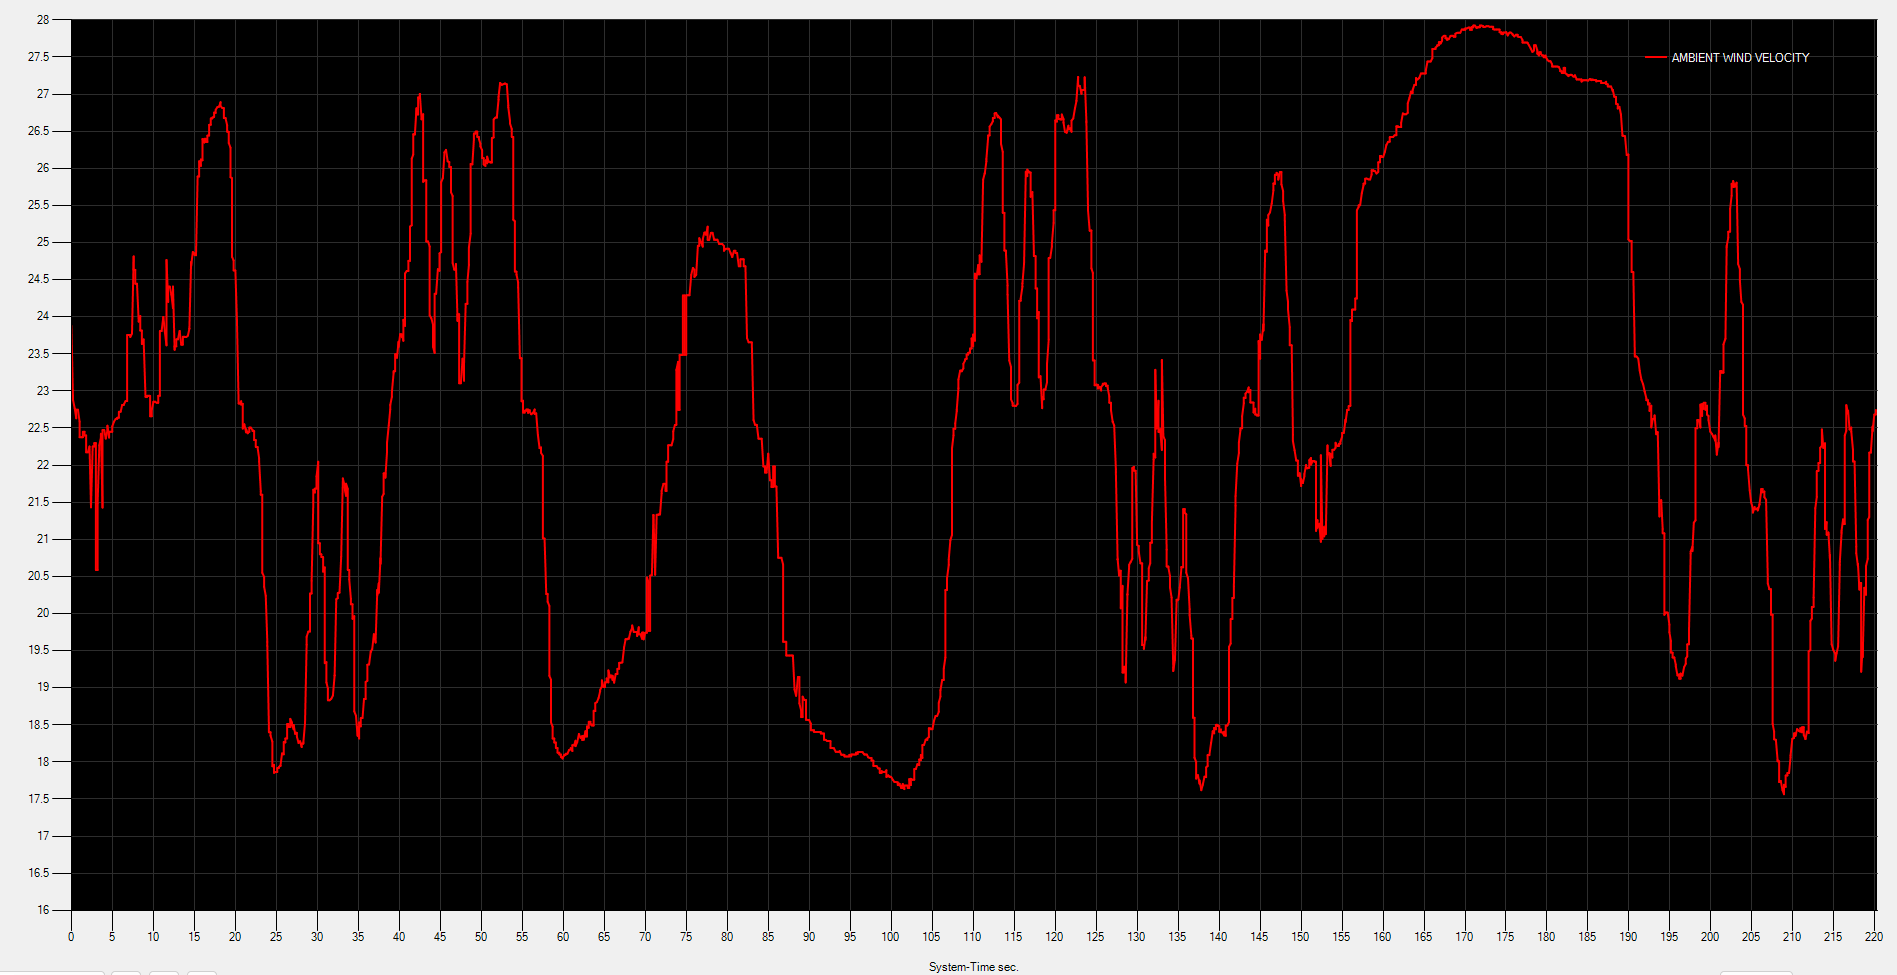
Seems bang on as far as weather gusting from 17kts up to 28kts.
I’ll now look for somewhere else in the world that has similar weather, and see what the pattern is there.
LYTV
LYTV 181030Z 15017G28KT 9999 SCT013 BKN040 16/14 Q1004 NOSIG


And for the plot:

And just in case there was something affecting the results with teleporting around, somewhere with very little wind in the same session.
ZMBH


This place has no reported gusts, but there is always very slight changes in the wind velocity. I left the chart on auto scaling so it looks more energetic than it is, as you can see from the scale on the left, ranging from about 1.4kts to less than 3kts.

What I would argue here is that although the wind strengths are clearly different, and therefore the amplitude changes in the chart, that the tempo or frequency of these changes is roughly the same across all three charts i.e. there doesn’t seem to be much difference in how often the wind changes speed, only the amplitude changes, and that a non-gusting wind area is changing just as fast, and often, as a gusting area, it’s just not as noticeable.
Look across the three charts, and look at these peaks in particular, and see how they correspond across all three of them. That pattern can be seen in all three.
