This is my attempt to measure the differences between basic settings in MSFS 2024, on performance and memory usage on my PC. I thought I’d post the simple and very informal results in case anyone is interested.
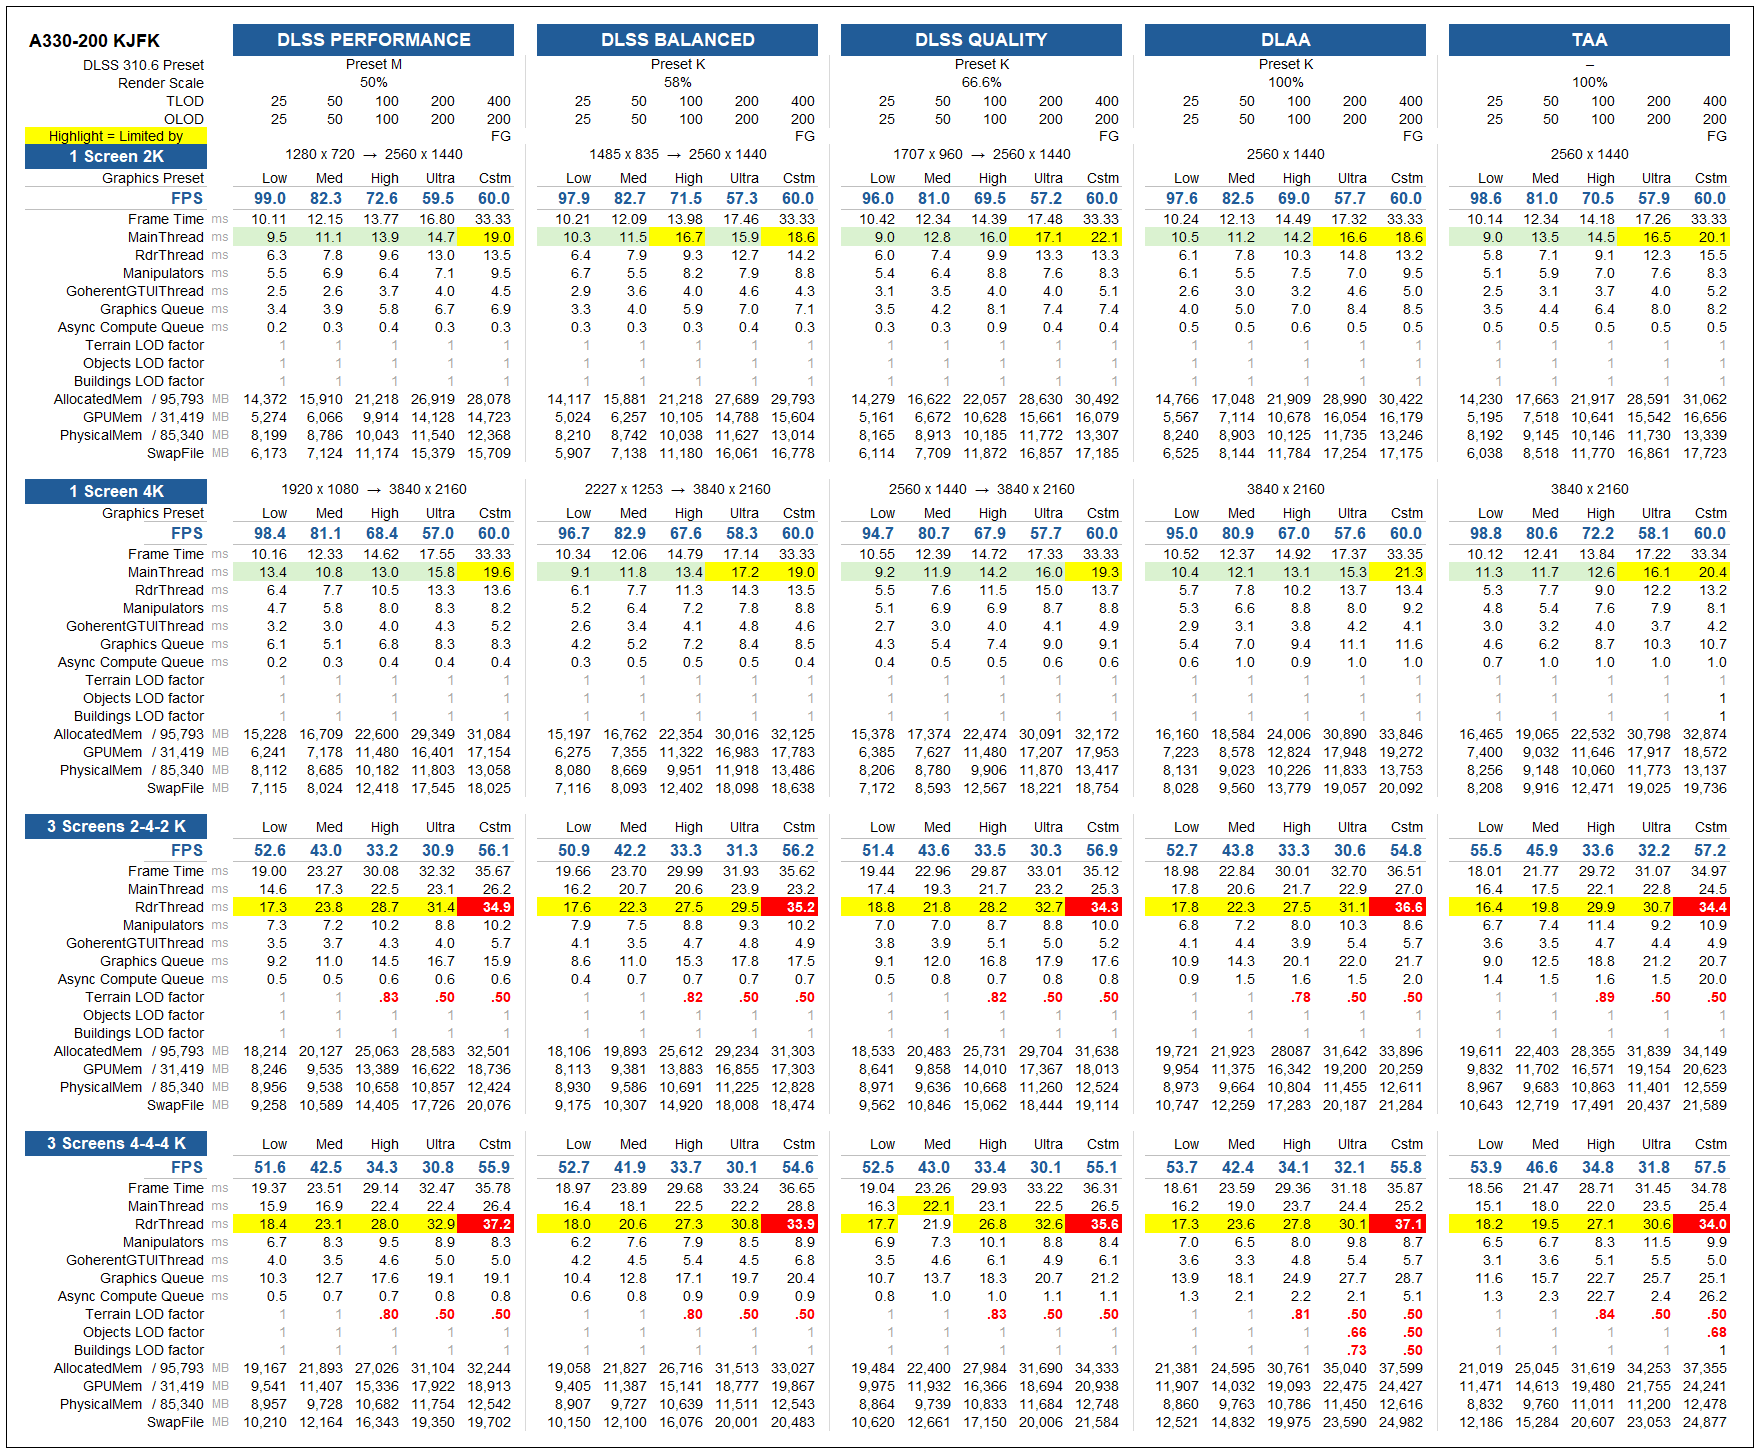
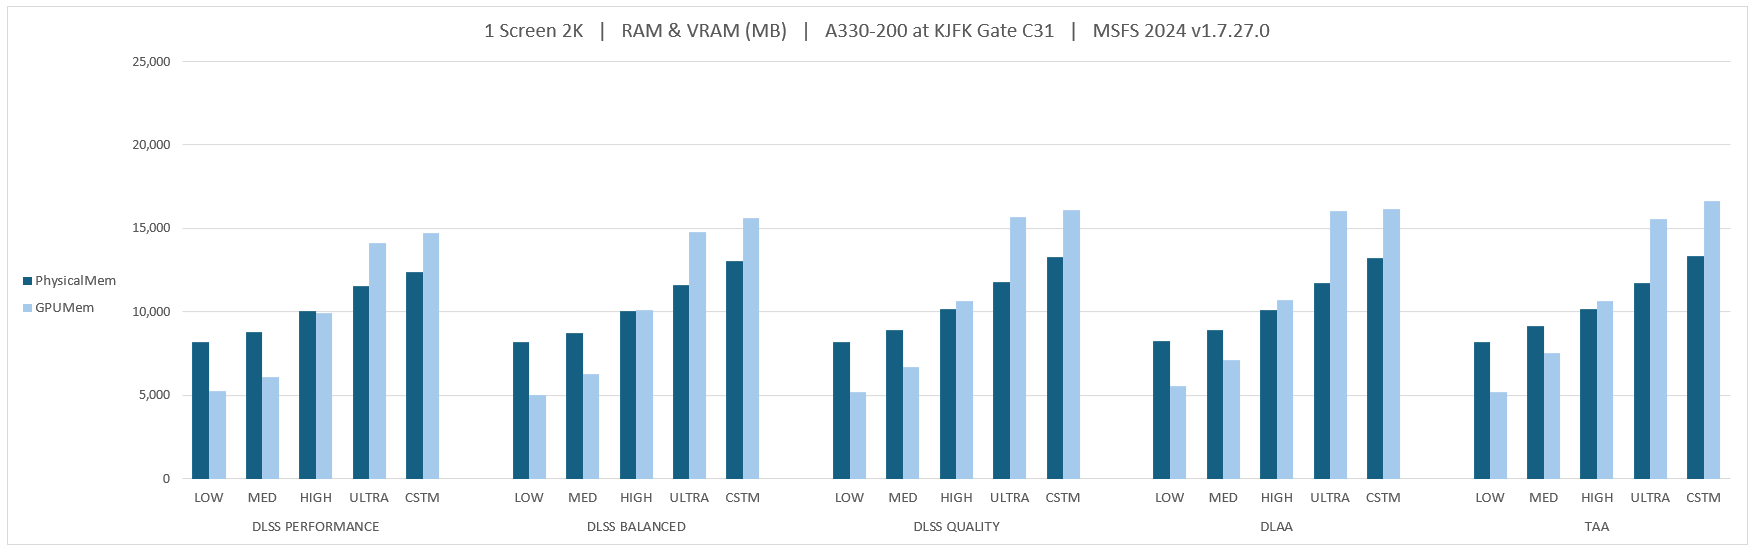
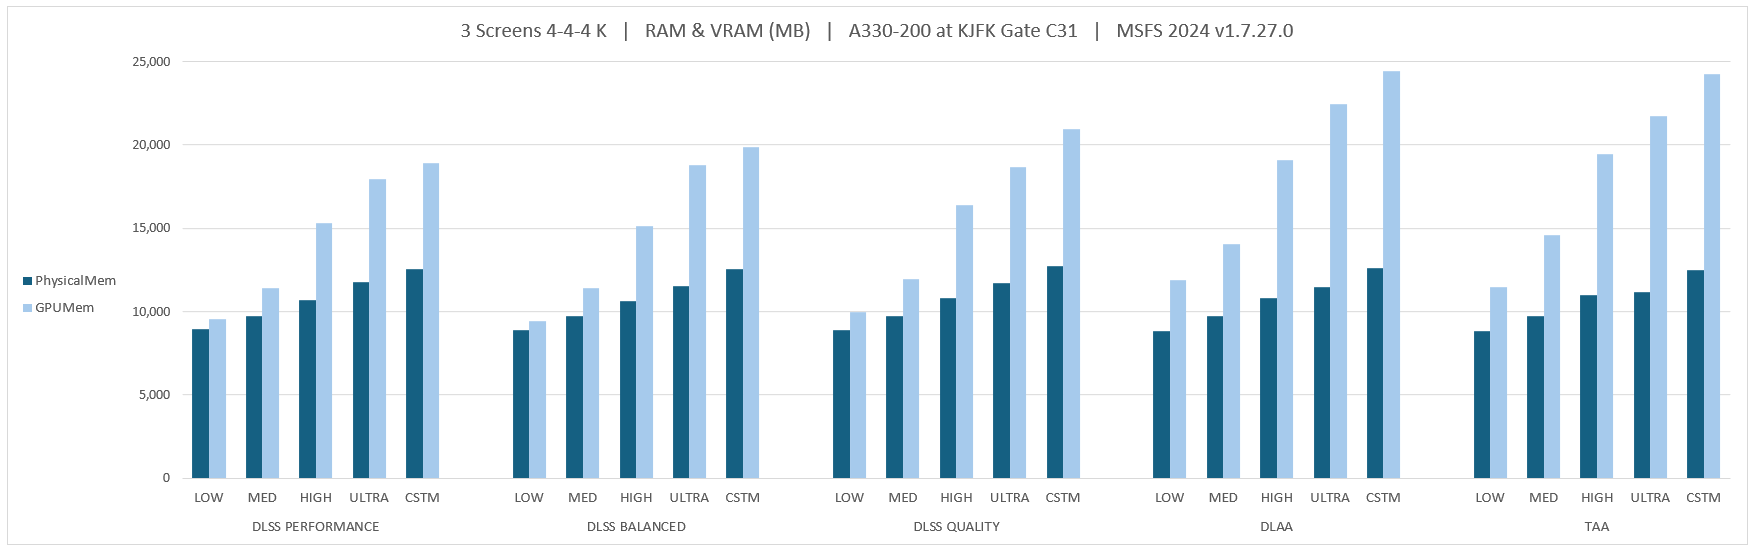
TL/DR: I think I’ve found an artificial Memory Cap, which is alarming. MSFS doesn’t seem to allocate more than:
12 GB of Physical RAM
24 GB of GPU VRAM
The total (“AllocatedMem”) never exceeds 36 GB
I thought it might be useful to have a benchmark to compare against future versions. This is testing SU5 v1.7.27.0.
I am sure others can suggest better / different ways to test, but here’s what I came up with. I wanted to see the differences in performance between the combinations of:
5x Graphics presets: Low, Medium, High, Ultra, and a Custom setting
(Custom = High + Max Frames 30 + Frame Gen x2 and TLOD 400)
5x Anti-aliasing Modes: DLSS Performance, Balanced, Quality, DLAA, and TAA
4x Screen combinations: 2K, 4K, and 3 screens as 2-4-2, and 4-4-4K
That’s 100 combinations!
Disclaimer - I tried to be consistent, but even the act of taking a screenshot affects the numbers (they dip slightly when you do the screen capture) so the results are very informal - but the pattern holds up if tests are repeated.
Test Method
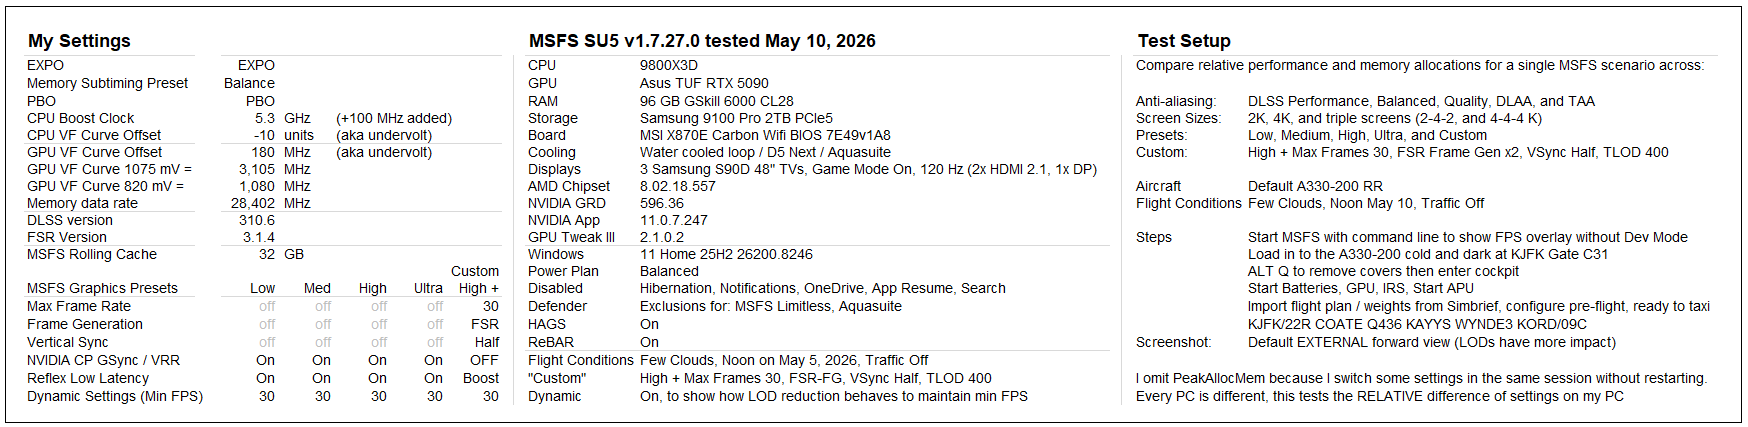
Every PC is different, but I believe the general difference between settings will be similar - or follow a similar pattern - on other PCs (up until you hit a bottle neck). For that reason, I didn’t use “defaults” for my BIOS, but left it in the tuned state I use - again because it is the differences between settings I want to measure.
In order to test, I needed to have a scenario that was easy to repeat, but also included proximity to a large city with photogrammetry and lots of objects to stress LODs. Here’s what I came up with:
Launch MSFS with the command line to display the FPS overlay (without Dev Mode)
Default A330-200
Flight Conditions: Few Clouds, noon on May 10, 2026, No traffic
Load in to KJFK Gate C31
Start the batteries, IRS, APU
Import a flight plan and weights, and do a basic preflight, so systems are active
I selected the external view because the LODs have a greater impact on FPS
Take a screen shot from the default external view to record data
Edit - I think that AllocatedMem is the sum of PhysicalMem + GPUMem. Seb mentioned in a Dev Q&A at the launch of MSFS that memory usage would not exceed 36 GB. From my numbers I think that is “AllocatedMem” and means the COMBINED memory of RAM and VRAM won’t exceed 36 GB?
As memory usage reaches those limits (12 GB RAM / 24 GB VRAM) the sim starts to reduce LODs if you have Dynamic setting turned on - even if you have much more RAM or VRAM available.
I believe this is an arbitrary cap and hope MS / Asobo would consider lifting it as time goes by, for those how have extra PC processing resources.
I am curious if the built in FPS overlay is the best and least intrusive method to show performance or if there are better products. While you are not invoking developer mode to run it, nobody in the know has commented on it’s impact on performance. I have seen lots of other tools being shown in posts that give far more detail but nobody seems to discuss the toll they take on processor and graphics themselves.
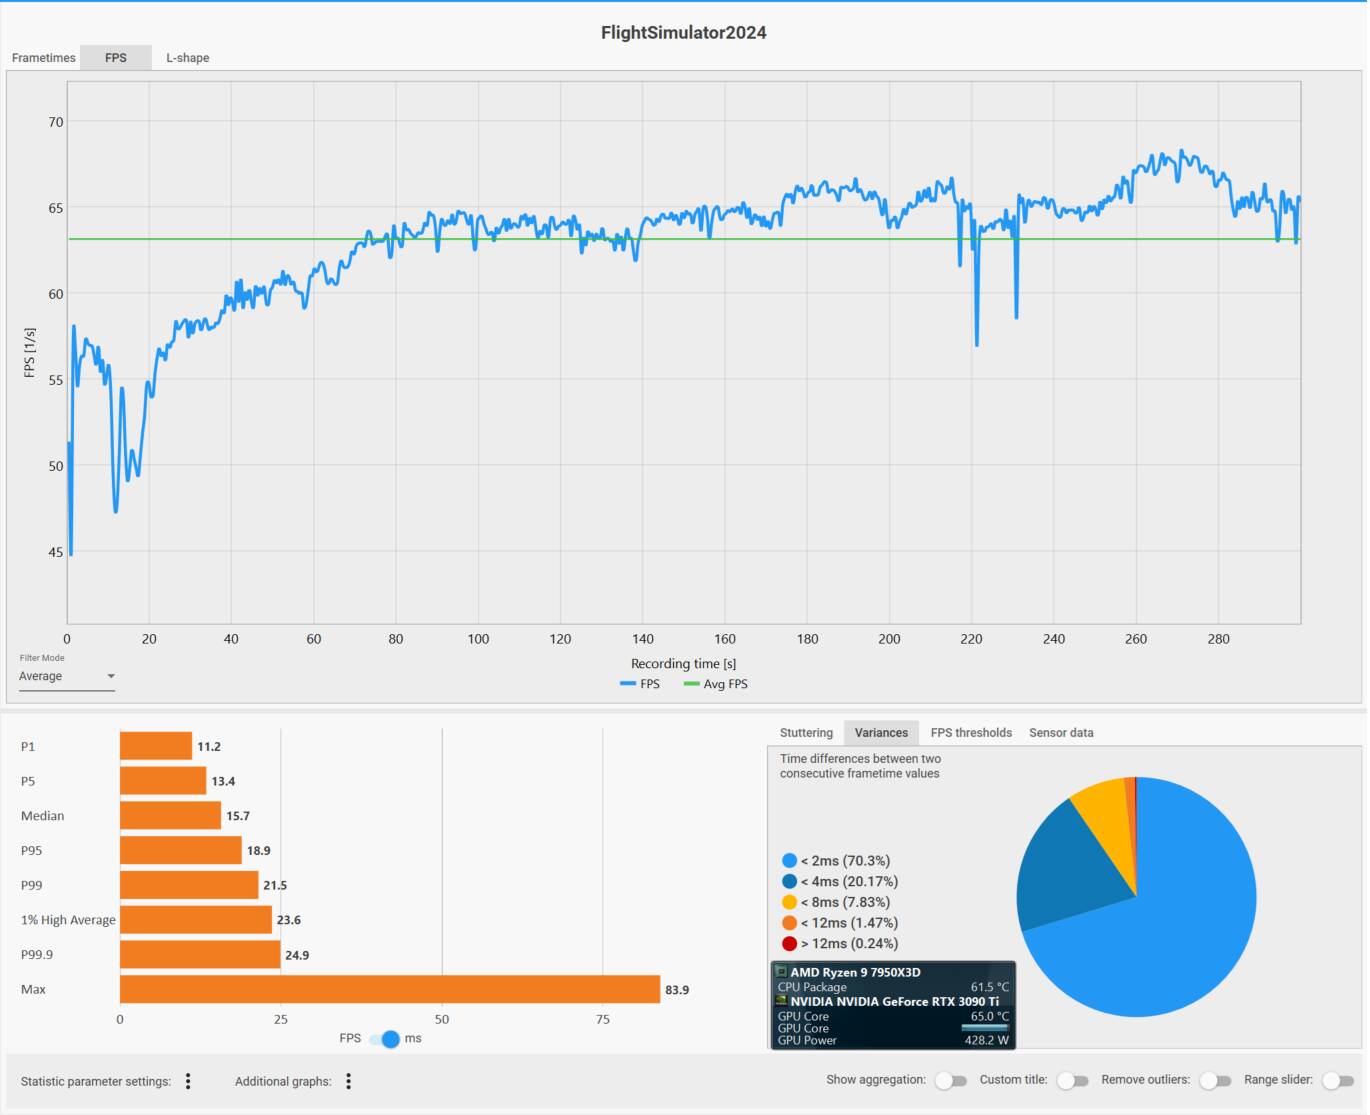
You set it up to run for a period of time (I use 300 seconds.)
It captures framerate (FPS), frametimes (ms), and the all-important frametime variance (%), along with other important metrics.
Run the test, repeat it with a variable change. Here’s an example:
Does CFX use system resources? Certainly. But the goal is test data collection, and its resource usage is the same regardless of the test parameters. For simple monitoring I think Afterburner+RTSS is the best. To be sure, Dev Mode shows more data for realtime monitoring.
Amazingly in depth work mate wow! I’ve got very similar specs to you and was wondering if you could share a zen timings screen grab of your ram tuning figures? I’m using 96gb too at 6000mhz CL28 tuned and interested to see how similar our tune is and if we have similar test results like the ones you’ve done here.
I can later, but here are the numbers in more detail - in a post in the thread for BIOS tuning. I didn’t come up with them, they are presets I stumbled across in the BIOS on my MSI motherboard. When I enabled EXPO, High Efficiency Mode appeared, with 4 Presets: Relax, Balance, Tighter and Tightest. I use Balance at the moment (but I’d have to double check.
I used it because it’s what Asobo put there, and I was primarily interested in the Memory usage, and bottlenecks that cause the LODs to get reduced when the dynamic setting kicks in.
It is a bit intrusive - even taking the screenshot is more intrusive (numbers dip by 3-4 FPS per screenshot). But my main goal was to compare the differences between settings. Since the intrusiveness is equal between tests, it was a moot point for my purposes.
I agree, it’s great, but I used the built in overlay, mostly to see how the metrics Asobo puts there behave - especially memory usage.
CFX when I want to change variables and test performance.
Afterburner+RTSS in flight (always)
Dev Mode when I want to see some deeper realtime metrics (many of which I don’t understand.)
I’m only starting to understand, but I think that Asobo is capping performance on PCs with more RAM and more VRAM.
AllocatedMem seems to be the sum of PhysicalMem and GPUMem (roughly), and it almost never goes above 36 - and when it does, it is reducing LODs by 50%.
GPUMem seems to cap at 24 GB - even if you have more
PhysicalMem seems to cap at 12 GB - even if you have more
This bothers me because my GPU has 32 GB, and I have 96 GB of RAM, so there is room there to use more.
Can you show a screenshot of the FPS Window if this happens? Since it shows the occupied and the available memory.
I think, the SwapFile also has to be considered in the memory management. In my opinion the AllocatedMem is the sum of RAM and SwapFile, whiile the VRAM is handled separately (as it is done in Windows).
Interesting, ok I didn’t think of that - I’ve never understood what the swap file is. I’ll check how they add up.
Regardless, It does seem as if MSFS limits PhysicalMem to 12 GB, which still bothers me, as I have plenty more - and if that’s one of the bottlenecks making triple monitor usage a struggle, I would like the restriction to be reconsidered.
That’s an interesting (and troubling) observation. I’d read comments that suggested SU5 “improved console performance at the cost of limiting performance in high-end PC’s.”
I couldn’t wrap my head around how that was possible.
So having tested a wide range of combinations - see the Results screen shot in the top post - performance and visuals are pretty good, very good, on 1 screen for me on my PC (which admittedly is high end).
However, when I expand to 3 screens, there are obvious bottlenecks that force reduction in LODs. I now believe these are not CPU or GPU bottlenecks, but a hard limit on RAM allocation. I could be wrong, but all you have to do is look at the PhysicalMem and GPUMem stats to see RAM never goes above 12, and GPUMem never goes above 24.
I’ve done a few flights now in SU5, and all were pretty good once in the air away from Ground Objects (OLOD), but at airports the bottleneck(s) are forcing Dynamic LODs down to preserve minimum FPS.
I would love if Asobo would add a test to the next beta to detect the PC’s resources and lift the limits on RAM and VRAM for PCs that have more of either / both.
I can’t say anything about VRAM, since I have only 16 GB, but for RAM it is easy to occupy more than 20 GB. I have intentionally increased my settings to Ultra and LOD 400:
As you can see, more than 20 GB RAM and around 38 GB PeakAllocatedMem. So these two limits do not exist. This is with one 4k Screen, 64 GB RAM and 16 GB VRAM.
Please post your FPS Window. I would be really interested in your values.
All the values in the Results screen shot are from screen shots - it will be the same values…
But your screen shot sort of confirms there IS a limit of about 36 GB… when GPU mem hits your 16 limit, it does seem to be using more PhysicalMem… but the TOTAL AllocatedMem is limited at 36.
Seb said as much in the Dev Q&A when MSFS 2024 launched. I’d like to know why it’s a limit at all, if a PC has more resources, why not use them?
If I understand correclty, the Swapfile is a file on disk for “spillover” from RAM - when RAM exceeds the limit of 36 GB.
If a system has 96 GB of ram, is the Swapfile “in ram”, or on disk? If it’s on disk when more than enough space is available in free ram, then there is a limit being imposed on allocated RAM. I’m asking that to be reviewed. It puts unnecessary wear on the SSD, and fails to take advantage of available RAM.
Swapfile is the pagefile in Windows, and Windows decides, what is kept in RAM and what in the SwapFile. There was a Developer stream where this was explained in more detail. In former times there was an entry VirtualMemory in the FPS Window, which was the sum of RAM, VRAM and SwapFile, but this was split right after this developer stream in order to get a better overview.
The Sim has no influence, what is kept in RAM and what in SwapFile. So the total amount of memory occupied doesn’t matter. There are parts stored in SwapFile already below 10 GB AllocatedMem.
No chance. This question was asked so many times, but Windows memory management was optimised now for 25 years. You won’t change it.