2025.09.07 - Searching for the FPS-needle in the RC-haystack
Before I start posting my actual findings I want to provide some background which will be common to all of my current tests. And I want to explain “the ideas” once … upfront.
Contrary to urban consensus, especially when dealing with a complicated blackbox, a goose would say:
Sometimes correlation is the best indicator for causation which we have.
So I am mainly looking out for correlations between all the following:
- Day of the week … and Time of the day
- … because CDN and API server stress and reachability will differ.
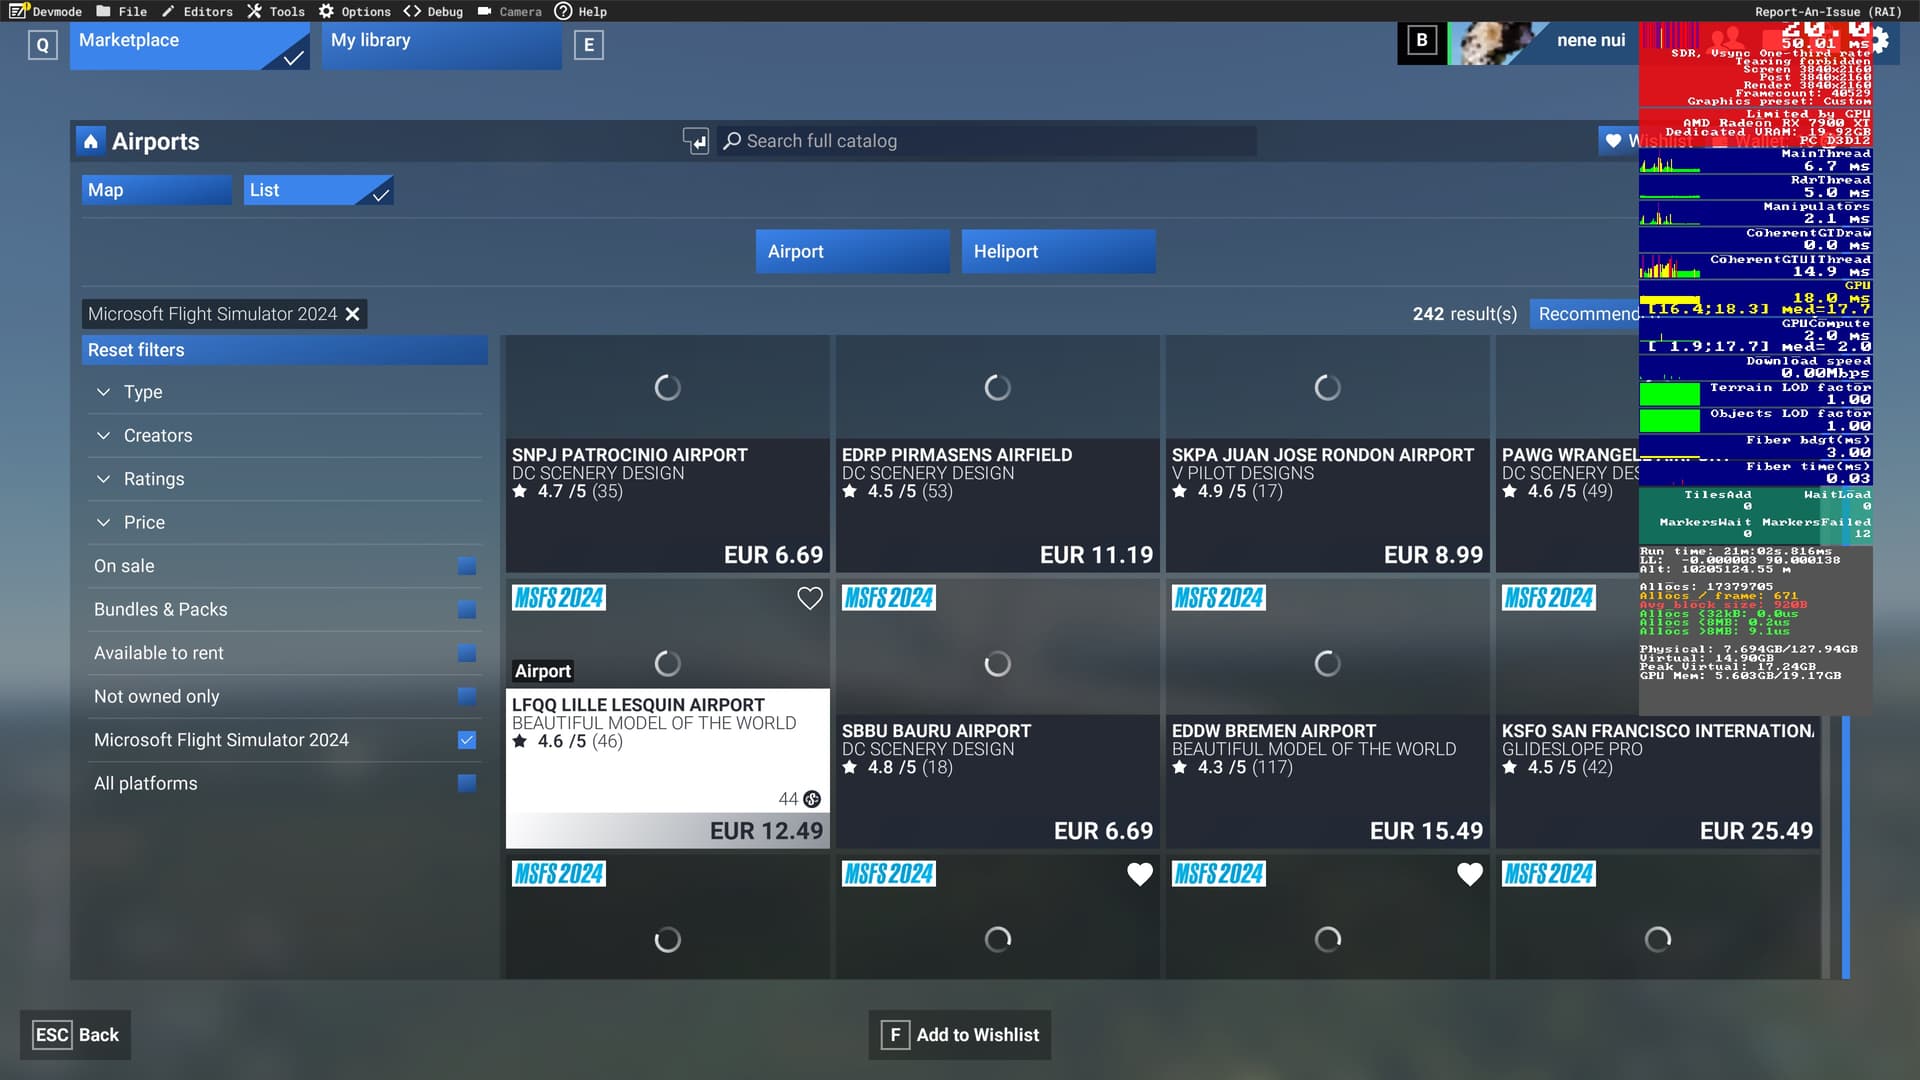
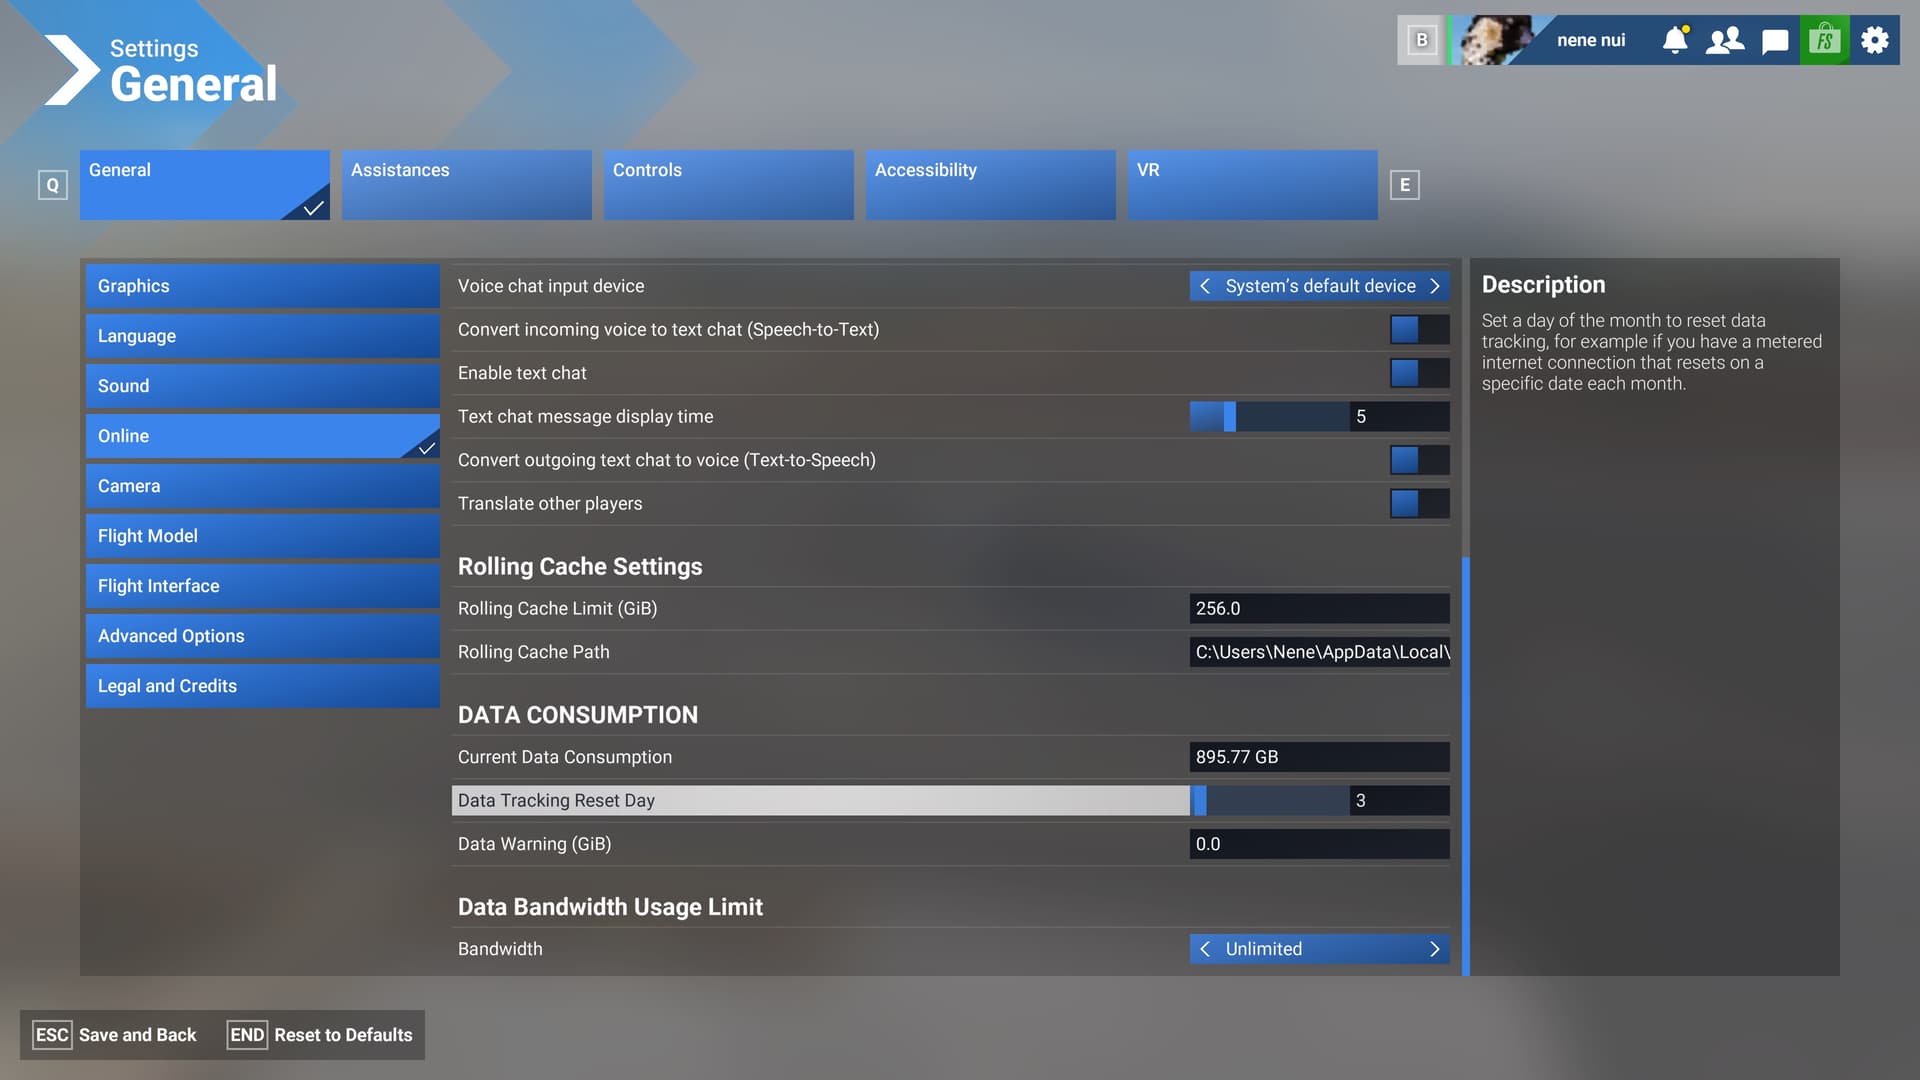
- RC size … and fill rate
- … indicated by the
Online -> Data Consumption information.
- Download speed
- … based on
Debug -> Display FPS information.
- Rendering performance
- … based on
Debug -> Display FPS information
- … with a focus on the “MainThread” milliseconds.
Reduce the noise … to get more signal
The more factors can impact the experiment … the harder it becomes to attribute the observation to a potential cause. Especially if the impact is not deterministic (reproducible). So I try to limit “random” impact and …
- Disable none “deterministic” downloads via:
- Set “Weather” to “Clear skies”.
- Set “Air traffic” to “Off”
- Set “Multiplayer” to “Off”
- Only use 20 FPS with Vsync
- … and a 20 FPS frame rate target.
- Always use the same aircraft
- … which comes from a local Community installation.
Why the 20 FPS VSync?
FS2024 does offer lots of graphics settings which impact rendering performance … a lot. So it is tricky to pick the “correct” settings.
My high level goals have been:
- Force FS2024 to download as much data as possible.
- So I use my full 4K resolution
- … and almost all graphics settings are set to “Ultra”.
- Force Ultra-Stutters on RC or download activity
- … and not lots of micro-stutters.
- The visual stutter of one or two missed frames should be very easy to see
- … even without external FPS measurements.
- Reduce the fan noise
- … so that I can keep the PC running for long periods while doing other stuff in the same room.
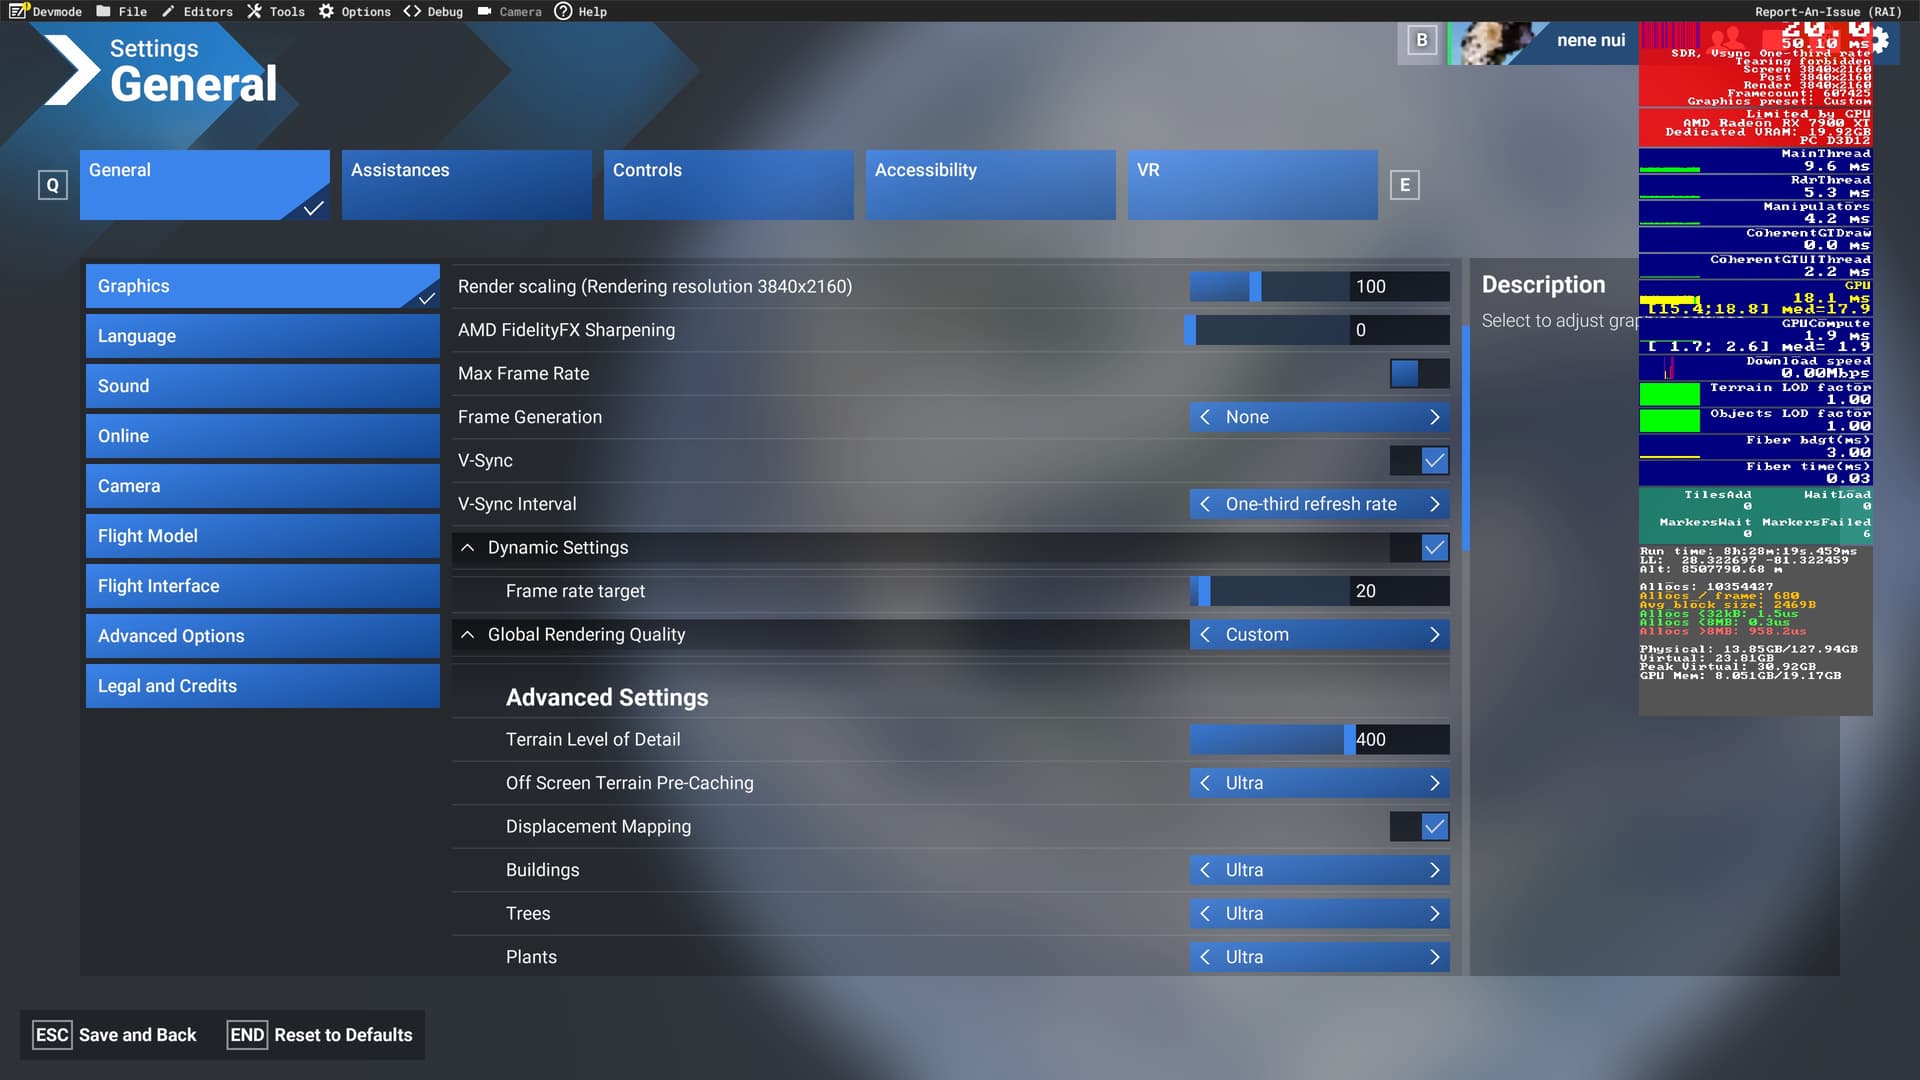
After playing around (too much?) with the different “Graphics” menu options I picked the following settings:
Vsync Interval … is One-third refresh rate (33%)
- This ensures a very precise periodic update pattern.
- At a forced 20 FPS setting each missed frame is 50 ms
- … which is very noticable, because at low altitudes the landscapes will “jump” far.
Dynamic Settings -> Frame rate target … is 20 FPS
- This will dynamically reduce the LODs in order to meet the target FPS.
- The “Terrain LOD factor” in the “Display FPS” overlay will drop below the “green” 1.0
- … which is a clear indicator that the system (main thread?) could not keep up with the 50 ms time budget.
- The
Display FPS information will record a “yellow” segment.
- This also does bring down the power consumption of the GPU and CPU
- … which reduces the fan noise.
- Without a target FPS the render pipeline still seems to try to produce as many frames as possible
- … even when the Vsync has already capped the visual output at 20 FPS.
It would be interesting to retry all tests with many Global Rendering Quality settings being “Low” or “Off” in order to compare the rendering impact. But that would take a loooot of time … and this goose is currently too lazy for that.
“Ultra” settings … for “Ultra” stutters
As a sightseeing goose I always fly in “Ultra” everything, as I want my world to look … nice.
I also know that my system (usually) can deal with 4K-Ultra at 20 FPS reliably and quietly.
My system is usually “MainThread” limited but only rarely needs to apply Dynamic Settings in order to stay below 50 ms.
In order to get “Ultra” stutters for these RC tests I want to keep the “MainThread” busy … and as close to the 50 ms limit as possible. But keeping the “MainThread” so busy requires to ramp up all render options as much as possible.
Not hitting the 50 ms (20 FPS) deadline, e.g. due to the impact of slow data downloads, does cause one, two or more frames to not get rendered in time, resulting in a 50 or 100 ms “hang” followed by a visual “jump” of the landscape. A nice “Ultra”-stutter.
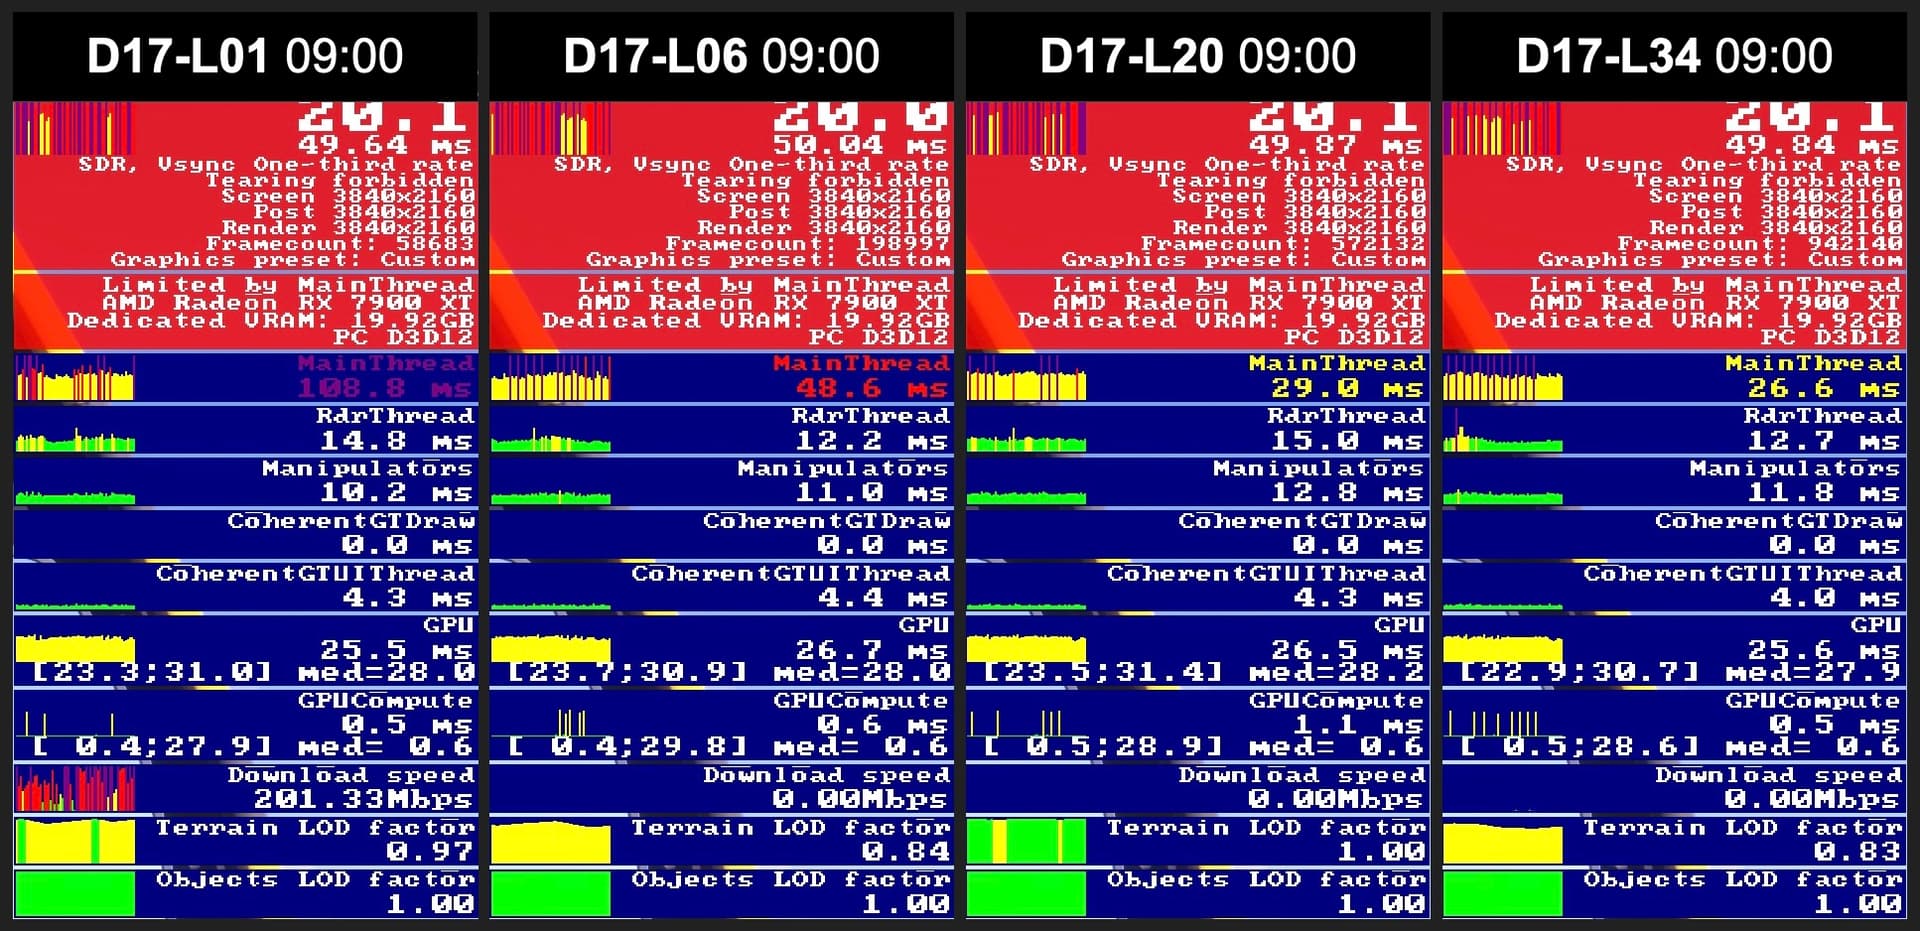
“MainThread” milliseconds
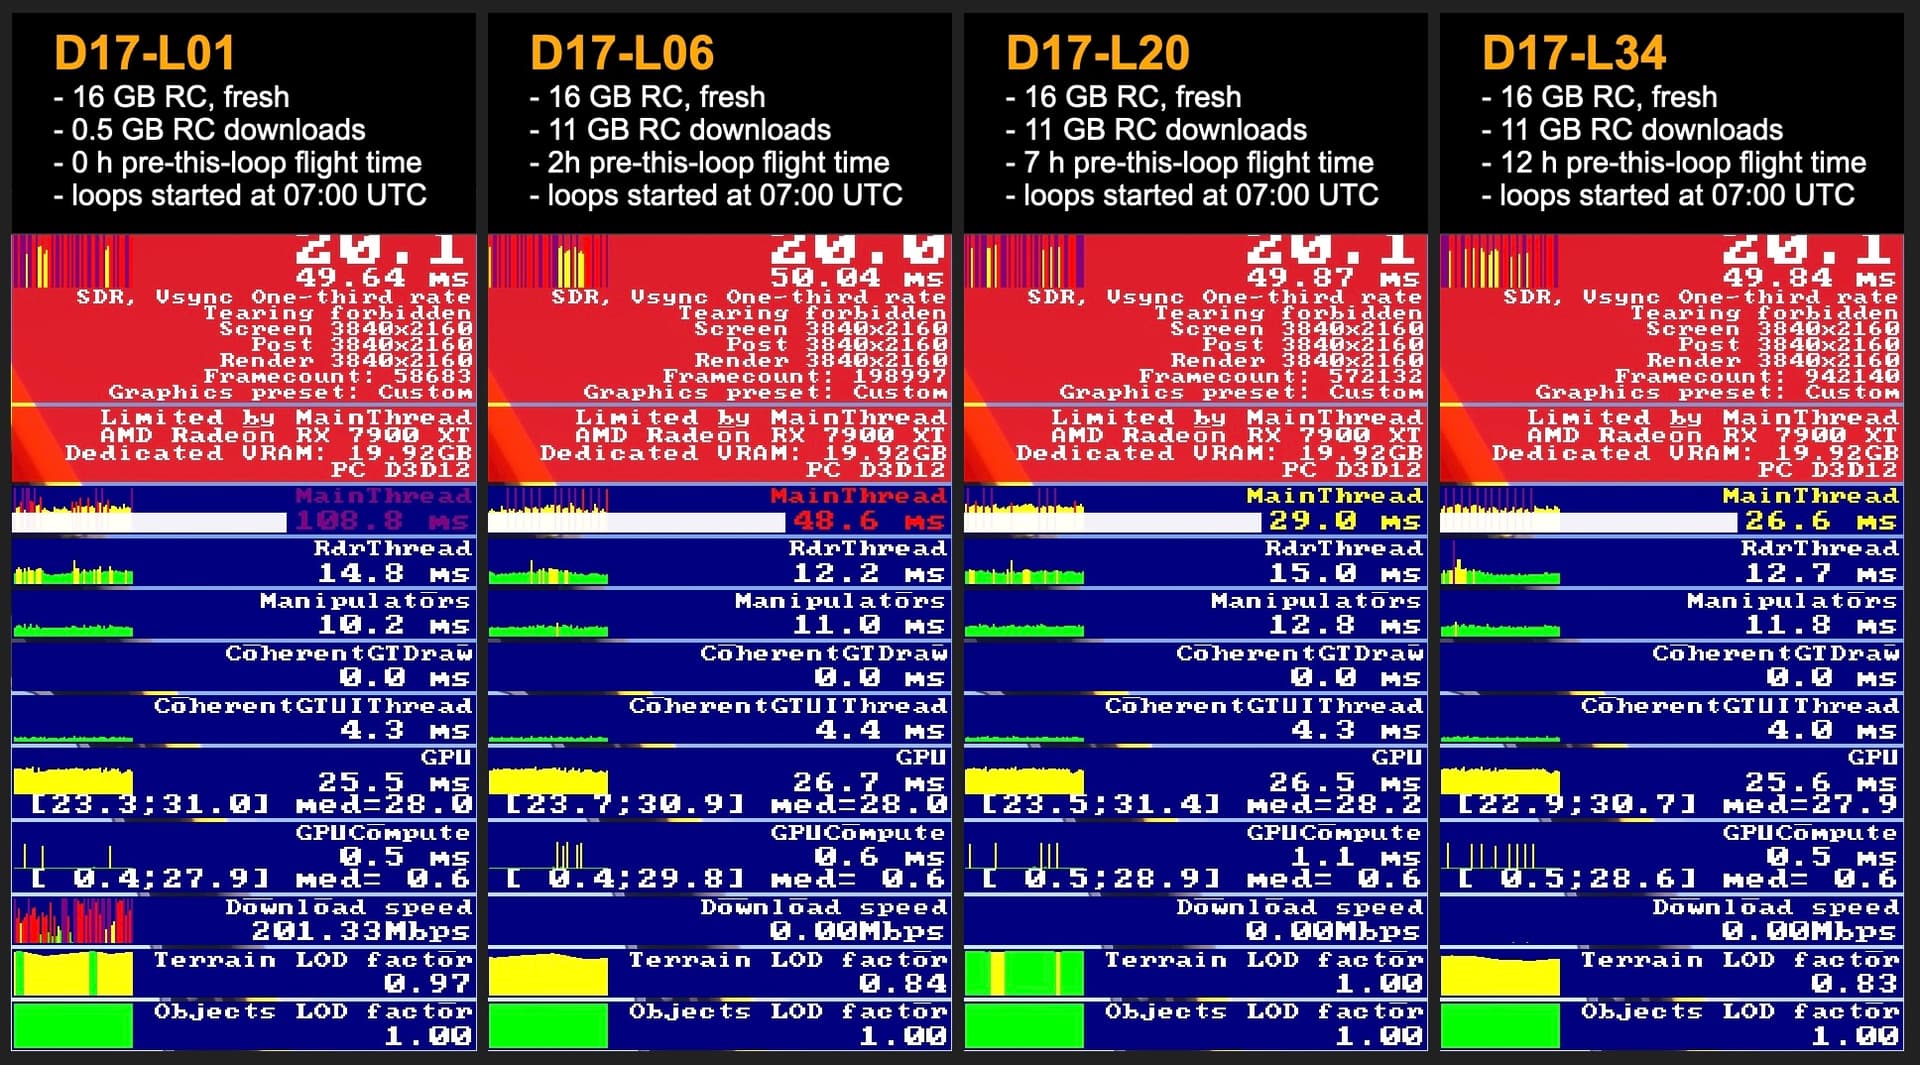
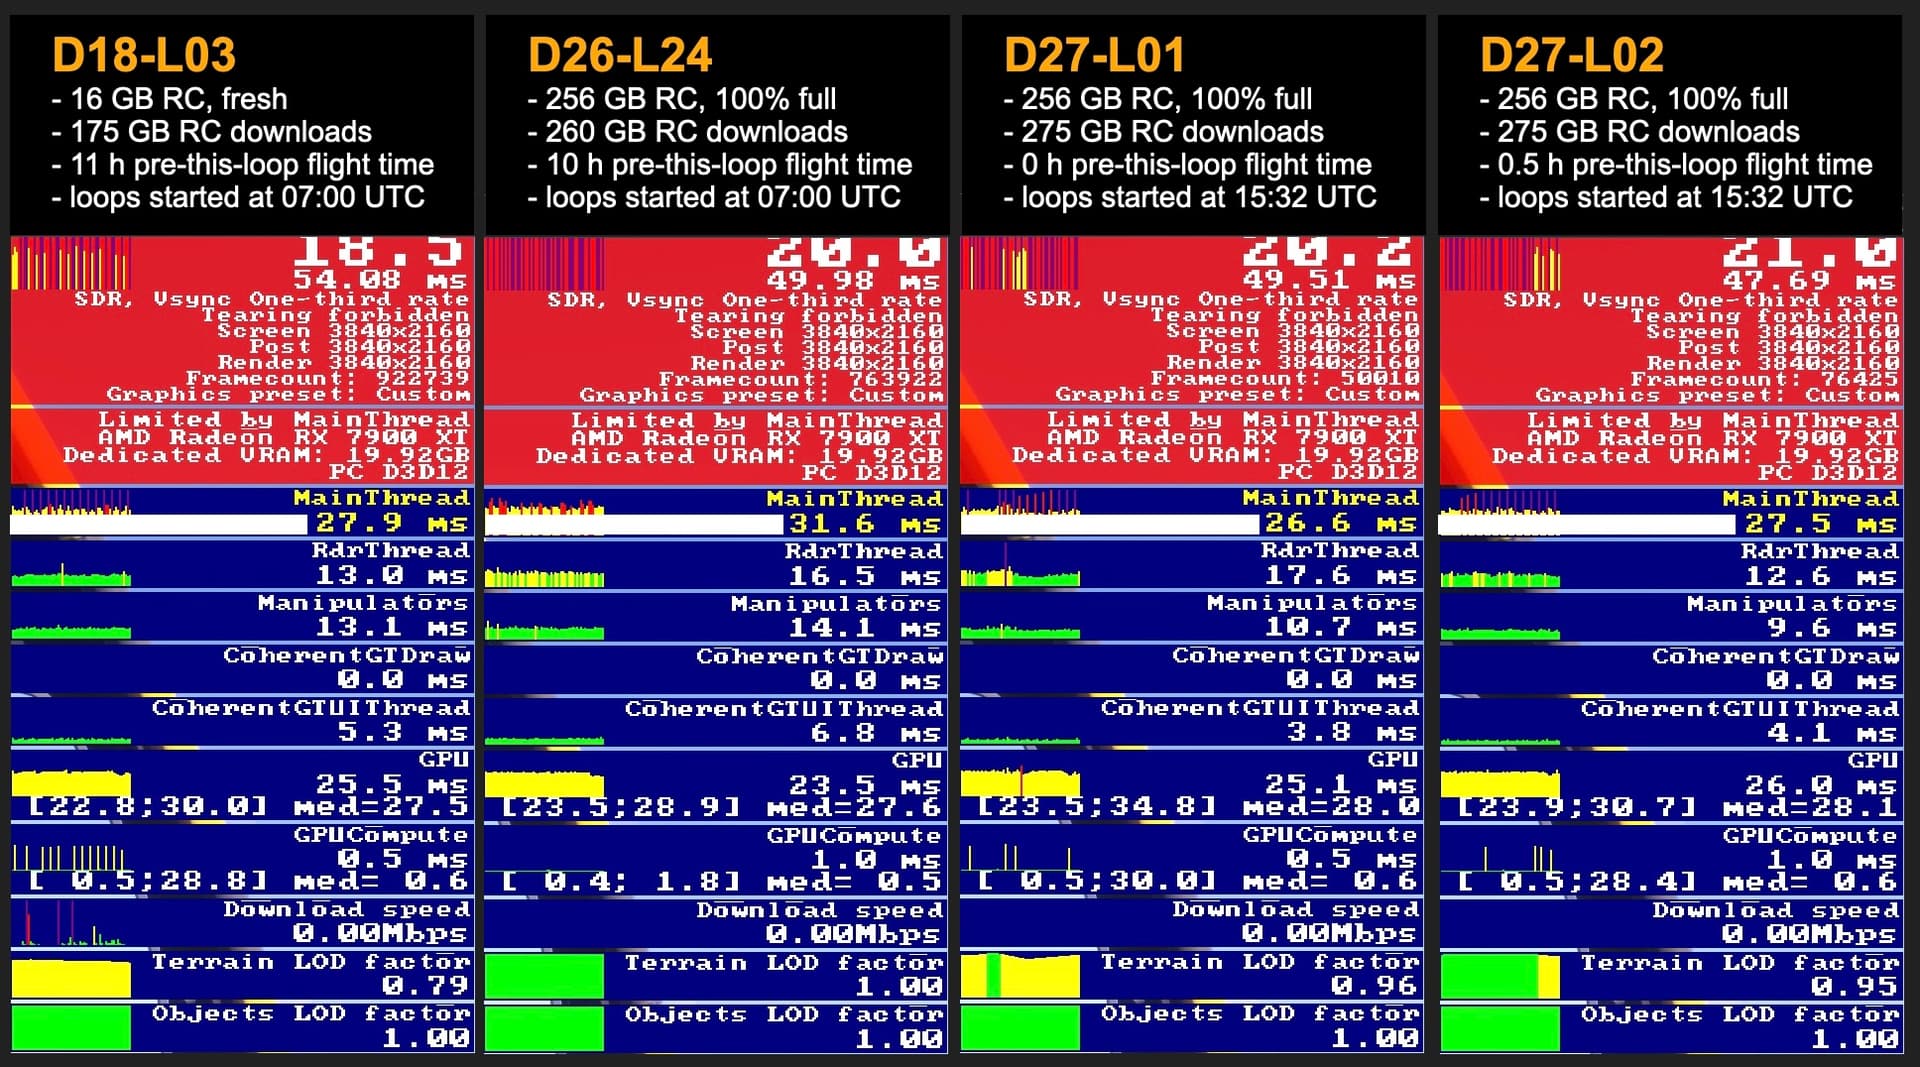
In contrast to the FPS indicator the “MainThread” milliseconds are specific for a single frame, and not an average over a longer period (which the FPS is). So I find the millisecond numbers more interesting.
Normally my “MainThread” clocks at 25 to 30 “yellow” milliseconds. Under “normal” stress it does go up to “red” 40 ms.
But really bad spikes will turn “purple” at over 50 … or like here 108 ms:
I still do not really understand which part of the data processing and rendering pipeline of FS2024 is represented by which measurement of the Display FPS debug overlay. But “MainThread” measurements seem the most likely candidate for including RC and server download related “milliseconds”.
The technical nature of that relationship is really hard to confirm. But there is a clear correlation between high download rates and high “MainThread” measurements.
However, when looking at my Display FPS screenshots, keep in mind that in my 20 FPS the colored graph of the “MainThread” has a time span of 3 seconds, while the “Download speed” covers a span of 90 seconds!
As the “MainThread” usually is the place where everything gets done, unless it really has a dedicated thread, it will most likely also include: event handling, memory management, flight model calculations, …
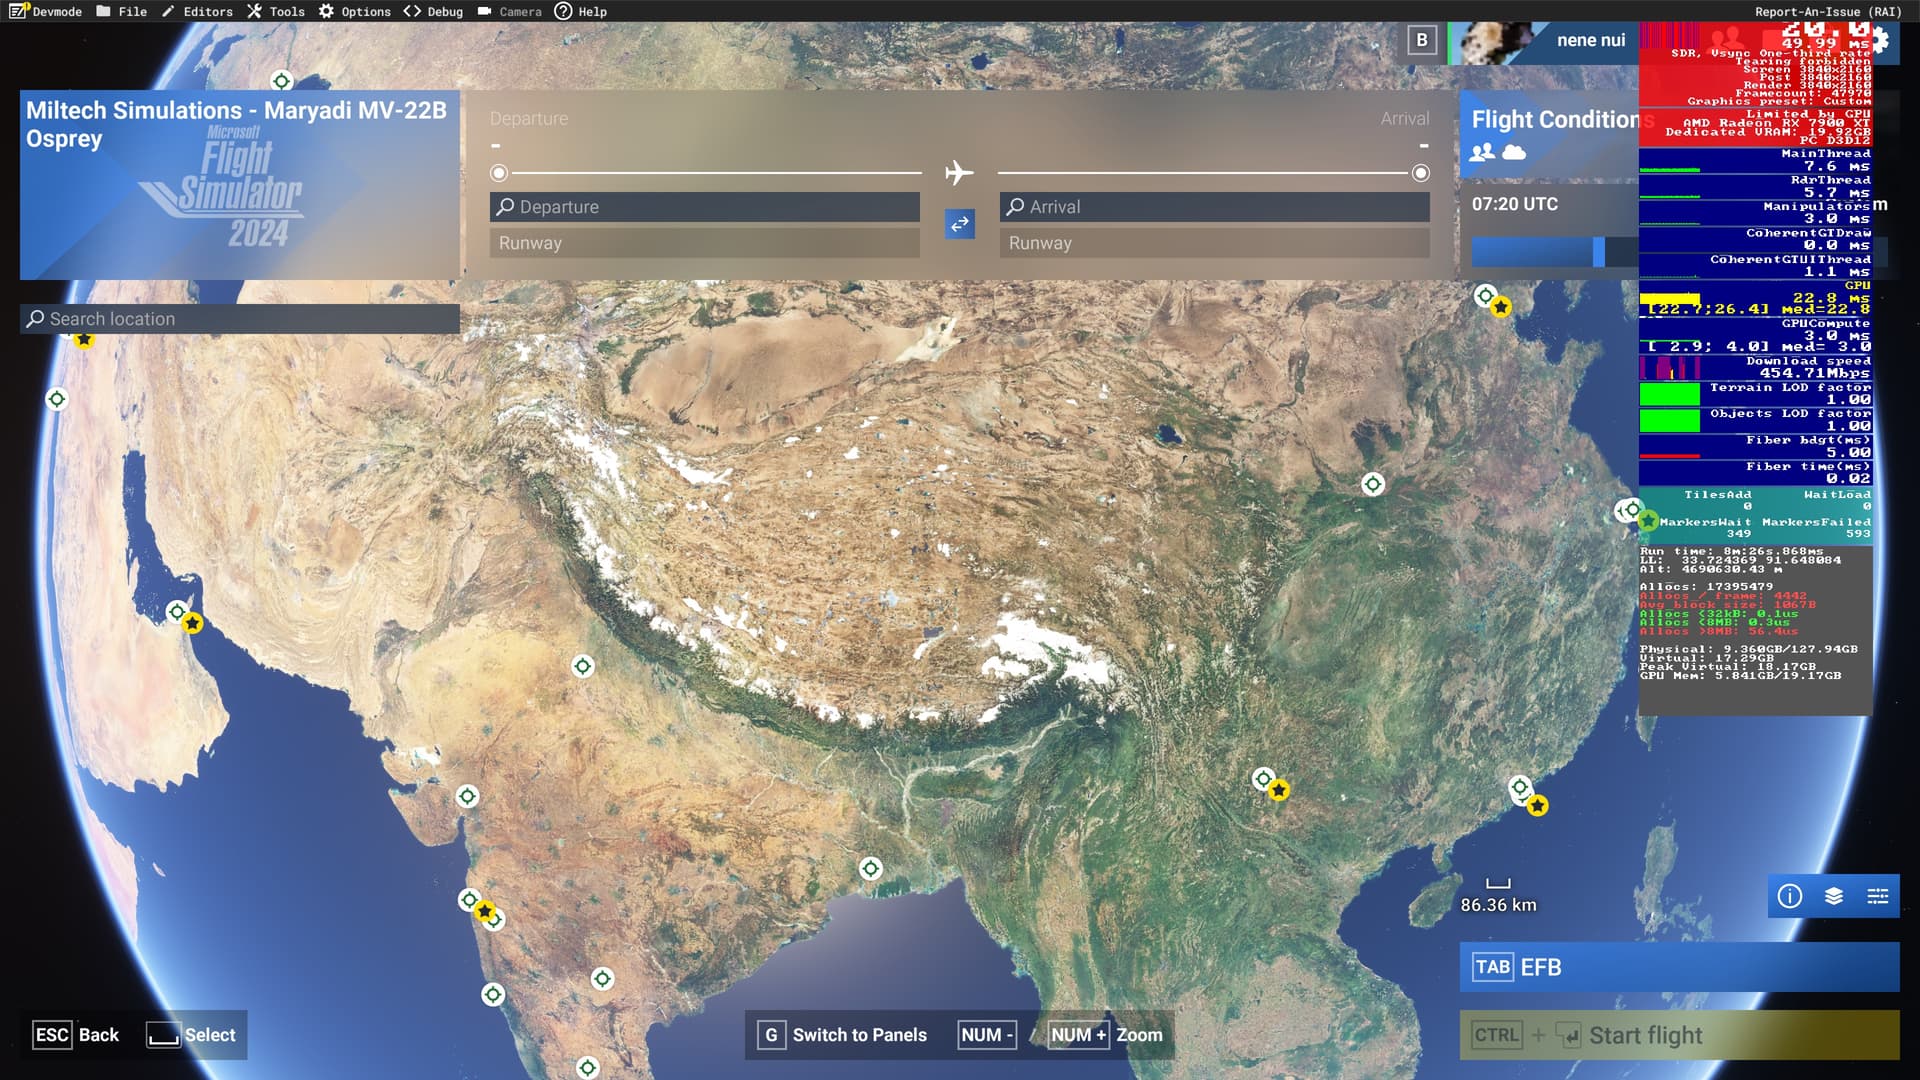
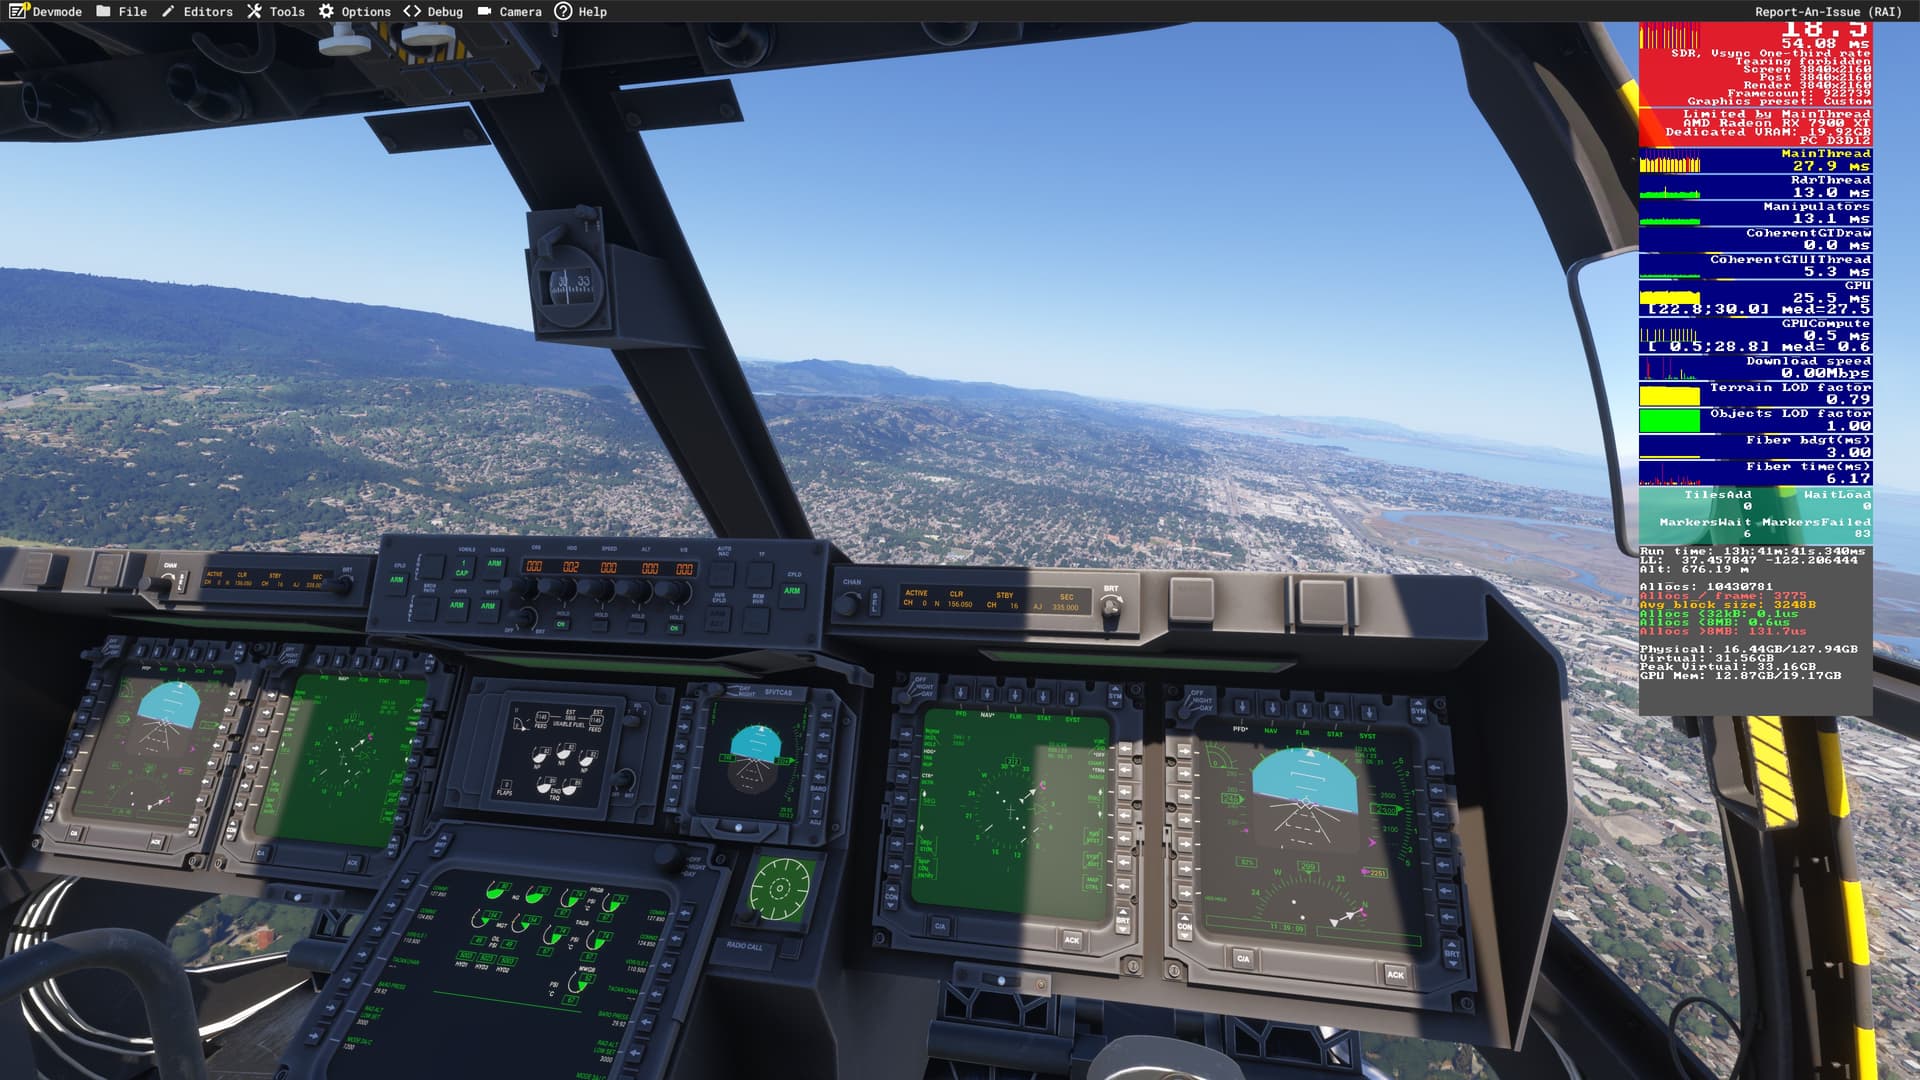
Why the Osprey?
You will see that most of my screenshots do show the Osprey VTOL aircraft.
I am not sure if that is the best choice for these tests … but it is the aircraft that I fly almost all the time, and so I have a good feeling for “what is normal”. My other criteria have been:
- It must have an autopilot
- … to allow fairly automated RC stress testing.
- It must be fast
- … and 290 ktas (max) for the Osprey does speed up the TIN download and RC fill stress procedures.
- It must be “low overhead”
- … and the Osprey model is kind of “old”" and somewhat tuned towards “lower-res”.
- I find the rendering stress to be fairly low … when compared to other FS2024 aircraft.
I was wondering if the use of WASM might be an unpredictable factor. But in level flight (nacelles at angle zero) the Osprey uses the regular FS2024 flight model, and not its custom WASM VTOL flight model.
So I think the impact of the Osprey on the flight observations is reasonably “deterministic”.
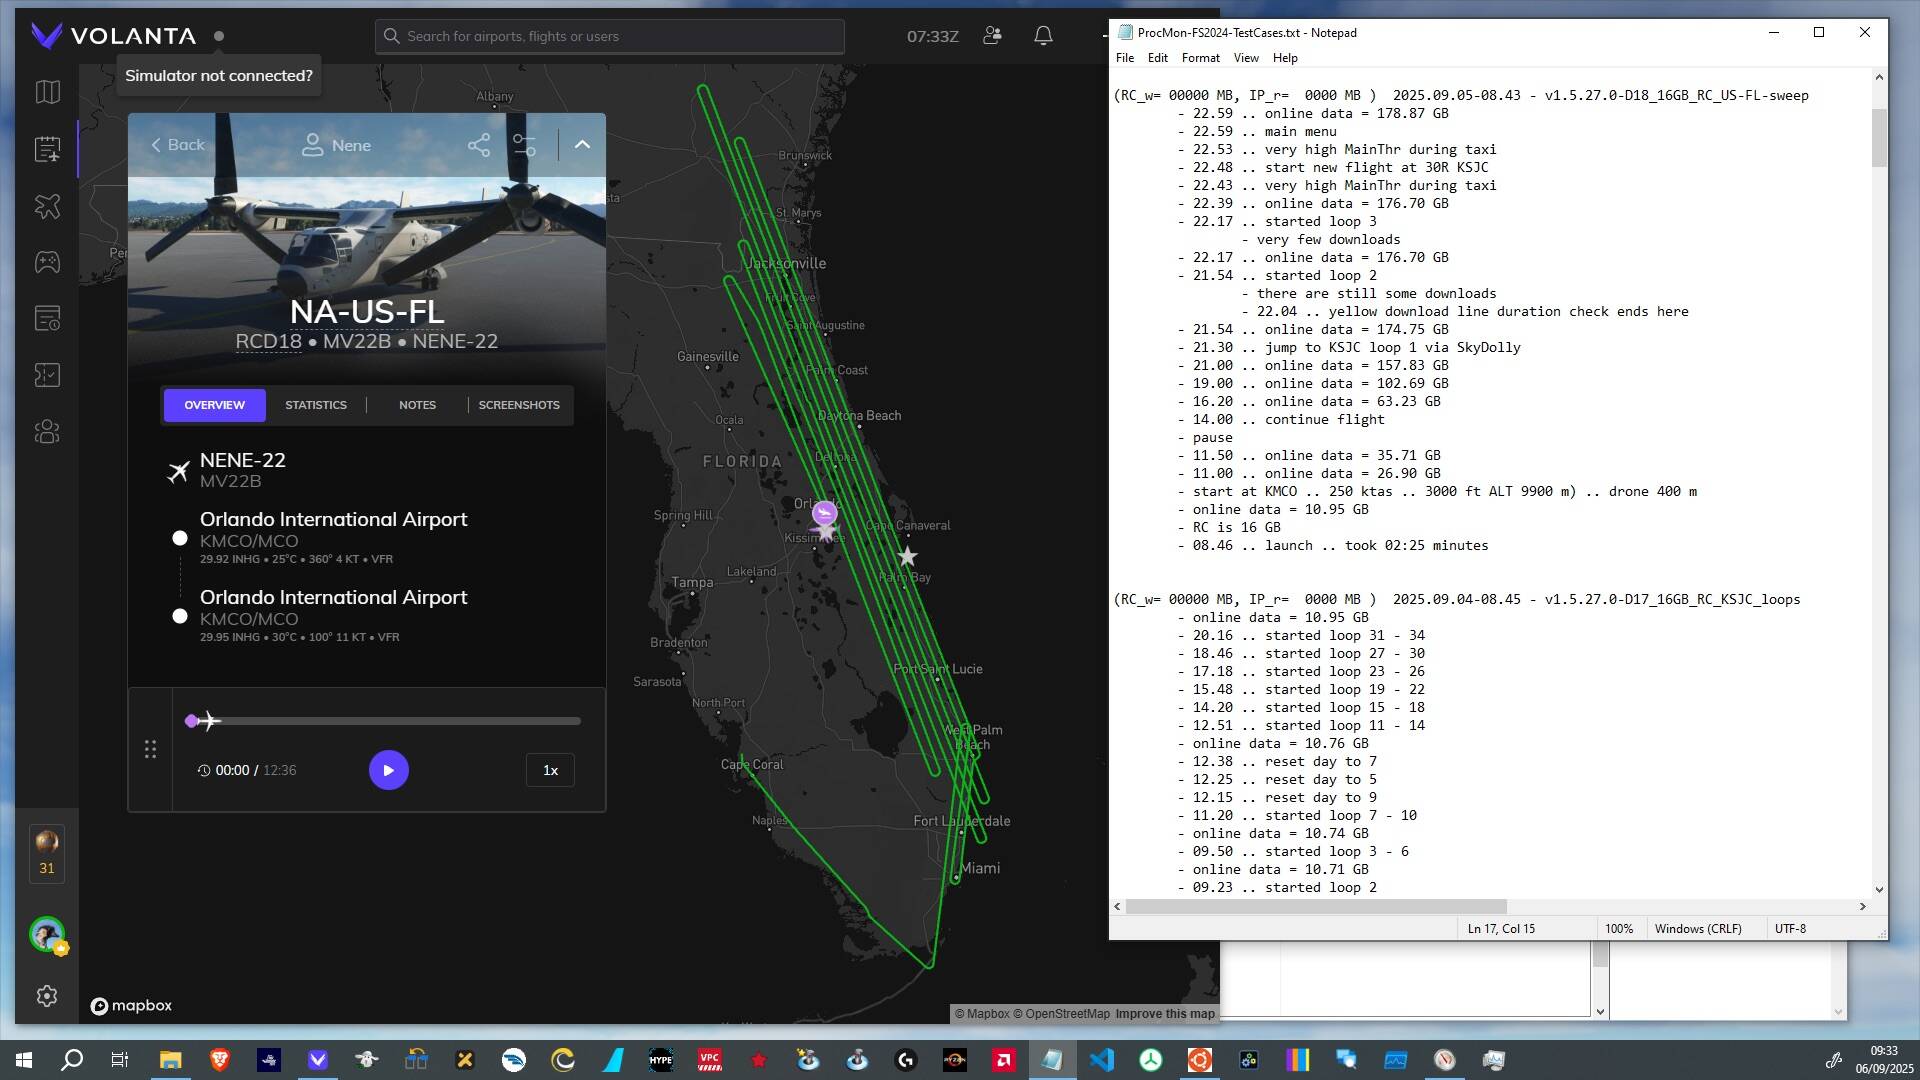
Sweeping TIN regions
For the purpose of ingesting lots of GB into the sim and the RollingCache.ccc file I picked the state of Florida (NA-US-FL) because:
- Florida … has a lot of scanned high-res “TIN” regions
- … and those require a lot of texture and 3D mesh downloads.
- The TIN regions are fairly close together … and mostly near the coast.
- Florida … is basically flat
- … and so I can drag the drone cam under my aircraft at low altitude (e.g. 150 m)
- … and it will not get stuck in one place due to hitting some trees or mountain.
With such a flight pattern I can force the download of ca. 170 GB in 12 hours.
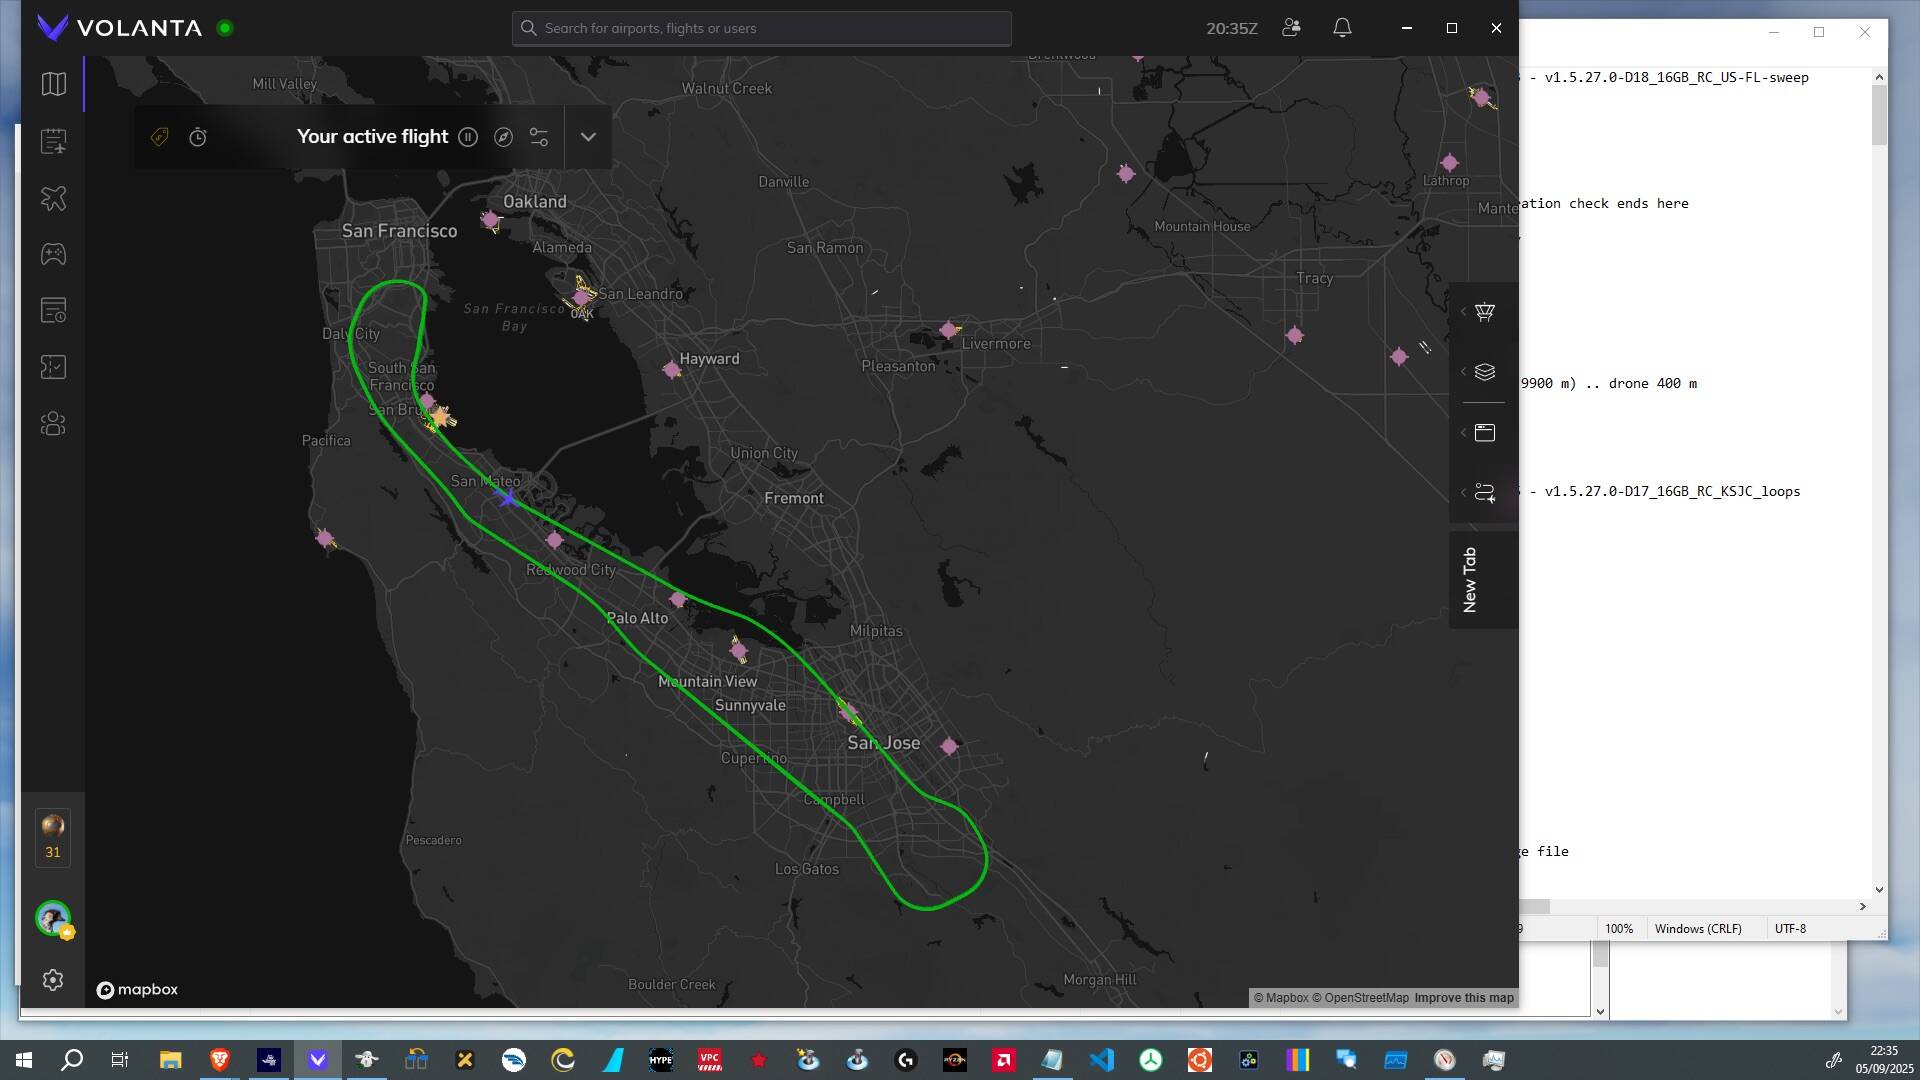
Using recorded test flights … via SkyDolly
In order to perfectly reproduce and repeat a stress test I use SkyDolly as my flight recorder and playback tool.
There is a “native” flight recording features inside FS2024 … “FCR Embedded” … but:
- I fear that it might impact FS2024 from the inside
- … as it might be running in JavaScript and the Coherent UI
- and it might have to deal with very large datasets.
- I have not found a “loop” playback feature in “FCR Embedded”.
SkyDolly allows me to keep the “playback stress” outside of FS2024 … and I can use its “loop” feature.
Only educated guesses
I tried to make “educated” guesses about how my tools and settings might affect the sim, its data pipeline, and its rendering system. But just to be very open about it:
I might be totally wrong with my assumptions!
At least I hope that this allows others to better understand what I tried to achieve during the tests, which my next postings will be focused on.
To summarize this post about my testing approach:
- I run my tests without “Live weather” or “Live air traffic data”
- … so that only “Live (PG/TIN) landscape” is causing downloads during flights.
- I run in 4K-Ultra everything
- … to maximize the landscape and TIN data downloads
- … and to ensure a high rendering stress on the “MainThread”.
- I render with Vysnc and a 20 FPS (50 ms max) render target
- … as my system usually is “MainThread” limited
- … at around 30 to 40 ms with the above settings.
- … and I “hope” that RC or server data input will cause “Ultra”-stutters
- … as it forces my system to fail to stay below 50 ms
… and so it will have to skip one or many “50 ms” frames.